Atrial Flutter and Fibrillation
Atrial fibrillation and its cousin, atrial flutter (typical and atypical), are the most common arrhythmias with which we must deal clinically, yet they are the group of arrhythmias about which we know the least. For the past decade, experimental data as well as clinical electrophysiology studies have allowed a better, but still incomplete, understanding of these arrhythmias. It appears that they represent a heterogeneous group of disorders that are markedly influenced by the functional and anatomic structures of the right and left atrium as well as the autonomic nervous system. Atrial fibrillation and flutter frequently coexist and can appear spontaneously or can be induced in the same patient. As such, this chapter will deal with these arrhythmias.
The clinical and electrophysiologic definitions of atrial fibrillation and flutter are hard to decipher. More recently, atrial fibrillation has been divided into paroxysmal (self-terminating within 7 days), persistent (lasting greater than 1 week or requiring electrical or pharmacologic cardioversion), and permanent (failed cardioversion or not attempted).1 Others have tried to categorize atrial fibrillation by assumed mechanisms, such as a focal atrial fibrillation, vagally mediated atrial fibrillation, sympathetically mediated atrial fibrillation, etc. Atrial fibrillation has also been classified based on whether or not it appears as an isolated electrical phenomenon (lone atrial fibrillation) or whether it is associated with some form of organic disease. All of these classifications have limitations. The fact that there are so many definitions attests to our lack of total understanding of this arrhythmia.
Atrial flutter, about which we know more, is also heterogeneously defined. Typical flutter is a term now used to describe both “classic” counterclockwise flutter in which the inferior leads demonstrate a sawtooth-like undulating baseline with positive flutter waves in lead V1 and negative flutter waves in V6, and clockwise flutter, which has positive, notched flutter waves in the inferior leads and in V6 and negative flutter waves in V1. Both of these patterns are currently believed to be due to reentry with opposite directions of activation (counterclockwise and clockwise) in the same anatomic circuit. The term “atypical” flutter is currently applied to any macrorentrant atrial tachycardia that is different from these two. This might involve an organized rhythm related to prior surgery in the right atrium, around the pulmonary veins (PVs), postablation, or potentially even around a repaired atrial septal defect. Moreover, it is now well recognized that automatic atrial tachycardia can produce an ECG quite similar to that of atrial flutter. Therefore, the differentiation between atrial flutter and atrial tachycardia on the surface ECG alone is often based primarily on rate. As such, the differentiation between “atrial flutter” and atrial tachycardia is really based on whether the tachycardia has a macroreentrant or focal mechanism, something undefinable by ECG alone. It is therefore necessary to distinguish a reentrant mechanism from an automatic mechanism to diagnose “atrial flutter” versus atrial tachycardia when tachycardia rates are 250 to 320 beats per minute (bpm) in the absence of drugs. I prefer to use the terms macrorentrant and focal atrial tachycardia; the term “flutter” is too often misused and incorrect. The term typical flutter should be used to describe macroreentrant, tricuspid-caval isthmus-dependent atrial tachycardia.
Given all these variables, this chapter will discuss the role of electrophysiology studies in evaluating these arrhythmias. Programmed atrial stimulation and endocardial activation mapping techniques have been used to (a) analyze the electrophysiologic substrates of atrial conduction, refractoriness, and ectopic atrial impulse formation that may be responsible for the initiation of either macroreentrant atrial tachycardia (i.e., typical and atypical atrial flutter) or atrial fibrillation; (b) establish the electrophysiologic mechanism and clinical significance of spontaneous and induced macrorentrant atrial tachycardia or fibrillation; (c) provide a method of evaluating the site of origin of ectopic impulse formation (if present) and/or the site and size of the reentrant circuit (if present) of macroreentrant atrial tachycardia by defining patterns of atrial activation during flutter; (d) characterize the presence and extent of an excitable gap in reentrant atrial tachycardia or during atrial fibrillation; (e) provide information concerning the ability to terminate macrorentrant atrial tachycardia by pacing; (f) define sites required for successful ablation of macroreentrant atrial tachycardias and develop electrophysiologic and/or anatomically based procedures to prevent atrial fibrillation; (g) evaluate the effect of pharmacologic agents on initiation and/or maintenance of fibrillation or macroreentrant atrial tachycardia; and (h) define a role of preventative pacing and atrial defibrillation as therapeutic options for atrial flutter and fibrillation. Additional benefits of an electrophysiologic study are the ability to determine the nature of
wide complex rhythms during these tachycardias, which can have clear-cut diagnostic and therapeutic implications.
wide complex rhythms during these tachycardias, which can have clear-cut diagnostic and therapeutic implications.
Electrophysiologic and Anatomic Substrates of Macroreentrant Atrial Tachycardia (Typical and Atypical Atrial Flutter) and Fibrillation
Atrial fibrillation occurs in many disease states, but can occur in the absence of disease, that is, lone atrial fibrillation. Microscopic abnormalities can be found in patients with and without atrial fibrillation which may be part of normal aging. Even in those cases of lone atrial fibrillation, pathologic studies have demonstrated a variety of abnormalities including myocardial hypertrophy, vacuolar degeneration, ultrastructural evidence of fibrillolysis, lymphocytic infiltrates, and patchy fibrosis, all of which suggest a myopathic process with various degrees of inflammation.2 While none of these abnormalities are specific for patients developing spontaneous atrial fibrillation, similar findings were not observed in patients undergoing open heart surgery for Wolff–Parkinson–White syndrome with no history of atrial fibrillation. Moreover, the anatomy of the atria is very complex, as it is derived from regions with trabeculated myocardium (free wall of right and left atrium), multiple orifices (superior and inferior vena cava), coronary sinus (CS), ostia of the PVs, the mitral and tricuspid annulae, and the multilayered region of the fossa ovalis. The atria are a complex three-dimensional structure with many anatomic obstacles as well as variable oriented muscle fiber adjacent to and overlying one another on both the endocardial and epicardial surfaces, particularly in the left atrium (Fig. 9-1). This is most marked around the ostia of the PVs and the adjacent posterior wall (see section on Atrial Fibrillation). These multiple adjoining regions, in and of themselves, produce abnormalities of propagation in the absence of differing electrophysiologic properties. However, to complicate matters, the cellular electrophysiology of the various parts of the atrial tissue vary. For example, along the crista terminalis, cells possess phase 4 depolarization and a prolonged phase 2 following a transient outward current.3 Septal myocardial cells do not show diastolic depolarization and have triangulated action potentials. Other areas in the atrium show postrepolarization refractoriness due to different recovery kinetics of potassium currents and/or impaired excitability. Thus, there is heterogeneity of recovery of excitability or functional refractoriness throughout the atria. Anisotropic propagation is nonuniform and gets progressively more nonuniform with age. Spach et al.4,5 have shown that with aging there is loss of side-to-side connections along the thick muscle of the crista terminalis, which provides a substrate for reentrant excitation in very small areas. The atria are also markedly influenced by cholinergic as well as sympathetic innervation. This has also been shown to occur in a heterogeneous fashion.6 There are several ganglionic plexuses around the atria (Fig. 9-2).7 Thus, the atria have anatomic, electrophysiologic, and neurologic heterogeneity to such an extent that it is surprising why everybody does not have atrial arrhythmias.
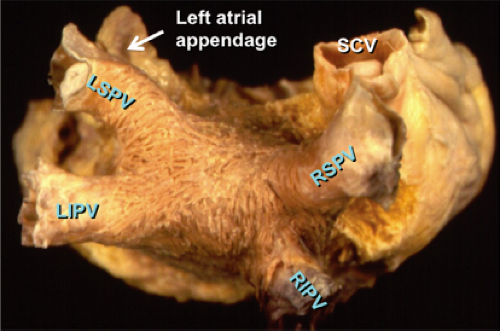 FIGURE 9-1 Architecture of atrial musculature in the left atrium. The left atrium is viewed in the posterior view. The right and left superior and inferior veins (LSPV, LIPV, RSPV, RIPV) are shown. Note the relationship between the left atrial appendage and the LSPV and the superior vena cava (SVC) and the RSPV. Their proximity can lead to far-field signals from these structures recorded in the pulmonary veins. Note the complex arrangement of the left atrial musculature. |
Clinical electrophysiologic observations in our laboratory8,9,10,11 and those of others12,13,14,15 have clearly pointed out certain common abnormalities of conduction and refractoriness present in patients who have macrorentrant atrial tachycardias and/or fibrillation. These are enumerated below.
Conduction Defects in Patients with Atrial Fibrillation and Flutter
Many patients with atrial fibrillation and macroreentrant, tricuspid-caval isthmus-dependent atrial tachycardia (i.e., typical flutter) flutter have significant intra-atrial conduction defects manifested on the surface electrocardiogram by broad (110 msec or greater) and notched P waves in the inferior leads, a negative P terminal force of 1 mm in depth and duration in V1, and/or a delayed terminal positive force in aVL. These are characteristic findings of so-called left atrial abnormality and are present in the vast majority of patients with atrial flutter or fibrillation, regardless of the underlying etiology. The broad notched P wave in the inferior leads is the most common abnormality, while the exaggerated negative terminal force in V1 is the next most common. One or more of these abnormalities are seen in 80% to 85% of patients with these arrhythmias. A third electrocardiographic sign is terminal positivity of the P wave in aVL. In nearly two-thirds of patients, the P-wave duration exceeds 120 msec when all 12 leads are assessed simultaneously. We have now mapped more than 200 patients with left atrial abnormality using standard recordings from the high-right atrium (HRA), the low septal right atrium at the A-V junction, and at the proximal, lateral, and anterior
sites in the CS, and relating the local activation time to the onset of the P wave. As noted in Chapter 2, normal right atrial activation is 35 to 55 msec and activation from the P wave to the CS ranges from 60 to 90 msec.16 For patients with so-called left atrial abnormalities, right atrial conduction time is normal in 80% of patients with a mean right atrial conduction time of less than 50 msec. For the remaining patients, right atrial conduction time was only modestly prolonged except for six patients with dilated cardiomyopathy who had prolonged right atrial conduction times exceeding 62 msec. In contrast, intra-atrial conduction time, as measured from the P wave to the left lateral atrium recorded from the mid- or distal CS was prolonged in nearly 94% of our patients (Fig. 9-3). Where the site of delay is located is unclear, but there appears to be delay between the right and left atrium at the region of Bachmann bundle as well as at the lower septum. A more detailed analysis of intra-atrial conduction during sinus rhythm in patients with atrial fibrillation is important to assess the potential role, if any, of intra-atrial conduction disturbances in the pathogenesis of atrial fibrillation. Detailed mapping with the Carto system (Biosense, Cordis/Johnson and Johnson, see Chapter 3) has been of value in this regard. Correct interpretation of intra-atrial and interatrial conduction requires mapping along the posterior left atrium and left atrial septum in order to more specifically localize the sites of delay.
sites in the CS, and relating the local activation time to the onset of the P wave. As noted in Chapter 2, normal right atrial activation is 35 to 55 msec and activation from the P wave to the CS ranges from 60 to 90 msec.16 For patients with so-called left atrial abnormalities, right atrial conduction time is normal in 80% of patients with a mean right atrial conduction time of less than 50 msec. For the remaining patients, right atrial conduction time was only modestly prolonged except for six patients with dilated cardiomyopathy who had prolonged right atrial conduction times exceeding 62 msec. In contrast, intra-atrial conduction time, as measured from the P wave to the left lateral atrium recorded from the mid- or distal CS was prolonged in nearly 94% of our patients (Fig. 9-3). Where the site of delay is located is unclear, but there appears to be delay between the right and left atrium at the region of Bachmann bundle as well as at the lower septum. A more detailed analysis of intra-atrial conduction during sinus rhythm in patients with atrial fibrillation is important to assess the potential role, if any, of intra-atrial conduction disturbances in the pathogenesis of atrial fibrillation. Detailed mapping with the Carto system (Biosense, Cordis/Johnson and Johnson, see Chapter 3) has been of value in this regard. Correct interpretation of intra-atrial and interatrial conduction requires mapping along the posterior left atrium and left atrial septum in order to more specifically localize the sites of delay.
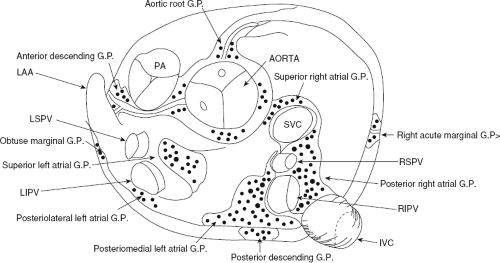 FIGURE 9-2 Ganglionated plexus around the atria in the superior view. PA, pulmonary artery; LAA, left atrial appendage; LSPV, left superior pulmonary vein; LIPV, left inferior pulmonary vein; RSPV, right superior pulmonary vein; RIPV, right inferior pulmonary vein; SVC, superior vena cava; IVC, inferior vena cava. (Modified from Armour JA, Murphy DA, Yuan BX, et al. Gross and microscopic anatomy of the human intrinsic cardiac nervous system. Anat Rec 1997;247:289–298.) |
Other investigators3,17,18 have described the electrophysiologic characteristics of atrial endocardial electrograms from the right atrium. They have quantified them in terms of duration and number of fragmented deflections as defined by the number of negative deflections in the electrogram. Normal electrograms were 74 ± 11 msec in duration with 3.9 ± 1.3 negative deflections. Abnormal electrograms were defined as those with a duration of ≥100 msec and/or eight or more fragmented deflections. Mapping was only performed in the right atrium in all of these studies. Twelve atrial sites, including anterior, lateral, posterior, and septal sites were measured at the high-, mid-, and low-right atrium. Only 23% of control patients had any fractionated electrograms while 68% of patients with paroxysmal, lone atrial fibrillation and 83% of patients with atrial fibrillation/flutter and sick sinus syndrome had abnormal electrograms. Those with the longest duration and the most fractionation were seen in patients with atrial fibrillation and flutter and sick sinus syndrome, and two-thirds of the abnormal electrograms were found in the HRA either posteriorly or laterally. The absence of any left atrial mapping data limited the ability to establish a causal relationship of these abnormal electrograms to the presence of atrial flutter or fibrillation. These electrograms, however, do represent marked nonuniform anisotropy and suggest an increased amount of fibrosis in those patients with these electrograms and atrial fibrillation. Whether these abnormalities are casually related to atrial fibrillation is unknown, but they may represent a potential substrate under specific circumstances.
More recently abnormal, multicomponent electrograms have been recorded in the LA near the antrum of the PVs. Pacing either the RA or LA increases the fragmentation, suggesting a prominent role of nonuniform anisotropy and the three-dimensional structure with variable fiber orientation
seen in the LA, particularly near the PVs. A recent study compared sinus rhythm fractionated EGMs (SRFs) and complex fractionated EGMs (CAFÉs) during AF in the LA in patients with persistent AF and normals.19 The investigators showed no difference in the distribution of fractionated EGMs in sinus rhythm between patients with AF and controls and no correlation between CAFEs and SRFs. Most SRFs were recorded in areas of collision of activation wavefronts. These data cast doubts on the relevance of fractionated EGMs in sinus rhythm to the genesis of AF.
seen in the LA, particularly near the PVs. A recent study compared sinus rhythm fractionated EGMs (SRFs) and complex fractionated EGMs (CAFÉs) during AF in the LA in patients with persistent AF and normals.19 The investigators showed no difference in the distribution of fractionated EGMs in sinus rhythm between patients with AF and controls and no correlation between CAFEs and SRFs. Most SRFs were recorded in areas of collision of activation wavefronts. These data cast doubts on the relevance of fractionated EGMs in sinus rhythm to the genesis of AF.
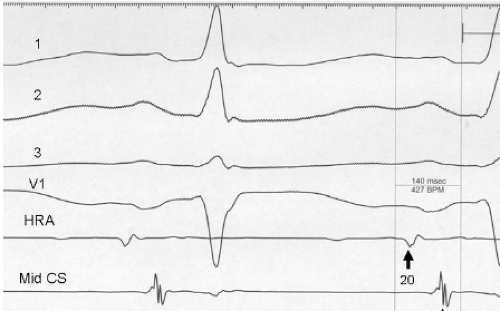 FIGURE 9-3 Atrial activation of electrocardiographic left atrial abnormality. Intracardiac recordings from the high posterior right atrium, mid, and lateral coronary sinus demonstrate delayed left atrial activation in the patient with ECG left atrial abnormality. |
We and others have been interested in evaluating the response of intra-atrial conduction to atrial extrastimuli during atrial pacing at cycle lengths of 600 and 450 msec.9,10,11,12 In our initial studies9 we analyzed standard recordings from the HRA, the His bundle recording site, and the midcoronary sinus to evaluate intra-atrial conduction times, maximum intra-atrial
conduction delay at both the A-V junction and midcoronary sinus, and the zone of coupling intervals over which delays were noted. No conduction delays were noted in response to late coupled extrastimuli in both control patients and those with atrial fibrillation or flutter. However, as extrastimuli were delivered with increasing prematurity, progressive intra-atrial conduction delay occurred. In patients without a prior history of arrhythmias (controls), intra-atrial conduction delays only occurred at coupling intervals just above refractoriness, whereas in those patients with a history of atrial flutter and or fibrillation, conduction delays occurred at much longer coupling intervals (Figs. 9-4 and 9-5). The differences in response to atrial extrastimuli between control patients and those with atrial flutter or fibrillation are shown in Figures 9-3 and 9-4. While in the control patients there was very little conduction delay up to atrial refractoriness, in patients with a prior history of typical tricuspid-caval isthmus-dependent atrial flutter of fibrillation these atrial conduction delays were seen beginning 50 msec above refractoriness. There are no data available in patients with other macroreentrant atrial tachycardias, although the association with atrial fibrillation suggests they would respond similarly. Thus, the relative refractory period (RRP) of the atrium is longer in patients with a history of typical atrial flutter or fibrillation. Although the degree of
local delay at the high-right atrial stimulation site was similar in both control patients and those with atrial flutter and fibrillation, the maximum intra-atrial conduction delay in response to premature high-right atrial extrastimuli at a paced cycle length of 600 msec was greater in patients with a history of atrial flutter and fibrillation than in control patients when measured both at the A-V junction and at the CS (Fig. 9-6). Of note, when atrial extrastimuli were delivered at a paced cycle length of 450 msec, there was no difference in maximum conduction delay between control patients and those with atrial flutter and fibrillation. This was related to the ability of the control group to achieve shorter coupling intervals, and maladaptation of refractoriness noted in patients with a history of atrial flutter and fibrillation (see subsequent paragraphs). These data, however, suggested that a greater degree of intra-atrial conduction delay in response to relatively late atrial extrastimuli might be a marker for those patients predisposed to atrial arrhythmias.9,12
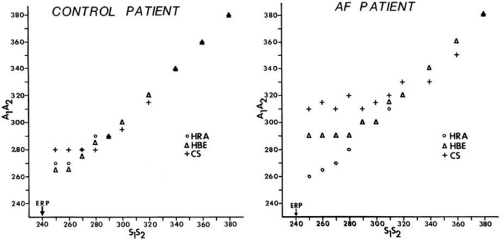 FIGURE 9-4 Response of intra-atrial conduction to premature stimuli in a control patient (left) and a patient with spontaneous atrial flutter (AF, right). S1-S2 represents coupling intervals of extrastimuli to the last beat of an eight-beat drive at paced cycle lengths of 600 msec for each patient. A1-A2 represents conduction times to recording sites at the high-right atrium (HRA), His bundle electrogram (HBE), and coronary sinus (CS). Note the large zone of coupling intervals over which conduction delay is observed to recording sites at HBE and CS in the patient with a history of atrial flutter and/or fibrillation (right panel) and the greater degree of conduction delay at each recording site in the patient with atrial dysrhythmia. Stimulation in each patient was performed at the right atrial appendage at a drive cycle length of 600 msec. ERP, atrial effective refractory period. (From Buxton AE, Waxman HL, Marchlinski FE, et al. Atrial conduction: effects of extrastimuli with and without atrial dysrhythmias. Am J Cardiol 1984;54:755–761.) |
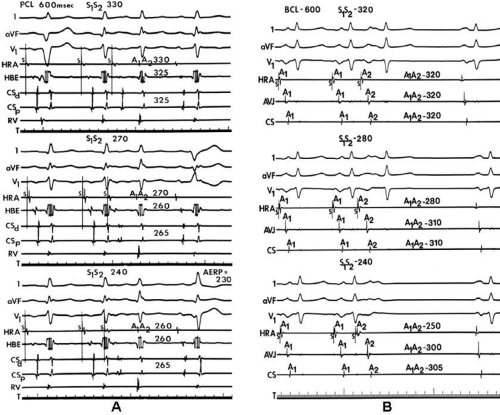 FIGURE 9-5 Response of intra-atrial conduction to premature stimulation at a paced cycle length (PCL) of 600 in a patient with and without a history of atrial flutter/fibrillation. A: Response of intra-atrial conduction to premature stimulation at a paced cycle length (PCL) of 600 in a patient without a history of atrial flutter/fibrillation. From top to bottom, leads 1, aVF, V1, electrograms from the HRA, HBE, distal (CSd), proximal (CSp), and RV. The atrial effective refractory period (AERP) in this patient was 230 msec. Premature atrial extrastimuli S1-S2 are delivered during a PCL of 600 msec. Progressively premature extrastimuli only produce slight intra-atrial conduction delays of 20 to 25 msec at coupling intervals just above atrial refractoriness. T, time line. B: Response of intra-atrial conduction to premature stimulation at a basic cycle length (BCL) of 600 msec in a patient with a history of atrial flutter and/or fibrillation. The atrial ERP in this patient was 230 msec. Progressive intra-atrial conduction delay occurs in response to increasing prematurity of extrastimuli. The maximal intra-atrial conduction delay observed to the atrioventricular junction (AVJ) recording site was 60 msec, and the maximal intra-atrial conduction delay observed to the CS recording site was 65 msec at an S1-S2 interval of 240 msec (C). HRA, high-right atrium; T, time line. (From Buxton AE, Waxman HL, Marchlinski FE, et al. Atrial conduction: effects of extrastimuli with and without atrial dysrhythmias. Am J Cardiol 1984;54:755–761, with permission.) |
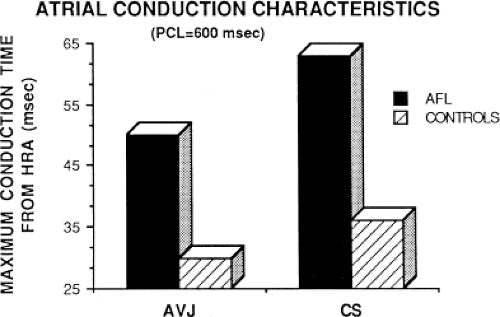 FIGURE 9-6 Comparison of atrial conduction time in response to programmed stimulation from the high-right atrium in patients with and without atrial flutter. The maximum conduction time measured from the HRA in milliseconds to the AVJ and CS are shown in patients with atrial flutter (AFL, dark bar) and in control patients (hashed bar). It is readily apparent that the maximum intra-atrial conduction time from the HRA to the AVJ and to the CS is greater in patients with AFL than in controls. See text for further discussion. PCL, paced cycle length. |
In order to further characterize these delays in more detail, we studied a group of patients using a decapolar catheter to record along the tendon of Todaro, a quadripolar catheter to record in the posterior portion of the triangle of Koch between the os of the CS and the tricuspid annulus, and a decapolar catheter in the CS to record the broader area in the left atrium.10 These studies demonstrated several important findings. First, high-right atrial stimulation was associated with intra-atrial conduction delays at the triangle of Koch and the CS at coupling intervals as much as 60 msec above refractoriness while stimulation of the CS in the same patients produced no such delays. Second, in those patients in whom atrial fibrillation was induced, a greater degree of delay was noted in the triangle of Koch than in those patients in whom no atrial fibrillation was induced. Third, the local electrogram duration in the posterior triangle of Koch was longer in those patients who developed atrial fibrillation in response to atrial stimulation than in those who did not (Fig. 9-7). Of note, in patients without inducible atrial fibrillation, the width of electrograms in the triangle of Koch were similar during both high-right atrial and CS stimulation. These data suggest the prolonged conduction times during high-right atrial stimulation are common to patients with palpitations regardless of whether or not atrial fibrillation is inducible. However, nonuniform anisotropy in the area of the posterior triangle of Koch, and perhaps elsewhere, is quite important since left atrial extrastimuli rarely induce atrial fibrillation or flutter and are rarely associated with intra-atrial conduction delay, particularly in the posterior triangle of Koch (Fig. 9-8). Additional studies using high-density mapping in both atrial chambers would be critical to decide if any particular site of conduction delay is necessary for initiation of atrial fibrillation and/or flutter.
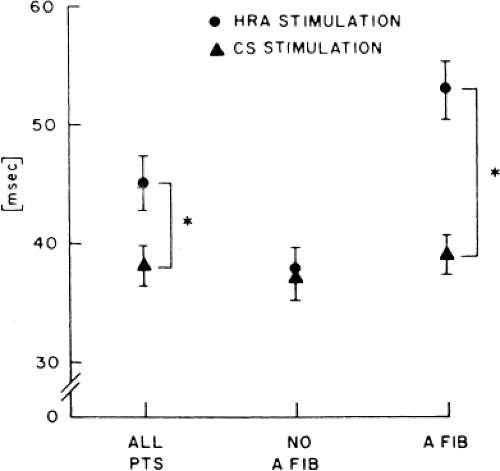 FIGURE 9-7 Effect of atrial stimulation on electrogram width in the posterior triangle of Koch. Response of electrogram width (ordinate) to high-right atrial (HRA) and coronary sinus (CS) stimulation in patients with and without atrial fibrillation are different. HRA stimulation is associated with increased width. CS stimulation is not associated with delay in either group. See text for explanation. (From Papageorgiou P, Zimetbaum P, Monahan K, et al. Electrophysiology of atrial fibrillation. Lessons from patients in sinus rhythm. In: Murgatroyd FD, Camm AJ, eds. Non-pharmacologic management of atrial fibrillation. Armonk, NY: Futura Publishing, 1998:173–184.) |
Another important area of conduction block, which seems requisite to the induction of atrial flutter, is that along the crista terminalis.20,21,22,23 Studies of transverse cristal conduction are best performed using a 20-pole catheter placed along the
crista terminalis with atrial activation rhythm evaluated during pacing at a variety of cycle lengths from the posterior right atrium medial to the crista and the trabeculated right atrium lateral to the crista. Such studies suggest that the crista forms a functional arc of block in most cases. The difference between fixed and functional block is shown in Figure 9-9. During slow pacing from these areas, no split potentials are usually seen; however, during rapid pacing from the low posterior right atrium split potentials with opposite activation sequences are seen.20,21,23 In patients with a history of atrial flutter, transcristal block appears during pacing at longer cycle lengths (mean 638 ± 119 msec) than during pacing in a patient without a history of atrial flutter (214 ± 23 msec).20 The opposite activation sequence reflects activation caudocranially from the posterior to the crista terminalis and craniocaudally lateral to the crista terminalis. The longest cycle length at which transverse cristal block appeared was increased slightly by propranolol and to a greater extent by procainamide.20 A study from Almendral’s group23 demonstrated block in the crista at longer-paced cycle lengths from the posterior wall or CS os than from the lateral wall in patients with typical, counterclockwise, isthmus-dependent flutter. They suggested that this is the reason that counterclockwise flutter is more frequent than clockwise flutter. However, other factors must be involved since counterclockwise flutter is also induced in transplanted hearts in which the crista terminalis cannot play a role.24
crista terminalis with atrial activation rhythm evaluated during pacing at a variety of cycle lengths from the posterior right atrium medial to the crista and the trabeculated right atrium lateral to the crista. Such studies suggest that the crista forms a functional arc of block in most cases. The difference between fixed and functional block is shown in Figure 9-9. During slow pacing from these areas, no split potentials are usually seen; however, during rapid pacing from the low posterior right atrium split potentials with opposite activation sequences are seen.20,21,23 In patients with a history of atrial flutter, transcristal block appears during pacing at longer cycle lengths (mean 638 ± 119 msec) than during pacing in a patient without a history of atrial flutter (214 ± 23 msec).20 The opposite activation sequence reflects activation caudocranially from the posterior to the crista terminalis and craniocaudally lateral to the crista terminalis. The longest cycle length at which transverse cristal block appeared was increased slightly by propranolol and to a greater extent by procainamide.20 A study from Almendral’s group23 demonstrated block in the crista at longer-paced cycle lengths from the posterior wall or CS os than from the lateral wall in patients with typical, counterclockwise, isthmus-dependent flutter. They suggested that this is the reason that counterclockwise flutter is more frequent than clockwise flutter. However, other factors must be involved since counterclockwise flutter is also induced in transplanted hearts in which the crista terminalis cannot play a role.24
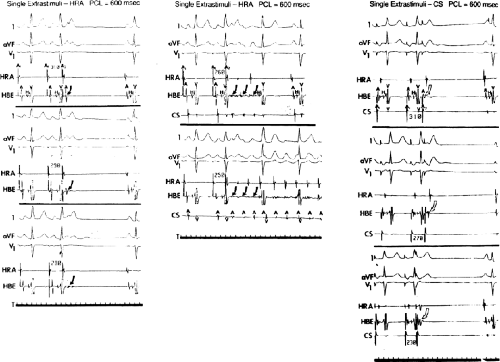 FIGURE 9-8 Influence of anisotropy on initiation of atrial flutter/fibrillation. Three panels are shown with ECG leads 1, aVF, V1 and intracardiac recordings from the high-right atrium (HRA) and His bundle (HBE). Atrial extrastimuli are delivered from the HRA (two left panels) and the coronary sinus (CS) at a paced cycle length of 600 msec. Extrastimuli from the HRA are associated with fragmentation in the HBE at a coupling interval of 280 msec and initiates nonsustained and sustained atrial flutter/fibrillation (AFL/AF) at coupling intervals of 260 and 250 msec, respectively. Stimulation from the CS at comparable coupling intervals neither produces fragmentation of the HBE or initiation of AFL/AF. See text for discussion. |
We have recently evaluated the presence and degree of anisotropy on intra-atrial conduction velocity measured from a high-density (240 poles; 2.2-mm intraelectrode distance) plaque placed perpendicular to the tricuspid annulus. Intra-atrial conduction velocity was measured in 16 radii during pacing from the center of the plaque at 600 msec, the fastest rate of 1:1 conduction (F max), and at a rate just above local atrial refractoriness. We found no differences in the degree of anisotropy in patients with chronic atrial
fibrillation (postcardioversion), patients in whom atrial fibrillation could be induced, and those in whom no atrial fibrillation could be induced. The ratio of fast/slow conduction velocity was 2.1 to 2.3 in the patients during pacing at 600 msec and gradually decreased as the velocity was measured at more rapid-paced rates. This reduction was specifically related to a decrease in conduction velocity parallel to fiber orientation (in the so-called rapidly conducting direction) (Table 9-1). All patients showed significant direction-dependent conduction (anisotropy) with the fastest conduction perpendicular to the A-V groove (Fig. 9-10). The relationship to this pattern of conduction to the activation patterns during atrial fibrillation will be discussed subsequently.
fibrillation (postcardioversion), patients in whom atrial fibrillation could be induced, and those in whom no atrial fibrillation could be induced. The ratio of fast/slow conduction velocity was 2.1 to 2.3 in the patients during pacing at 600 msec and gradually decreased as the velocity was measured at more rapid-paced rates. This reduction was specifically related to a decrease in conduction velocity parallel to fiber orientation (in the so-called rapidly conducting direction) (Table 9-1). All patients showed significant direction-dependent conduction (anisotropy) with the fastest conduction perpendicular to the A-V groove (Fig. 9-10). The relationship to this pattern of conduction to the activation patterns during atrial fibrillation will be discussed subsequently.
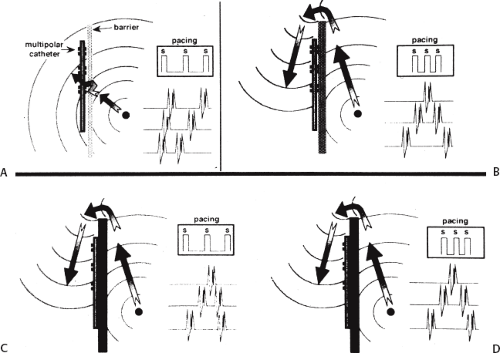 FIGURE 9-9 Fixed versus functional barriers. In the diagrams, pacing is delivered medial to the potential barrier of the crista terminalis. Lateral to the crista is a multipolar catheter. Pacing is delivered at a rate depicted by “S.” A and B depict a functional barrier. In A, slow pacing propagates slowly across the crista, resulting in parallel activation on both sides of the crista. At faster rates (B) functional block occurs and activation proceeds around the block. This gives rise to split potentials with opposite activation sequences on either side of the line of block. C depicts a fixed barrier in which conduction never crosses the crista regardless of the rate of pacing. (From Olgin JE, Kalman JM, Lesh MD. Conduction barriers in human atrial flutter: correlation of electrophysiology and anatomy. J Cardiovasc Electrophysiol 1996;7:1112–1126, with permission.) |
Table 9-1 Intra-atrial Conduction Velocity in Patients With and Without Atrial Fibrillation | |||||||||||||||||||||||||||||||||||||||||||||||||||||||||||||||||||||
|---|---|---|---|---|---|---|---|---|---|---|---|---|---|---|---|---|---|---|---|---|---|---|---|---|---|---|---|---|---|---|---|---|---|---|---|---|---|---|---|---|---|---|---|---|---|---|---|---|---|---|---|---|---|---|---|---|---|---|---|---|---|---|---|---|---|---|---|---|---|
| |||||||||||||||||||||||||||||||||||||||||||||||||||||||||||||||||||||
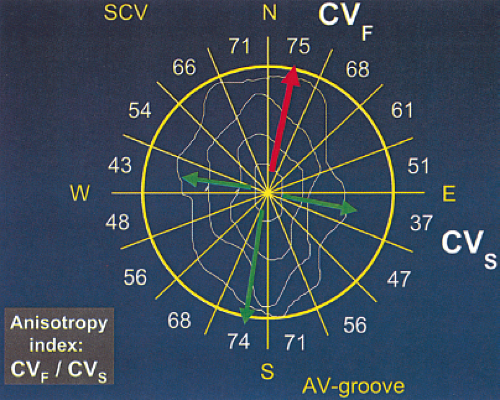 FIGURE 9-10 Anisotropic conduction over the epicardial free wall of the right atrium. An isochronic map and conduction velocities in 16 radii in response to central stimulation from a 240-pole plaque are shown. The plaque is positioned perpendicular to the A-V groove with superior vena cava (SVC) on top. The isochronic map shows an elliptical pattern with rapid conduction perpendicular to the A-V groove and slow conduction parallel to it. The numbers represent conduction velocities (CVS) along each radius. The ratio of fast (CVF) to slow (CVS) conduction, the anisotropy index, is ≈2. These findings suggest the presence of uniform anisotropy. |
Atrial Refractoriness
Changes in atrial refractoriness could and should have a marked influence on development of reentrant arrhythmias. Patients with a history of paroxysmal fibrillation or flutter appear to have different characteristics of refractoriness than in control subjects.8,9,11,12 The right atrial refractory period is shorter in those patients in whom there is a history of paroxysmal atrial fibrillation or flutter than in controls (Fig. 9-11). Similar observations have been noted in patients in whom atrial fibrillation is inducible.10,15 In addition, the high-right atrial refractory periods are shorter than those recorded in the CS at both cycle lengths of 450 and 600 msec (Fig. 9-11) in patients with atrial arrhythmias. Thus, patients with a history of atrial fibrillation or flutter, or those in whom it could be inducible, have not only shorter refractory periods than control subjects, but there is a difference in the refractory periods measured in the right and left atrium via the CS. Of particular note is the fact that while the effective refractory period at both high-right atrial and CS sites were shorter at a basic cycle length of 450 msec than at that determined at 600 msec, the degree to which the ERP shortened was different in those with a history of atrial fibrillation and flutter and those without (Fig. 9-12). In patients with a history of atrial arrhythmias, the effective refractory period of the HRA failed to shorten as much at shorter-paced cycle lengths as controls. In contrast, a decrease in refractoriness during CS stimulation was comparable in both the control and fibrillation/flutter groups. Thus, patients with a history of atrial fibrillation and flutter are characterized by a failure of adaptation of high-right atrial refractoriness when short and long cycle lengths are compared. These findings are similar to patients in whom atrial fibrillation was induced, as described by our group8 and Attuel et al.15 This failure of rate adaptation was noted even though many patients had been in sinus rhythm for days to weeks.
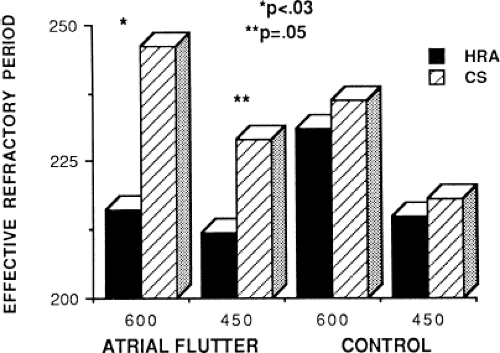 FIGURE 9-11 Comparison of the effective refractory period from the high-right atrium and coronary sinus in patients with and without atrial flutter. The effective refractory period is plotted on the vertical axis in milliseconds. The refractory periods were performed from both the HRA (dark bars) and CS (hashed bars) at paced cycle lengths of 600 and 450 msec in patients with atrial flutter and in controls. The refractory period determined from the HRA was significantly shorter than that from the CS in patients with atrial flutter (216 vs. 246 msec) but not in control subjects. In addition, the effective refractory period at the HRA at a paced cycle length of 600 msec is shorter in patients with atrial flutter than in controls. At a cycle length of 450 msec, the effective refractory period of the HRA was shorter than from the CS in flutter patients (212 vs. 229 msec, p = 0.05). The control group had comparable effective refractory periods at the HRA and CS. See text for further discussion. |
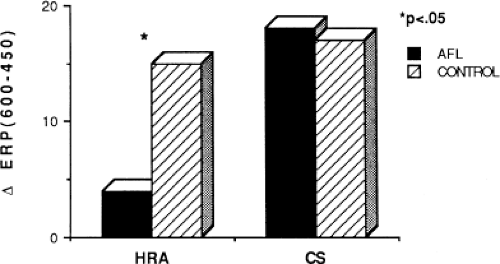 FIGURE 9-12 The effect of cycle length on atrial refractoriness. The difference in effective refractory period ([trio] ERP) at cycle lengths of 600 and 450 msec is shown when stimulation is performed at the HRA and CS in patients with atrial flutter (AFL, dark bar) and in controls (hashed bars). It is apparent that the ERP measured at the HRA fails to shorten in response to a decreased cycle length. This blunting of cycle length responsiveness of HRA refractoriness is characteristic of patients with AFL. See text for further discussion. |
Dispersion of atrial refractoriness has also been noted by Saksena’s group.25 Misier et al.26 also demonstrated a marked dispersion of refractoriness using a different technique than the extrastimulus technique. They looked at the average induced atrial fibrillation interval at 35 to 40 sites in patients with and without paroxysmal atrial fibrillation during open heart surgery. The average fibrillation interval was 152 ± 3 msec measured at 247 sites in patients with atrial fibrillation and 176 ± 8.1 msec at 118 sites measured in control patients. The variance of fibrillation at all recording sites was much larger in patients with a history of atrial fibrillation. The largest difference in atrial fibrillation intervals in adjacent sites was 22 msec in patients with prior atrial fibrillation and 7 msec in patients without a history of atrial fibrillation. The overall variance (difference between longest and shortest intervals) in 4-second snapshots was 31.2 versus 11.5 msec. While this measurement of refractoriness and dispersion refractoriness is much different than that of standard measurements, these investigators showed a linear relationship between the atrial fibrillation intervals and the refractory period determined by the extrastimulus technique at four of the measured sites. However, not surprisingly, the fibrillatory intervals were much shorter than the measured refractory periods determined by the extrastimulus technique. Thus, while the fibrillation interval does not measure the local refractory period, it is an indirect measure of refractoriness. Both methods demonstrate greater heterogeneity in patients with a history of atrial fibrillation.
In the last 15 years there has been active investigation of left atrial and PV electrophysiology. Jais et al.27 found shorter PV ERPs shorter in patients with AF (185 + 71) than control patients (283 + 45) while LA ERPs were similar (253 + 21 in AF vs. 253 + 41 controls). In AF patients the PV ERP was shorter than the LA ERP while in control patients the PV ERP exceeded the LA ERP. The PV ERPs varied from vein to vein and patient to patient although the superior PVs had shorter ERPs. Conduction delays during premature PV stimulation between the PV to the LA, measured on the Lasso, were more frequent and of greater magnitude (102 vs. 42 msec) in patients with AF than controls. These differences parallel the earlier finding in the RA. Transient AF was induced in 22 of 90 (25%) of PV pacing sites in 15 patients but in only 1 of 81 from the LA.
There has been recent interest in the role of remodeling of atrial electrophysiology by atrial fibrillation and its effect upon ease of induction and spontaneous recurrences of atrial fibrillation. This was first studied by Wijffels et al.28,29 who demonstrated in chronically instrumented goats that rapid pacing resulted in shortening of atrial refractory periods which was progressive over time. This was correlated with an increased ease of inducibility and duration of atrial fibrillation. Following short periods of pacing for minutes only, brief episodes of atrial fibrillation could be induced as the refractory period shortened. By 24 hours of pacing, the refractory period had shortened maximally as measured by the standard atrial extrastimulus technique and by the fibrillation interval method described by Misier et al.26 In Wijffels’s study these changes were not affected by autonomic blockade, glibenclamide in doses to block the ATP sensitive potassium current, or atrial pressure. Goette et al.30 found similar results in closed-chest dogs. They found that during short periods of up to 7 hours of atrial pacing at 800 bpm, the effective atrial refractory period shortened despite autonomic blockade, absence of changes in atrial pressure, and pretreatment with glibenclamide. They found that the remodeling was blocked by verapamil and accentuated by hypercalcemia. Intracellular calcium loading during rapid atrial activation is believed to play an important role in remodeling, with subsequent downregulation in L-type calcium channels as well as sodium and (transient outward current) potassium channels.31 This channel remodeling may lead to shortening of the action potential with subsequent shortening of refractory periods as well as conduction slowing.
Others,27,28,32,33 have demonstrated a reduction of tachycardia-induced electrical remodeling by verapamil. Daoud et al.28 demonstrated that Class I antiarrhythmic agents failed to prevent remodeling. While not systematically evaluated, Daoud et al.28 noted persistent inducibility of atrial fibrillation in patients who were treated with saline or procainamide in whom remodeling was still present and diminished inducibility in those patients pretreated with verapamil. Tieleman et al.32,33 on the other hand, systematically studied the effects of verapamil on inducibility. While verapamil blocked the remodeling phenomenon, there was a minimal effect of inducibility of atrial fibrillation by verapamil. Thus, while it is tempting to speculate that rapid pacing as well as atrial fibrillation causes remodeling, which begets atrial fibrillation, remodeling may be merely a secondary phenomenon and not causally related to atrial fibrillation. However, it is certainly true that short refractoriness, particularly with dispersion of refractoriness, associated with the abnormalities of conduction present in patients with atrial fibrillation, can be proarrhythmic. Certainly verapamil is not an effective agent for preventing or terminating atrial fibrillation, while Class I agents, which do not affect remodeling, are most potent in terminating and preventing the atrial fibrillation. This suggests that there are other factors responsible for initiating atrial fibrillation that may include microscopic anatomic derangements, genetic predisposition to atrial fibrillation, variation in size, number, and thickness of pectinate bands in both atria, and the structure and function of the crista terminalis.
Atrial Vulnerability
It has been demonstrated both experimentally and in humans that premature right atrial impulses falling in the RRP of the atria may produce one or more repetitive responses and may even induce atrial flutter or fibrillation.28,29,34,35,36,37,38,39,40,41,42,43,44,45 Potential mechanisms for these observations include (a) the premature impulse triggers delayed afterdepolarizations, which result in one or more repetitive responses due to triggered activity in
the RA, LA, or PVs;46,47,48 (b) the premature impulses initiate one or more reentrant circuits, which lead to repetitive firing, or (c) combinations of the two; that is, repetitive responses lead to triggered beats and/or reentrant circuits which further induce additional areas of impulse formation, reentry, and fibrillatory conduction. Several investigators28,29,36,37,38,39,40,41,42,43,44,45 have demonstrated a relationship between the ability of atrial premature depolarizations (APDs) to initiate atrial fibrillation and/or flutter in isolated tissue preparations or intact experimental animal models (dogs and goats) when dispersion of atrial refractoriness and/or conduction is present. Much of the recent work in remodeling has suggested that dispersion of atrial refractoriness may be more important, although this has not been demonstrated to be causally related to initiation of repetitive responses or sustained atrial fibrillation in humans. The bulk of evidence suggests that most instances of repetitive responses induced by atrial premature impulses are due to reentry. Extensive mapping of more sustained repetitive responses using data, simultaneously collected from several hundred sites, has confirmed that long-lasting repetitive responses are due to reentry.39,40,49 Although the initial reentrant response may be due to an episode of circus movement, it may shift from a slow, single macroreentrant circuit (atrial flutter), or rapid, small circuit, into multiple “daughter” wavelets that characterize atrial activation seen in most cases of atrial fibrillation. The creation of such “daughter” wavelets depends on the initial or subsequent impulses encountering areas of insufficiently recovered tissue, creating secondary reentrant vortices distant from the initial site of reentry. Allessie et al.40,41 using extensive simultaneous multisite mapping to analyze activation times and conduction velocities, have shown that atrial premature complexes that initiate atrial flutter and fibrillation have characteristic wavelengths, with the wavelength for flutter being longer than that for fibrillation.
the RA, LA, or PVs;46,47,48 (b) the premature impulses initiate one or more reentrant circuits, which lead to repetitive firing, or (c) combinations of the two; that is, repetitive responses lead to triggered beats and/or reentrant circuits which further induce additional areas of impulse formation, reentry, and fibrillatory conduction. Several investigators28,29,36,37,38,39,40,41,42,43,44,45 have demonstrated a relationship between the ability of atrial premature depolarizations (APDs) to initiate atrial fibrillation and/or flutter in isolated tissue preparations or intact experimental animal models (dogs and goats) when dispersion of atrial refractoriness and/or conduction is present. Much of the recent work in remodeling has suggested that dispersion of atrial refractoriness may be more important, although this has not been demonstrated to be causally related to initiation of repetitive responses or sustained atrial fibrillation in humans. The bulk of evidence suggests that most instances of repetitive responses induced by atrial premature impulses are due to reentry. Extensive mapping of more sustained repetitive responses using data, simultaneously collected from several hundred sites, has confirmed that long-lasting repetitive responses are due to reentry.39,40,49 Although the initial reentrant response may be due to an episode of circus movement, it may shift from a slow, single macroreentrant circuit (atrial flutter), or rapid, small circuit, into multiple “daughter” wavelets that characterize atrial activation seen in most cases of atrial fibrillation. The creation of such “daughter” wavelets depends on the initial or subsequent impulses encountering areas of insufficiently recovered tissue, creating secondary reentrant vortices distant from the initial site of reentry. Allessie et al.40,41 using extensive simultaneous multisite mapping to analyze activation times and conduction velocities, have shown that atrial premature complexes that initiate atrial flutter and fibrillation have characteristic wavelengths, with the wavelength for flutter being longer than that for fibrillation.
It has also been demonstrated that atrial foci, which are rapidly firing, can lead to atrial fibrillation in patients with paroxysmal atrial fibrillation. In these patients, repetitive PACs or runs of atrial tachycardia from a single focus precede initiation of atrial fibrillation.50,51,52 In such cases, the atrial ectopic activity may be targeted for curative ablation of atrial fibrillation (see Chapter 13). This recent observation has led some people to suggest that the demonstration of induced repetitive atrial responses, particularly when they produce short runs of atrial fibrillation, may be a useful marker of propensity to spontaneous atrial fibrillation. I disagree with this assumption, which is not based on any prospective studies. Haisseguerre51 was the first to show that spontaneous firing of PV foci frequently initiate paroxysmal AF. This suggests that the initial RA repetitive response has little to do with AF itself but may trigger PV firing in patients predisposed to AF. Nevertheless, the ability to perform programmed atrial stimulation allows the investigator to evaluate the nature of repetitive responses to atrial extrastimuli in a controlled fashion and relate that to the presence or absence of spontaneous atrial arrhythmias. It has long been recognized that there is a zone of coupling intervals during which atrial extrastimuli are followed by repetitive responses and that the incidence of such responses increases as the coupling intervals are decreased (Fig. 9-13). Repetitive atrial responses are observed in 10% to 20% of patients undergoing atrial stimulation during sinus rhythm using stimuli that are twice diastolic threshold and 1 to 2 msec in duration. In our experience, repetitive responses will commonly occur when the extrastimuli are delivered in the HRA, particularly in the area at the superior crista terminalis near the sinus node or just inside the right atrial appendage. Occasionally, other atrial sites (e.g., the CS or the low-right atrium) may also result in repetitive firing, even when stimulation of the HRA fails to produce such responses. The data from Jais et al.27 and Haissaguerre et al.51 noted above suggest primary role of the PV in triggering paroxysmal AF. Increasing the amplitude or pulse duration of delivered extrastimuli increases the frequency of repetitive responses regardless of site of stimulation. This results because (a) increasing the current results in the ability to achieve shorter coupling intervals and encroachment on the local RRP that is due to well-known strength–interval relationships and (b) increase in the voltage and duration of the impulse depolarizes local tissue, causing slow conduction and localized reentry at the site of stimulation.
Repetitive atrial responses may have activation sequences that are similar to those produced by the paced stimulus or may have a totally different atrial activation sequence regardless of the site of stimulation. How similar they are may depend on how many simultaneous sites of atrial activation are being recorded and whether or not they trigger atrial extrasystoles from distant sites. Those repetitive responses that originate at or near the site of stimulation are usually associated with conduction delay between the site of stimulation and the local electrogram recorded from the proximal electrodes on a quadripolar catheter (i.e., so-called latency). This can be seen following the atrial extrastimulus in Figure 9-13. Those RA repetitive reponses have little to do with spontaneous AF initiation. Conduction delays at the initiation of repetitive responses occurring distant from the site of stimulation require recording from multiple intra-atrial sites. In such cases, intra-atrial delay (i.e., conduction delay to sites distant from the site of stimulation or at those sites), with or without local delay at the stimulation site, will be present. These local or intra-atrial conduction delays most likely result because the stimulus is delivered during the RRP of the atria. Nonuniform atrial anisotropy, demonstrated by Spach et al.4,5 in experimental models and in patients may also be responsible for the production of such delays in response to premature stimuli. The role of anisotropy in human arrhythmias has also been demonstrated as previously discussed. This may say more about the ability to develop fibrillatory conduction in response to spontaneous PV firing.
In the electrophysiology laboratory, the RRP is usually defined by the longest S1-S2 interval at which latency is observed; that is, the coupling interval of S1-S2 at which the A1-A2 exceeds the S1-S2 interval. An earlier study in our
laboratory30 evaluating atrial strength–interval relationships demonstrated that the RRP, defined by the onset of local intra-atrial conduction delay in response to atrial extrastimuli, was similar to that defined in a more traditional manner; that is, the requirement of increased current above threshold to produce a propagated response as a coupling interval is shortened. Our studies, therefore, suggest that latency, as measured clinically, is related to impingement on the atrial RRP. In patients without a history of atrial fibrillation or flutter, the RRP, as defined by either local latency or intra-atrial conduction delay in response to premature stimuli, occurs over a narrow range, usually within 20 to 30 msec above the atrial effective refractory.53 In patients with atrial flutter and fibrillation the duration of this zone is increased. This may be the factor that makes AF coexist with flutter; flutter can become the initiator of fibrillatory conduction and atrial fibrillation.
laboratory30 evaluating atrial strength–interval relationships demonstrated that the RRP, defined by the onset of local intra-atrial conduction delay in response to atrial extrastimuli, was similar to that defined in a more traditional manner; that is, the requirement of increased current above threshold to produce a propagated response as a coupling interval is shortened. Our studies, therefore, suggest that latency, as measured clinically, is related to impingement on the atrial RRP. In patients without a history of atrial fibrillation or flutter, the RRP, as defined by either local latency or intra-atrial conduction delay in response to premature stimuli, occurs over a narrow range, usually within 20 to 30 msec above the atrial effective refractory.53 In patients with atrial flutter and fibrillation the duration of this zone is increased. This may be the factor that makes AF coexist with flutter; flutter can become the initiator of fibrillatory conduction and atrial fibrillation.
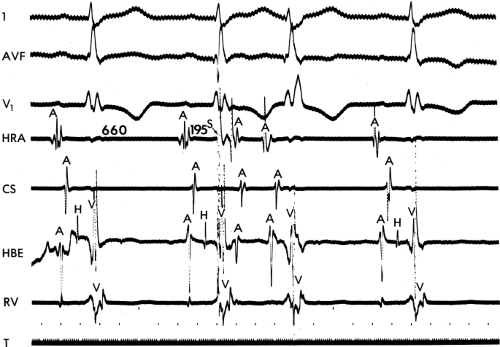 FIGURE 9-13 Repetitive atrial response initiated by a single atrial extrastimulus. From top to bottom: ECG leads 1, aVF, and V1 and electrograms from the high-right atrium (HRA), coronary sinus (CS), area of His bundle recording (HBE), and right ventricle (RV). An atrial extrastimulus (S, arrow) is delivered from the HRA at a coupling interval of 195 msec from the preceding sinus impulse. The stimulus is associated with latency (S-to-A delay) and is followed by an early atrial response. T, time line. |
Repetitive atrial responses to high RA stimuli must be distinguished from sinus node or A-V nodal echoes. By convention, the interval from the stimulated response to the first repetitive response must be less than 250 msec and must be unrelated to the presence of dual A-V nodal pathways or marked A-V nodal conduction delay. In most instances, this is not a difficult distinction to make, particularly if one records multiple atrial electrograms. Of note, when multiple atrial repetitive responses occur, the activation sequence and inter-atrial electrogram intervals may vary, particularly during initial responses.
In our experience, atrial vulnerability, as defined by the ability of single APDs to initiate repetitive atrial responses, is increased when atrial extrastimuli are delivered during pacing (as compared to during sinus rhythm), particularly at short drive cycle lengths (Fig. 9-14). Approximately 30% of patients manifest repetitive atrial responses when atrial extrastimuli are delivered from the HRA at paced cycle lengths of 600 to 450 msec. Similar data have been reported by others.54,55,56 Cosio et al.56 demonstrated that repetitive responses not only were facilitated by pacing, but, as we have shown, were particularly frequent as the basic drive cycle length was decreased (i.e., the paced rate was higher). The repetitive responses initiated during the decreased drive cycle length were associated with a decrease in the ERP. Thus, shorter S1-S2 and A1-A2 intervals were achieved, and intra-atrial conduction delays were observed at these shorter coupling intervals. In their series, repetitive responses occurred in 40% to 50% of patients without a prior history of atrial tachyarrhythmias (many of these patients, however, had structural heart disease).
The mechanism of enhanced vulnerability at short drive cycle lengths could theoretically have several explanations: (a) a cycle length–dependent decrease in the atrial ERP to a greater extent than in the RRP; (b) an actual increase in vulnerability (i.e., a shift in the onset of repetitive firing to longer coupling intervals or the appearance of repetitive responses at similar A1-A2 coupling intervals that previously failed to induce repetitive responses); or (c) the development of triggered activity.
Most data point to reentry and not triggered activity as the mechanism of repetitive responses.36,37,38,39,40
Most data point to reentry and not triggered activity as the mechanism of repetitive responses.36,37,38,39,40
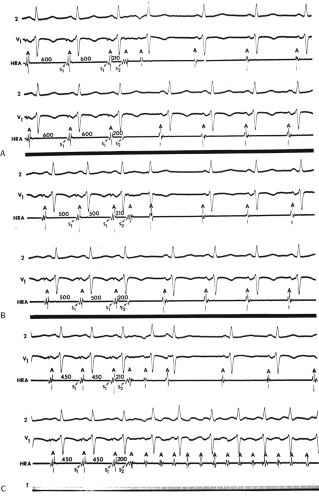 FIGURE 9-14 Effect of cycle length on atrial vulnerability. A: A cycle length of 600 msec, an atrial extrastimulus (S2, arrow) delivered at a coupling interval of 210 msec produces a single repetitive response. When S1-S2 is shortened to 200 msec, atrial refractoriness is reached. At a shorter drive cycle length of 500 msec (B), atrial extrastimuli (S2) delivered at identical coupling intervals (S1-S2 210 and 200 msec) produce a response identical to that shown in A. C: However, when the cycle length is decreased to 450 msec, an S2 delivered at 210 msec produces two repetitive responses. When S1-S2 is shortened to 200 msec, atrial flutter is initiated. See text for further discussion. (From Watson RM, Josephson ME. Atrial flutter. I. Electrophysiologic substrates and modes of initiation and termination. Am J Cardiol 1980;45:732, with permission.) |
Although an actual increase in vulnerability may occur in occasional instances, I believe the most important factor is that short drive cycle lengths decrease the ERP without a significant change in the RRP. Thus, the closer coupling intervals that were achievable would be more likely to encroach on the atrial RRP. This has been convincingly demonstrated in a study from our laboratory in which the strength–interval relationship was studied at multiple drive cycle lengths in 20 patients.53 The drive cycle lengths we evaluated included 600, 450, and 300 msec, a much broader range than studied in any prior investigation. An example of strength–interval curves at these three cycle lengths is shown in Figure 9-15.
As can be seen, the curves are shifted to the left as the cycle length is decreased, such that the ERP (the steep portion of the curve) is decreased. Note, however, that the duration of the RRP—that is, that portion of the curve during which increased current above threshold is required to evoke a propagated response—is similar at each paced cycle length. In our 20 patients, we found no significant difference between the durations of the RRPs at paced cycle lengths of 600, 450, or 300 msec. However, we noted a decrease in the ERPs as the current was increased. The effect of stimulation frequency on the ERP is shown in Table 9-2. However, the threshold increased as the cycle length decreased. Because the ERP at any current strength (threshold, two times threshold, 5 mA, or 10 mA) decreased as the paced cycle length decreased, an increase in threshold is best explained by encroachment on the RRP (which failed to shorten) at the shortest paced drive cycle length. This increase in threshold at the shortest drive cycle length was a consistent and significant finding (p < 0.05) (Fig. 9-16).
As can be seen, the curves are shifted to the left as the cycle length is decreased, such that the ERP (the steep portion of the curve) is decreased. Note, however, that the duration of the RRP—that is, that portion of the curve during which increased current above threshold is required to evoke a propagated response—is similar at each paced cycle length. In our 20 patients, we found no significant difference between the durations of the RRPs at paced cycle lengths of 600, 450, or 300 msec. However, we noted a decrease in the ERPs as the current was increased. The effect of stimulation frequency on the ERP is shown in Table 9-2. However, the threshold increased as the cycle length decreased. Because the ERP at any current strength (threshold, two times threshold, 5 mA, or 10 mA) decreased as the paced cycle length decreased, an increase in threshold is best explained by encroachment on the RRP (which failed to shorten) at the shortest paced drive cycle length. This increase in threshold at the shortest drive cycle length was a consistent and significant finding (p < 0.05) (Fig. 9-16).
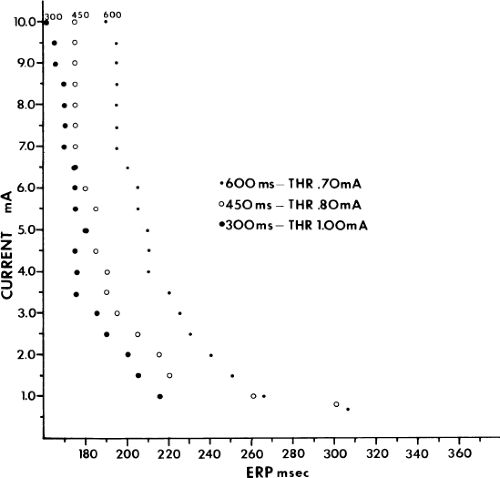 FIGURE 9-15 Atrial strength–interval curves determined in the baseline state. In this patient, the curves at paced cycle lengths of 600 and 450 msec have horizontal portions at long coupling intervals. The curve determined at a paced cycle length of 300 msec lacks this horizontal portion. Note that the threshold (THR) determined at cycle length 300 msec is 0.3 mA higher than that determined at 600 msec, and 0.2 mA higher than that determined at 450 msec. ERP, effective refractory period. |
Table 9-2 Effect of Stimulation Frequency on Effective Refractory Period | |||||||||||||||||||||||||||||
|---|---|---|---|---|---|---|---|---|---|---|---|---|---|---|---|---|---|---|---|---|---|---|---|---|---|---|---|---|---|
| |||||||||||||||||||||||||||||
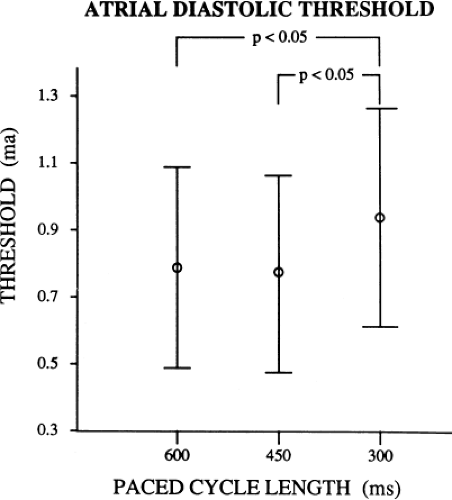 FIGURE 9-16 Relationship of atrial diastolic threshold to paced cycle length. The paced cycle length is displayed on the x-axis and the threshold in milliamps (mA) are shown on the y-axis. The atrial threshold at a paced cycle length of 300 msec is significantly higher than the atrial threshold at paced cycle lengths of 600 and 450 msec, respectively. |
Thus, I believe that the data currently available support the first potential mechanism for facilitation of repetitive responses during pacing: a decreased cycle length produces a decrease in the ERP without changing the RRP, leading to facilitation of premature stimuli encroaching on tissue that is not fully recovered. The partially recovered tissue may be either at the site of stimulation, producing latency, or at more distant sites, producing intra-atrial conduction delays. This conduction delay would be required for intra-atrial reentry. An increase in repetitive responses in response to extrastimuli delivered at a shorter-paced cycle length is not a universal phenomenon. Effects of autonomic tone, myocardial disease, and anisotropy are factors that can potentially influence the site- and rate-dependent effects on the production of repetitive response.
The relationship of local intra-atrial repetitive responses to spontaneous atrial fibrillation and flutter is uncertain. In my opinion, local repetitive responses may serve as additional “extrastimuli” to produce block and slow conduction at critical sites necessary to induce atrial fibrillation based on reentry
or produce triggered activity in the PV which then initiates AF. Where such necessary conduction delays must occur to initiate atrial fibrillation or flutter has been under investigation (see discussion below). While some investigators28,29 use repetitive responses as a surrogate marker for atrial fibrillation inducibility in goats, in humans the relationship of repetitive responses to spontaneous atrial fibrillation has not been shown. At this point in time, repetitive responses and even nonsustained atrial fibrillation induced by programmed stimulation in man should not be considered specific for predicting the clinical occurrence of atrial fibrillation or flutter.
or produce triggered activity in the PV which then initiates AF. Where such necessary conduction delays must occur to initiate atrial fibrillation or flutter has been under investigation (see discussion below). While some investigators28,29 use repetitive responses as a surrogate marker for atrial fibrillation inducibility in goats, in humans the relationship of repetitive responses to spontaneous atrial fibrillation has not been shown. At this point in time, repetitive responses and even nonsustained atrial fibrillation induced by programmed stimulation in man should not be considered specific for predicting the clinical occurrence of atrial fibrillation or flutter.
Atrial Flutter
Tricuspid-caval isthmus-dependent atrial flutter is one of the most unique arrhythmias because of its nearly constant rate of 250 to 300 bpm (in the absence of drugs) regardless of the clinical setting. Other forms of macroreentrant atrial tachycardias are not that well characterized, except for mitral annular flutter that will be discussed in Chapter 14. Most patients with atrial flutter have some form of heart disease, with hypertension, coronary artery disease, and cardiomyopathy most commonly found in the patient population in our laboratory. We have also frequently seen this rhythm in patients with chronic lung disease, atrial septal defects (pre- and postoperatively) and in nearly 5% of patients in whom sodium channel-blocking agents have been administered to treat atrial fibrillation. While the definition of atrial flutter as a supraventricular rhythm with a regular rate between 250 and 300 bpm is generally accepted, there are many classifications of the types of flutter that have evolved as our understanding of this rhythm has improved. In the past, flutter has been defined as either the “typical” or “common” type, which is characterized by a predominantly negative, sawtooth-like atrial activation pattern in the inferior leads with positive atrial deflections in lead V1 and negative deflections in lead V6, or the “uncommon” or “atypical” form characterized by predominantly positive, notched deflections in the inferior leads with negative deflections in V1 and positive deflections in V6 (Fig. 9-17). Atrial activation mapping of these two types of flutter have demonstrated that they represent opposite activation of the same reentrant circuit whose boundaries include the tricuspid annulus, the crista terminalis, the inferior vena cava, Eustachian ridge, CS, and probably the fossa ovalis.10,22,57,58,59,60 Activation during counterclockwise or “typical” flutter proceeds up the septal side of the tricuspid annulus toward the crista terminalis, moves cephalocaudad along the anterolateral wall of the right atrium to reach the lateral annulus, then propagates through the isthmus defined by the inferior vena cava, the CS, and the tricuspid valve. The clockwise (atypical) flutter demonstrates activation in the opposite direction with clockwise activation from the isthmus caudocephalad along the anterior wall, around the crista terminalis and down the septum to reach the isthmus in the clockwise fashion. Documentation of such activation sequences requires use of a multipolar catheter that can be positioned to record nearly 60% of the tricuspid annulus involved in the flutter circuit, a CS catheter, and frequently a catheter using 10 to 20 poles along the crista terminalis (Fig. 9-18).
Although typical electrocardiographic patterns have been described for isthmus-dependent flutter, these ECG characteristics are not always present. We have recently reviewed
156 consecutive cases of isthmus-dependent flutter in which the distal and/or proximal CS activation was recorded along with right atrial activation.61 Counterclockwise flutter (the more common variety) may be characterized by pure negative deflections in the inferior leads, negative followed by positive deflections that are approximately of equal size, or a small negative deflection followed by a positive deflection of greater amplitude. These three varieties coexist with tall positive P waves, smaller positive P waves, or biphasic P waves in V1, respectively. The degree to which positivity in the inferior leads is present appears to be related to the coexistence of heart disease and an enlarged left atrium. It is therefore apparent that propagation of atrial flutter to and through the left atrium is a major determinant of the flutter-wave morphology. This may lead to misleading and confusing interpretations of the electrocardiogram. Counterclockwise flutter can be mistaken for clockwise flutter, which generally has positive deflections in the inferior leads. The major difference is that in counterclockwise, isthmus-dependent flutter there is always a negative deflection that precedes the positive deflection. With clockwise flutter, there is a notching of the positive deflection in the middle of the flutter wave. Thus, despite the fact that isthmus-dependent flutter is a right atrial phenomenon, propagation to and through the left atrium determines its electrocardiographic appearance.
156 consecutive cases of isthmus-dependent flutter in which the distal and/or proximal CS activation was recorded along with right atrial activation.61 Counterclockwise flutter (the more common variety) may be characterized by pure negative deflections in the inferior leads, negative followed by positive deflections that are approximately of equal size, or a small negative deflection followed by a positive deflection of greater amplitude. These three varieties coexist with tall positive P waves, smaller positive P waves, or biphasic P waves in V1, respectively. The degree to which positivity in the inferior leads is present appears to be related to the coexistence of heart disease and an enlarged left atrium. It is therefore apparent that propagation of atrial flutter to and through the left atrium is a major determinant of the flutter-wave morphology. This may lead to misleading and confusing interpretations of the electrocardiogram. Counterclockwise flutter can be mistaken for clockwise flutter, which generally has positive deflections in the inferior leads. The major difference is that in counterclockwise, isthmus-dependent flutter there is always a negative deflection that precedes the positive deflection. With clockwise flutter, there is a notching of the positive deflection in the middle of the flutter wave. Thus, despite the fact that isthmus-dependent flutter is a right atrial phenomenon, propagation to and through the left atrium determines its electrocardiographic appearance.
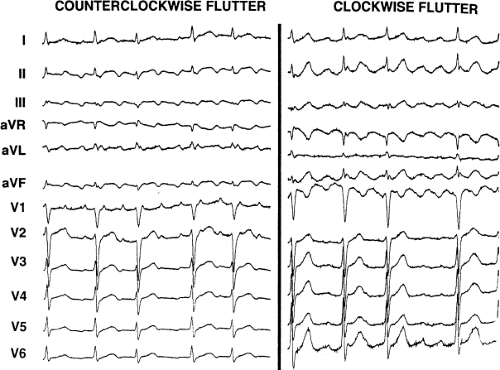 FIGURE 9-17 Electrocardiographic characteristics of counterclockwise and clockwise isthmus-dependent flutter. Typical ECG patterns of isthmus-dependent flutters are shown. See text for description. (From Olgin JE, Miles W. Ablation of atrial tachycardias. In: Singer I, Barold SS, Camm AJ, eds. Non-pharmacologic therapy of arrhythmias in the 21st century. Armonk, NY: Futura Publishing, 1998:197–217, with permission.) |
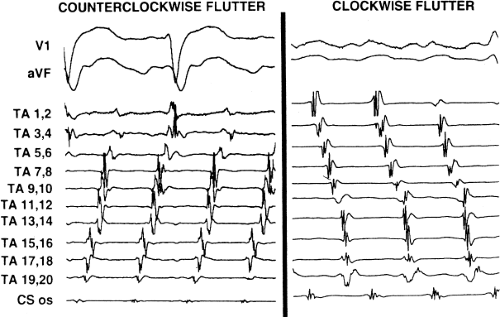 FIGURE 9-18 Endocardial activation during counterclockwise and clockwise flutter. Activation during counterclockwise (left) and clockwise (right) flutter are shown with surface ECG leads V1 and aVF. Electrograms are recorded around the tricuspid annulus (TA) using a 20-pole halo catheter with pole 1, 2 positioned at the isthmus and from the os of the coronary sinus (CS). Activation around the TA is counterclockwise on the left and clockwise on the right. See text for details. (From Olgin JE, Miles W. Ablation of atrial tachycardias. In: Singer I, Barold SS, Camm AJ, eds. Non-pharmacologic therapy of arrhythmias in the 21st century. Armonk, NY: Futura Publishing, 1998:197–217, with permission.) |
The exact sites involved in and critical to the flutter circuit can be determined using activation mapping and programmed stimulation (see page 300).22,57,58,59 It is not uncommon that both clockwise and counterclockwise flutters are seen in the same patient and often have similar rates. Of importance is the fact that the surface ECG can be misleading, particularly if only the standard leads are used.62 For example, as shown in Figure 9-19, the standard leads suggest typical counterclockwise flutter. Intracardiac recordings in the same patient demonstrate a change in the sequence of atrial activation in many areas, a finding more characteristic of atrial fibrillation or multiple reentrant atrial circuits. Atypical ECG patterns suggest atypical varieties of flutter or “organized” atrial fibrillation. Atrial tachycardias can arise from the left atrium, particularly from the PVs, and mimic atrial flutter. However, since their location is usually in the superior PVs, the P-wave morphology will be positive in the inferior leads, but would also be positive in V1 and V2 due to the posterior-anterior activation of the heart. Obviously, atrial mapping during the tachycardia is necessary to prove this. In a similar fashion, atypical morphologies may be seen when flutter arises at an atriotomy scar site postoperatively or around a repaired atrial septal defect. Thus, appropriate interpretation of the surface ECG can suggest specific types of atrial flutter. The role of programmed stimulation and activation mapping of atrial tachyarrhythmias to define their mechanism and critical sites requisite for their perpetuation will be discussed below.
Induction of Atrial Flutter
In our experience, isthmus-dependent, counterclockwise (“typical” or “common”) atrial flutter can be reliably induced by programmed stimulation in the vast majority of patients with a history of this arrhythmia. Reproducible initiation of counterclockwise flutter is possible in more than 95% of patients if a protocol including introduction of up to two extrastimuli at multiple drive cycle lengths (600 to 300 msec), at multiple atrial sites, and rapid pacing to 180 msec is completed. Those patients with clockwise, isthmus-dependent flutter also have a high likelihood of inducibility. Both counterclockwise and clockwise flutter may exhibit site-specific induction. In our experience, counterclockwise flutter is more readily inducible from the HRA, (the trabeculated lateral free wall of the right atrium or in the right atrial appendage) than induction from the CS when single and double extrastimuli
are used.8 This is in contrast to Olgin et al.63 who suggested that stimulation at the posterior septal smooth right atrium is more likely to initiate counterclockwise flutter, and that stimulation at the trabeculated free wall of the right atrium, lateral to the crista terminalis, is more likely to induce clockwise flutter. The reason for the discrepancy of these results is unclear, but in both cases the site of block appears to be in the isthmus between the CS, inferior vena cava, and the tricuspid valve.63,64,65 One explanation for the discrepancies may be that Olgin et al.63 did not evaluate the CS as a site of induction, and they excluded all patients in whom atrial flutter evolved after going through an early period of fractionation of electrograms in the triangle of Koch (A-V junction or os of the CS) or transient atrial fibrillation (Fig. 9-20). The reason for this early fractionation and period of what appears to be atrial fibrillation or impure atrial flutter may be the instability prior to formation of a line of block along the tendon of Todero and/or the Eustachian ridge. Such irregularity is extremely common in our experience8,6 and that of Waldo and colleagues 66,67
are used.8 This is in contrast to Olgin et al.63 who suggested that stimulation at the posterior septal smooth right atrium is more likely to initiate counterclockwise flutter, and that stimulation at the trabeculated free wall of the right atrium, lateral to the crista terminalis, is more likely to induce clockwise flutter. The reason for the discrepancy of these results is unclear, but in both cases the site of block appears to be in the isthmus between the CS, inferior vena cava, and the tricuspid valve.63,64,65 One explanation for the discrepancies may be that Olgin et al.63 did not evaluate the CS as a site of induction, and they excluded all patients in whom atrial flutter evolved after going through an early period of fractionation of electrograms in the triangle of Koch (A-V junction or os of the CS) or transient atrial fibrillation (Fig. 9-20). The reason for this early fractionation and period of what appears to be atrial fibrillation or impure atrial flutter may be the instability prior to formation of a line of block along the tendon of Todero and/or the Eustachian ridge. Such irregularity is extremely common in our experience8,6 and that of Waldo and colleagues 66,67
Stay updated, free articles. Join our Telegram channel

Full access? Get Clinical Tree


