where LV-EDD represents LV end-diastolic dimension and LV-ESD represents LV end-systolic dimension (Fig. 7.1). Normal values for SF range from 28 to 38 % [1]. Values <28 % suggest reduced systolic function while values >38 % suggest hyperdynamic function. The short-axis view at the papillary muscle level is most frequently used to measure SF. SF assesses radial ventricular function in the LV basal part.
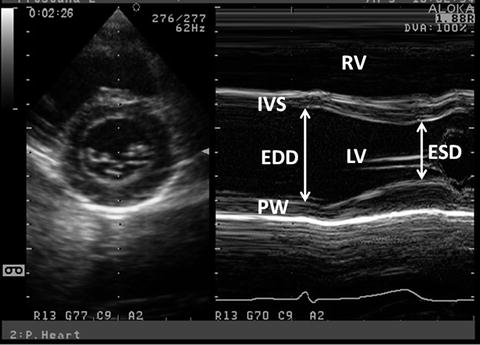
Fig. 7.1
M-mode LV-SF measurement. M-mode measurement is obtained from the parasternal short-axis view at the level of LV papillary muscles. ED and ES measurements are obtained and FS and EF are calculated. PW posterior wall
SF has limitations that should be taken into account when used in the clinical settings. SF assumes that there are no regional wall motion abnormalities. Hypokinesis or dyskinesis of the interventricular septum (IVS) occurs in the presence of right ventricular (RV) volume overload that is seen in significant atrial septal defect. This causes paradoxical septal motion that the basal IVS moves away from the inferolateral wall during systole. Septal hypokinesis and dyskinesis also occur after open heart surgery. SF is also influenced by preload and afterload. For instance, it increases in mitral and aortic regurgitation while it decreases in immediate postoperative significant patent ductus arteriosus. Therefore, SF does not directly reflect intrinsic myocardial function. In addition, hypertrophic myocardium causes overestimation of systolic function in using FS.
7.1.1.1.2 Ejection Fraction
The most popular expression of global LV function is ejection fraction (EF). EF is a measure of the ratio of stroke volume to end-diastolic volume with each contraction. Although EF is influenced by loading conditions as well as SF, it is confirmed as a predictor of outcome in various cardiac diseases and is used to select therapeutic strategy [2, 3]. EF may be determined by semiquantitative 2-dimensional echocardiographic (2DE) LV images. Such visual assessment is fairly reliable when performed by experienced interpreters and sonographers; however, it can cause considerable interobserver variation [4]. Therefore, we should quantify EF by volumetric measurements. EF is computed from M-mode, 2DE and 3-dimensional echocardiograms (3DE). M-mode recording of 2DE measurements of LV dimensions from mid-ventricular papillary muscle level is used to calculate the EF as follows (Fig. 7.1):

EF is preferably calculated from 2DE or 3DE volume measurements. The disk summation or biplane Simpson method is often used. The LV endocardial border is traced using one apical or two orthogonal apical views to create multiple cylinders whose volume is summated to provide LV volume. The trabeculations and papillary muscles are included as a part of LV cavity. Another crucial technical point for reliably measuring LV volume is avoiding foreshortening of apical views. The long-axis dimensions from two apical views should be similar. The biplane Simpson method is preferable for measuring LV volume with regional wall motion abnormalities. Normal EF values range between 54 and 75 % [1]. The smaller the LV, the larger is the effect of the measurement error. This is particularly important in the borderline LV in patients with aortic stenosis where calculations of LV volume have a possibility of determining a biventricular vs. univentricular treatment. Real-time 3DE is more reliable and accurate for measuring LV volume and this is in course of the standard mode of measuring LV volume and EF.
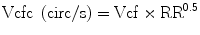
7.1.1.1.3 Velocity of Circumferential Fiber Shortening and the Stress-Velocity Index
The ratio of LV fiber shortening is noninvasively assessed by M-mode echocardiography. This measurement is termed mean velocity of circumferential fiber shortening (Vcf). It is normalized for LV-EDD and is obtained from the following equation:
 where ET represents ejection time. Reported normal values for mean Vcf are 1.5 ± 0.04 circumferences (circ)/s for neonates and 1.3 ± 0.03 circ/s for children between 2 and 10 years of age [5, 6]. Vcf assesses not only the SF degree but the rate at which this shortening occurs. To normalize Vcf for variation in heart rate, LV-ET is divided by the square root of the RR interval to derive a rate-corrected mean Vcf (Vcfc, circ/s):
 Normal Vcfc is reported to be 1.28 ± 0.22 and 1.08 ± 0.14 circ/s in neonates and children, respectively [7]. Because Vcfc values are corrected for heart rate, a significant decrease in Vcfc between neonates and children is attributed to increased systemic afterload with advancing age. Vcf is sensitive to the changes in contractility and afterload. In contrast, Vcfc is relatively insensitive to the changes in preload. Similar to SF, Vcf relies on the elliptical LV shape and is invalid with altered LV geometry. For this reason, it is not suitable for some form of congenital heart disease.
FS, EF, and Vcf are dependent on the LV loading state. When Vcfc is corrected for afterload, it becomes a good parameter of contractility. An assumption has been made to calculate “wall stress” based on the Laplace formula where wall stress in a passive tube is related to pressure and size and is inversely related to wall thickness [8]. Namely, higher LV pressure and larger LV size increase wall stress while thicker wall decreases it. Wall stress is derived from M-mode echocardiographic measurements, blood pressure measurements, and carotid pulse tracing. End-systolic wall stress (ESWS) is the most important parameter determining systolic shortening [9]. The formula to calculate ESWS is:
 where 1.35 is the conversion factor from mmHg to g/cm2, Pes is the end-systolic pressure derived from linear interpolation of the dicrotic notch on the pulse tracing, and hes is the LV end-systolic wall thickness. ESWS differentiates states of increased LV afterload from decreased LV contractility. A simplified formula includes mean or peak systolic pressure instead of end-systolic pressure derived from pulse tracing [7].
Abnormal LV contractility is defined as values for Vcfc-ESWS relation falling below the normal expected range. In younger children, the linearity of the relationship has been questioned. A study on the growth-related changes in the stress-velocity index from preterm infants to pupils demonstrated that the slopes and y-intercepts of the regression lines of Vcfc-ESWS relation are significantly steeper and greater in preterm infants and neonates compared with those in older children [10]. The clinical application of stress-velocity index is somewhat limited by its difficult acquisition and its time-consuming off-line analysis.
7.1.1.1.4 The Rate of Systolic Ventricular Pressure Increase (dP/dt)
Because SF, EF, and Vcfc are based on calculations of geometrical dimensions, their use in congenital heart disease is partially limited. As an alternative to geometrical measurements, Doppler echocardiography is used in the quantitative evaluation of LV systolic function. If significant mitral regurgitation is present, the peak and mean rate of the change in LV systolic pressure (dP/dt) can be derived from the continuous wave regurgitant Doppler signal. This rate of the change of LV pressure is determined during the isovolumic phase of the cardiac cycle before aortic valve opens. By the simplified Bernoulli equation, two velocity points along the regurgitant Doppler envelope are selected from that and corresponding LV pressure change is derived [11]. This change in LV pressure is then divided by the change in the time between the two Doppler velocities to derive LV dP/dt (Fig. 7.2). Practically, dt is calculated between 1 and 3 m/s: dP between those two points is 32 mmHg. dP/dt is subsequently calculated by the following formula:
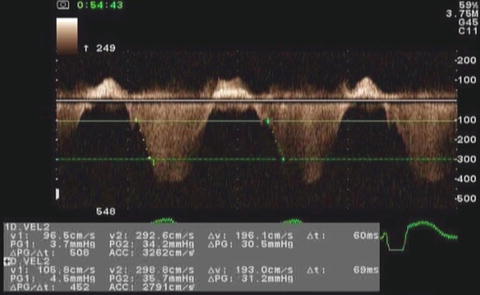

Fig. 7.2
Measurement of dP/dt. This image demonstrates Doppler velocity curve of mitral regurgitation jet in a child with single LV and severe LV dysfunction
Normal value for mean dP/dt is reported to be >1,200 mmHg/s. Peak dP/dt correlates accurately with invasive measurements [12]. To ascertain peak LV dP/dt noninvasively, mitral regurgitant signal is digitized to obtain the first derivative of the pressure gradient curve from that of peak positive and peak negative dP/dt. The same calculation is applied to the RV (sect. “dP/dt”) and the univentricular heart. While dP/dt is reflective of myocardial contractility, it is substantially affected by changes in preload and partially afterload because it is measured before aortic valve opening.
7.1.1.1.5 Myocardial Performance Index
Myocardial performance index (MPI, Tei index) is a Doppler-derived quantitative measure of global ventricular function that comprises both systolic and diastolic time intervals [13]. MPI is defined as the sum of isovolumic contraction time (ICT) and isovolumic relaxation time (IRT) divided by ejection time (ET) (Fig. 7.3):
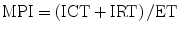
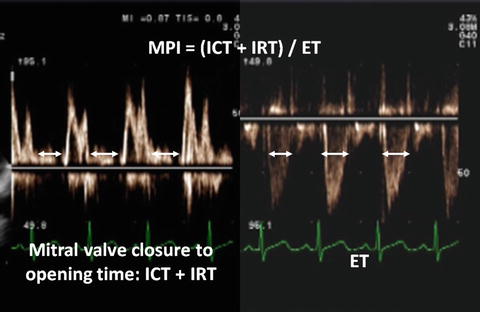
Fig. 7.3
MPI. The mitral closure to opening time is measured on the mitral inflow pattern as shown in the left part of the picture. LV-ET is measured on the aortic outflow as shown in the right part of the picture
The components of MPI are routinely measured from pulsed-wave Doppler signals at the atrioventricular valve and ventricular outflow tract of not only the LV but the RV. To derive the sum of ICT and IRT, ET is subscribed from the Doppler interval between cessation and beginning of the mitral valve inflow signal. Increasing MPI values correlate with increasing degrees of global ventricular dysfunction. Systolic dysfunction results in a prolongation of IRT and a shortening of ET. Both systolic and diastolic dysfunctions result in abnormality in myocardial relaxation which prolongs IRT.
Both adult and pediatric studies established normal values for MPI. In adults, normal LV-MPI value is 0.39 ± 0.05 [13]. In pediatric population, similar value for the LV is reported to be 0.35 ± 0.03 [14]. MPI is shown to be a sensitive predictor of outcome of adult and pediatric population with heart disease as well as fetuses [15–18]. Because MPI comprises measures of both systolic and diastolic components, it is more sensitively an early measure of ventricular dysfunction in the absence of other obvious changes in isolated systolic or diastolic indices by echocardiography. In addition, because MPI is derived from Doppler, it is easily applied to the assessment of ventricular function even in complex ventricular geometries of congenital heart disease [14, 19, 20]. MPI determined by tissue Doppler imaging (TDI) is also a useful mean assessing global ventricular function. The modified index has the advantage of simultaneous recording of systolic and diastolic velocity patterns [21]. MPI has limitations like other indices. It is significantly affected by changes in loading conditions and has a paradoxical change with high filling pressure or severe aortic valve dysfunction [22]. Finally, the combined nature of MPI fails to promptly distinguish between systolic and diastolic ventricular dysfunction.
7.1.1.1.6 Tissue Doppler Imaging
TDI is presently added to the methods used in the clinical cardiology. TDI is less load dependent than corresponding Doppler velocities of blood flow and has both systolic and diastolic components (Fig. 7.4) [23]. Measurement of myocardial wall velocities by TDI is useful for the assessment of longitudinal systolic performance. Relationship between pulsed-wave tissue velocities in healthy children is reported by age group [24]. The systolic velocities of the mitral annulus correlate well with LV-EF [25]. It is shown that the systolic velocity is a good predictor of clinical outcome [26]. Significant decrease in mitral annular systolic TDI velocities is demonstrated in adult patients with LV dysfunction and elevated LV filling pressure [27]. Tissue velocities are rather geometry independent. This has important implications in applying TDI velocities to congenital heart disease in which there is a large variety of ventricular geometry. In dilated cardiomyopathy, systolic tissue velocities are reduced in various segments [28, 29]. This is consistent with reduced and heterogeneous systolic ventricular dysfunction in this disorder. In aortic valve stenosis, systolic basal velocities are reduced in the septum and lateral wall [30]. Systolic dyssynchrony is assessed by measuring the precise timing of peak systolic velocity in the ejection phase with reference to the beginning of the QRS complex [31].
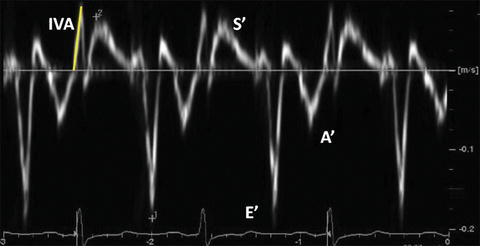
Fig. 7.4
Typical longitudinal TDI tracing obtained in the basal IVS from the apical 4-chamber view. Peak systolic velocity (S′), peak early diastolic velocity (E′), and peak late diastolic velocity (A′) are measured. IVA is measured from the baseline to the peak and is indicated as the yellow solid line
During the ICT, another short-lived peak can be recorded. Myocardial acceleration during ICT (IVA) is an index of ventricular contractility. IVA is calculated as average rate of myocardial acceleration during the ICT (Fig. 7.4). As the ICT is short, high temporal resolution images are better for the IVA calculation. IVA is validated as an index of LV and RV contractility that is unaffected by preload and afterload within physiologic changes [32]. It is noted that IVA may be dependent on preload when LV regional dysfunction exists [33]. IVA is reported to have heart rate dependency [32].
TDI cannot differentiate between active contraction and passive motion, which is a limitation in assessment of regional myocardial function [34]. Similar to other Doppler modalities, TDI velocities are angle dependent. In addition, tissue velocities also measure cardiac translation; therefore, motion and velocity of a myocardial segment are influenced not only by its own contraction but by adjacent myocardial tethering. Therefore, regional myocardial dysfunction by TDI is difficult to identify when localized myocardial disease exists [35].
7.1.1.1.7 Strain Rate Imaging
Regional strain rate (SR) corresponds to the rate of regional myocardial deformation and is calculated from the spatial gradient in myocardial velocity between two points within the myocardium. Regional strain represents the amount of deformation or the fractional change in length and is calculated by integrating SR curve during the cardiac cycle (Fig. 7.5).
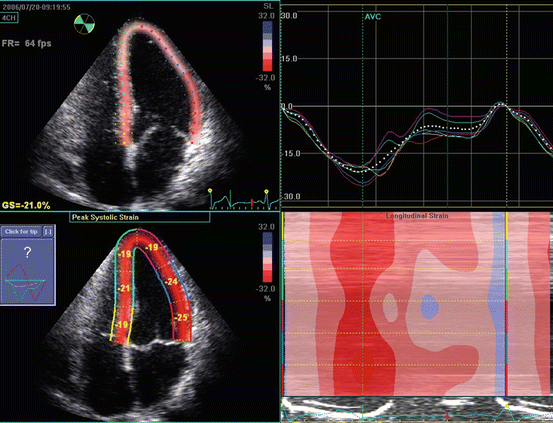
Fig. 7.5
Longitudinal LV strain in a normal subject. The picture represents the strain curves obtained from the apical 4-chamber view
Strain measures the total amount of deformation in the radial, longitudinal, and circumferential directions while SR calculates the velocity of shortening and is expressed as second−1 [36]. During systole, deformation is thickening in the radial direction and shortening in the longitudinal direction. During diastole, deformation is thinning in the radial direction and lengthening in the longitudinal direction. Shortening is characterized by negative strain and SR while lengthening is characterized by positive strain and SR.
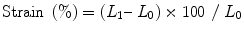 where L 0 is the original length and L 1 is the final length.
 where V a –V b is the instantaneous velocity difference at points a and b and d is the distance between the two points.
These two measurements reflect different aspects of myocardial function and provide important information. In contrast to TDI velocities, strain and SR are not influenced by cardiac translation, rotation, or tethering of adjacent segments and, therefore, are regarded as better indices of regional myocardial function. In the normal heart, longitudinal strain rate values are similar from the base to the apex unlike tissue velocity which is higher at the base than at the apex [37]. A reference database of strain and SR has been obtained from healthy children [38].
Strain and SR are shown to be reduced in patients with dilated and ischemic cardiomyopathy [39]. In patients with regional myocardial ischemia or bundle branch block, heterogeneous contraction pattern is present [34, 40]. Therefore, it is important to compare local measurements to global measurement for analyzing regional wall motion. In this situation, myocardial thickening or shortening, i.e., postsystolic shortening, occurs after aortic valve closure [41]. Timing of aortic and mitral valve closure is important to recognize presence of postsystolic shortening. In patients with hypertrophic cardiomyopathy, there is severely reduced strain and a substantial postsystolic shortening in the basal septum [42]. In less hypertrophied regions, strain is higher and there is very little postsystolic shortening [43]. It is demonstrated that values of strain and SR are influenced by heart rate [44]. It is shown that reference values for normal 2DE strain have a difference among different vendors [45].
7.1.1.1.8 Three-Dimensional Echocardiography
The limited accuracy of M-mode and 2DE is attributed to the need for geometric assumption which the LV is ellipsoid. The missing information on dimensions is considered the main source of the wide inter-measurement variability of the echocardiographic estimates of LV size and function. This is particularly fitted to congenital heart disease of which ventricles have distorted morphology and do not follow geometric assumption. A special advantage of 3DE over 2DE is providing full-volume datasets that overcome the need for geometric assumption of ventricles (Fig. 7.6). Several studies comparing 3DE with magnetic resonance imaging as a gold standard have shown the quantification of LV volumes and function is feasible, accurate, and reproducible in both children with morphologically normal ventricles and those with abnormal geometry [46, 47].
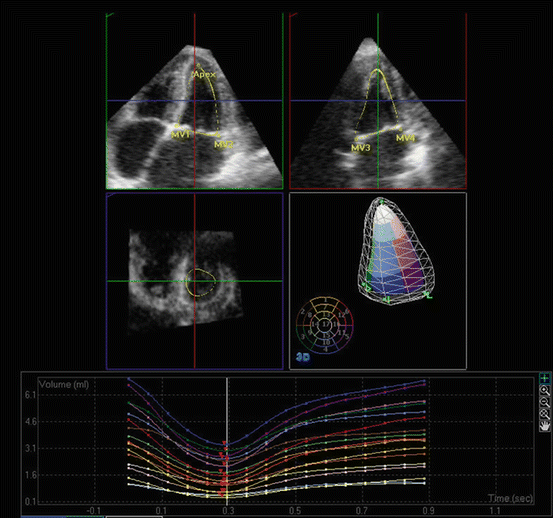
Fig. 7.6
3DE assessment of LV volumes. 3DE and semiautomated analysis of 3D volumes are used to measure LV volumetric changes throughout the cardiac cycle. The images represent an apical 4-chamber (left upper) and an apical 3-chamber (right upper) cut through the LV volume. The planes through the volumes are illustrated in a left middle panel. On right middle and lower panels, the result of volumetric analysis and the volume time curve are shown, respectively. MV mitral valve
Visualization of the endocardial surface is challenging especially in the apical and lateral myocardial segments. This is commonly compensated for by tilting a transducer in 2DE. This maneuver generally improves endocardial visualization at the expense of rendering foreshortened LV views. Finally, it results in an additional source of error in calculating LV volumes by 2DE. In this regard, 3DE has an additional advantage of image plane positioning that results in more accurate chamber quantification.
As a large number of patients have coronary artery disease in adults, the assessment of regional wall motion is frequently evaluated. Volumetric 3DE imaging makes it possible to obtain complete dynamic information on all myocardial segments from a single dataset. 3DE during stress is feasible and useful for detection of stress-induced wall motion abnormalities [48].
7.1.1.2 Diastolic Ventricular Function
7.1.1.2.1 Mitral Inflow Velocity Wave
Mitral inflow obtained by pulsed-wave Doppler echocardiography represents the diastolic pressure gradient between the left atrium (LA) and LV. The early diastolic filling (E) wave represents the peak LA-to-LV pressure gradient at the onset of diastole. The deceleration time of the mitral E wave reflects the time period needed for equalization of LA and LV pressure. The late diastolic filling (A) wave represents the peak pressure gradient between the LA and the LV in late diastole at the onset of atrial contraction. Normal mitral inflow is characterized by a dominant E wave, a smaller A wave, and a ratio of E-to-A waves between 1 and 3 (Fig. 7.7). The normal E/A velocity ratio in children >2 years of age is 2.3 ± 0.6 and A wave duration is 140 ± 21 ms. Mitral inflow Doppler velocities are affected not only by changes in LV diastolic function but by additional hemodynamic factors, including age, altered loading conditions, heart rate, and changes in LA and LV compliance.
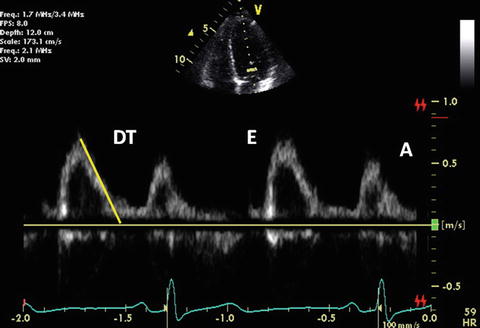
Fig. 7.7
Normal mitral inflow Doppler
The diastolic filling pattern is characterized by measuring the time interval from the peak of E velocity to its extrapolation to baseline that is called deceleration time (DT). Normal duration of mitral DT varies with age. Its reference value is reported in both pediatric and adult populations [49, 50]. In relaxation abnormality, DT is prolonged because it takes longer for LA and LV pressures to balance with a slower decrease in LV pressure until mid-to-late diastole. DT is shortened if there is rapid filling due to active LV relaxation and elastic recoil as seen in normal young subjects. DT is also shortened if there is a decrease in LV compliance or marked increase in LA pressure. Nomograms for deceleration time vs. heart rate are already reported [51]. IRT generally parallels DT. IRT dividing by the square root of the cardiac cycle length indentifies a corrected IRT of 63 ± 7 in children [52].
The duration of mitral inflow A wave is useful for estimating LV end-diastolic pressure because it is shortened with a higher filling pressure [53]. In patients with impaired relaxation and mild-to-moderate increase in filling pressures, the mitral inflow pattern resembles a normal filling pattern because of the opposing effects of myocardial relaxation and increased filling pressures. Therefore, normalized filling pattern due to moderate diastolic dysfunction is termed “pseudonormalization.”
In neonates and fetuses, reversed E and A waves as well as TDI early and late diastolic waves are produced due to myocardial immaturity. Prolonged IRT is also noted. The maturation from fetus to childhood pattern generally occurs by 3 months of age [54].
7.1.1.2.2 Pulmonary Venous Flow Velocity Wave
Pulmonary venous (PV) Doppler provides an assessment of LA and LV filling pressure. PV flow consists of four Doppler waves: 1 or 2 systolic waves (S waves), a diastolic wave (D wave), and a reversal wave with atrial contraction (Ar wave). In normal adolescents and adults, the characteristic pattern of PV flow consists of a dominant S wave, a smaller D wave, and an Ar wave of low velocity and short duration (Fig. 7.8). In neonates and younger children, a dominant D wave is often present with a similar low-velocity and short duration Ar velocity or absent [55]. The A wave velocity is 21 ± 5 cm/s with duration of 130 ± 20 ms [56]. The normal S/D wave ratio in children from 3 to 17 years of age is 0.8 ± 0.2.
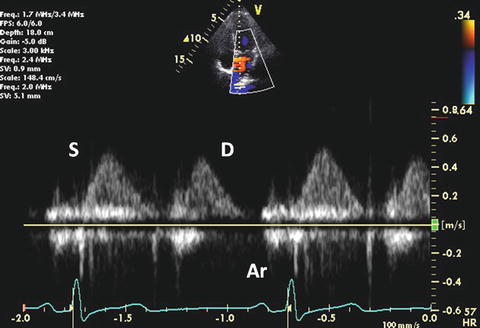
Fig. 7.8
Normal PV flow Doppler
First S wave is related to atrial relaxation, which decreases LA pressure and promotes PV flow into the LA. Second S wave is produced by the increase in PV pressure. At normal LA pressure, the late systolic increase in PV pressure is larger and is more rapid than LA pressure. However, at elevated filling pressures, an increase in the late systolic pressure is equal to or more rapid than that in the PV, resulting in earlier peak of second S wave velocity [57]. S waves are closely connected and a distinct first component is not identified in 70 % of patients.
With worsening LV diastolic function, LA pressure increases and it leads to a decreased S wave with a relatively increased D wave. In this situation, both velocity and duration of Ar wave are importantly increased [51, 58]. An Ar wave duration >30 ms as well as longer than the corresponding mitral A wave duration or a ratio of Ar wave-to-mitral A wave duration >1.2 is predictive of elevated LV filling pressure [59]. D wave velocity correlates with mitral E velocity because the LA functions mainly as a conduit for flow during early diastole.
7.1.1.2.3 Mitral Inflow Velocity Wave Combined With PV Flow Velocity Wave
In determining diastolic dysfunction, abnormal relaxation and restrictive filling are recognized as typical patterns. In the Doppler manifestations of diastolic dysfunction, patterns of ventricular filling gradually change: normal diastolic function, abnormal relaxation, and restrictive filling.
Abnormal relaxation is considered as grade I diastolic dysfunction. This is the initial abnormality seen in most forms of heart disease and ventricular compliance usually remains normal. Abnormal relaxation is common in myocardial hypertrophy. Mitral E wave velocity is reduced and mitral A wave becomes dominant (the E/A ratio <1). Impaired relaxation results in prolongation of IRT and mitral DT. PV-D wave velocity decreases in parallel with mitral E wave. A mild increase in PV-S wave is also observed. PV-Ar wave usually remains within normal limits at this stage (Fig. 7.9).
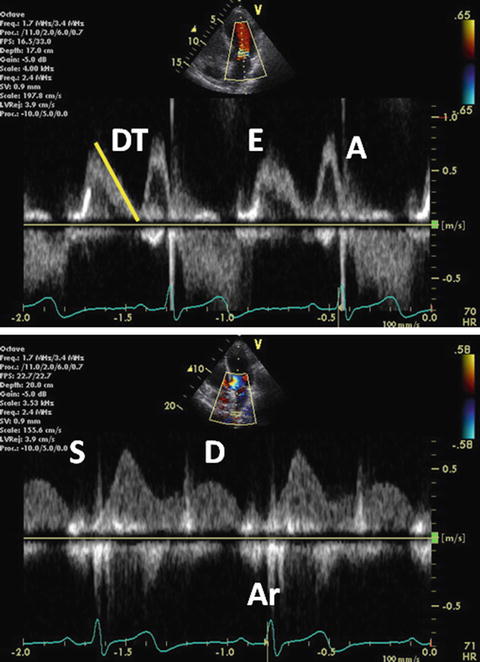
Fig. 7.9
Grade I diastolic dysfunction. Pulsed-wave mitral inflow Doppler demonstrating abnormal relaxation pattern with the E/A ratio <1 (upper). Pulsed-wave PV flow Doppler (lower)
As diastolic dysfunction advances, mitral E wave velocity increases. This is primarily due to increasing LA pressure that is caused by reduced ventricular compliance. Elevated LA pressure increases the transmitral flow gradient in early diastole and subsequently restores a mitral inflow pattern with a normal E/A ratio, leading to pseudonormalization. This is grade II diastolic dysfunction and is distinguished from truly normal filling in 1 of 2 ways. First, grade II dysfunction demonstrates an abnormally large and long Ar wave (Fig. 7.10). Ar duration is usually 30 ms longer than A wave duration. This is commonly associated with moderate diastolic impairment, mildly to moderately elevated LA pressure, and rising LV diastolic pressure.
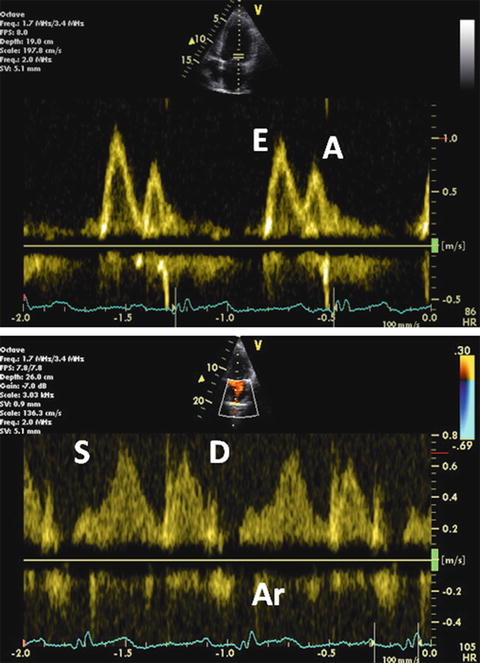
Fig. 7.10
Grade II diastolic dysfunction. Mitral inflow Doppler demonstrating pseudonormalized pattern (upper). Pulsed-wave PV flow Doppler (lower)
Valsalva maneuver is useful in a situation of poor or confusing flow signals. In the setting of grade II dysfunction, E wave velocity decreases, A wave velocity increases, and DT lengthens during the maneuver. This maneuver decreases preload and subsequently unmasks the underlying relaxation abnormality. In contrast, normal relaxation displays symmetrical reduction in E and A wave velocities and DT does not change after the maneuver. In the pediatric population, the difference between Ar wave duration and A wave duration also identifies those with elevated LV filling pressure only when the LV end-diastolic pressure >18 mmHg [51].
The most advanced stage of diastolic pattern is restrictive filling. In markedly reduced LV compliance, flow signals display a high velocity as well as short duration E wave, rapid DT, and little ventricular filling with atrial contraction. Mitral inflow typically features the E/A ratio >2 and DT <150 ms [60]. S wave velocity is decreased due to increased atrial pressure. E and D wave velocities are increased due to elevated venous and atrial pressure. At this stage, Ar wave is quite prominent as far as sinus rhythm is maintained and the LA contracts normal (Fig. 7.11). The Ar duration is >30 ms longer than the A wave duration [59]. This is grade III-to-IV diastolic dysfunction. Only this stage means an irreversible change in ventricular function.
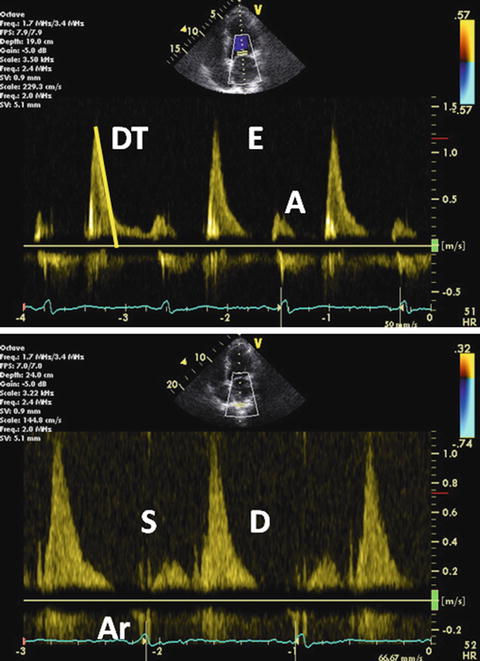
Fig. 7.11
Grade III-to-IV diastolic dysfunction. Pulsed-wave mitral inflow Doppler demonstrating restrictive filling pattern with increased E wave velocity, decreased A wave velocity, and the E/A ratio >2 (upper). Pulsed-wave PV flow Doppler demonstrating decreased S wave velocity and prolonged Ar wave duration
7.1.1.2.4 TDI
TDI velocities are shown to be clinically helpful in the distinction between normal and pseudonormal transmitral Doppler filling patterns. In addition to changes obtained by loading conditions, alterations in LA pressure and LV end-diastolic pressure also affect mitral E wave velocity. However, the corresponding TDI velocity is characteristically decreased in pseudonormal filling and allows differentiation of abnormal filling pattern from normal transmitral Doppler inflow. A ratio of E wave velocity to lateral mitral annular early diastolic velocity (mitral E/E′) is reported as a noninvasive measure of LV filling pressure. Nagueh et al. demonstrated a significant correlation of mitral E/E′ with invasively measured mean pulmonary capillary wedge pressure [23]. Subsequent studies validated the ratio and reported its applicability in a variety of hemodynamic settings [61–63]. The ratio of E′ velocity to flow propagation velocity correlates closely with invasive LV end-diastolic pressure. Septal E′ velocity correlates with the time constant of relaxation (tau) [64].
Early diastolic velocity of the mitral annulus measured with TDI is a good indicator of LV myocardial relaxation [65]. This is one of the most important components of myocardial diastolic function as well as LV compliance and filling pressure. TDI records the velocity of the longitudinal motion. In the normal myocardial relaxation, E′ velocity of the mitral annulus increases with an increasing transmitral gradient, increasing preload, exercise, and dobutamine infusion [66, 67]. However, in case of impaired myocardial relaxation, E′ velocity is affected less or even unchanged by transmitral gradient or preload [65, 66]. Therefore, a decrease in E′ velocity is one of the earliest markers for diastolic dysfunction. A decrease in E′ velocity is present in all stages of diastolic dysfunction [65]. Usually, E′ velocity from the lateral annulus is higher than that from the septal annulus (Fig. 7.12).
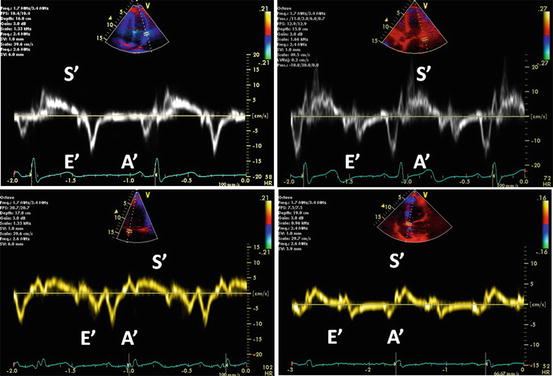
Fig. 7.12
Grading of diastolic function based on mitral annulus velocity. The images represent a normal diastolic function (left upper), grade I (right upper), II (left lower), and III-to-IV diastolic dysfunction (right lower). Decreased E′ wave velocity of the mitral annulus is shown in all stages of diastolic function
Late diastolic velocity of the mitral annulus at the time of atrial contraction increases during early diastolic dysfunction, as is the case for the mitral inflow A wave. In contrast, it decreases as atrial function deteriorates. Late diastolic velocity of the mitral annulus is correlated with LA function [68, 69].
In adult patients with reduced LV function, mitral inflow velocity alone is usually sufficient to estimate filling pressures. A mitral inflow E/A ratio >1.5 and deceleration time <140 ms indicate increased filling pressures. In adult patients with LV-EF > 40 %, the E/E′ ratio is the best parameter to estimate filling pressure. The E/E′ ratio increases as pulmonary capillary wedge pressure increases. Pulmonary capillary wedge pressure is demonstrated to be >20 mmHg when the E/E′ ratio is >10 using the lateral annulus velocity or >15 using the septal annulus velocity [23, 70]. The E/E′ ratio works well even in patients with fused mitral inflow signals and those with atrial fibrillation [62, 71]. The only exception is patients with constrictive pericarditis because E′ velocity is increased and the E/E′ ratio is reduced with high filling pressures [72]. In contrast, restrictive cardiomyopathy has decreased early diastolic and systolic TDI velocities [73].
In efficient myocardial relaxation which sucks blood from the LA to the LV during early diastole, the time of onset of mitral inflow E concurs with that of mitral annulus E′ wave. However, in delayed myocardial relaxation and increased filling pressure, onset of E wave depends more on the increased LA pressure and occurs earlier than the onset of mitral annulus E′ wave. Therefore, the time interval between the onset of mitral E wave and that of mitral annulus E′ wave increases, and this increased interval is proposed as a variable to assess LV filling pressure [74, 75]. A limitation of measuring cardiac time intervals by pulsed-wave Doppler echocardiography is non-simultaneity because different cardiac cycles are needed to measure various intervals. One solution is to have the capability of obtaining multiple pulsed-wave recordings simultaneously. Another means to measure cardiac intervals from a single cardiac cycle is to use color M-mode from the anterior mitral leaflet [69].
A number of studies are performed in pediatric population to establish normal reference values of TDI velocities [24, 51, 76, 77]. Similar to previous reports for adults, pediatric TDI velocities vary with age, heart rate, ventricular wall and location, and LV dimension as well as mass [65]. The E/E′ ratio is highest in neonates and decreases with advancing age, primary due to an increased E′ velocity over this period [24]. In infants and children, TDI velocities did not significantly correlate with LV-SF, LV and RV MPIs, and transmitral inflow Doppler [78]. This lack of correlation is likely that pulsed-wave TDI assesses longitudinal ventricular function while other methods assess radial and global measures of ventricular function. In patients with ventricular septal defect, the E/E′ ratio correlates with invasively measured LV end-diastolic pressure [79].
Stay updated, free articles. Join our Telegram channel

Full access? Get Clinical Tree


