Fig. 5.1
Pressure-volume counterclockwise loop during one cardiac cycle. See the text for details
In systole, left ventricular (LV) pressure first increases straight up to Point B without changing LV volume because the mitral and aortic valves are closed during the isovolumic contraction . When the LV pressure exceeds the aortic pressure, the aortic valve opens and blood begins ejecting from the LV to the aorta. During this ejection phase (between Points B and C), LV volume decreases and the pressure-volume curve is convex upward. The movement of blood from the LV to the aorta ceases when the aortic valve closes (Point C; upper left-hand corner of the LV pressure-volume loop) after the LV pressure decreases to less than the aortic pressure. The LV pressure then decreases without a change in LV volume (isovolumic relaxation: Point C to D). When the LV pressure decreases to the level of the left atrial (LA) pressure (Point D), the mitral valve opens (MVO), LV filling starts, and the LV volume begins to increase. Figure 5.2 shows the relationship between LV and LA pressures and LV filling [3]. LV relaxation persists after the MVO; thus, the LV pressure continues to decrease despite increased LV volume. After the LV pressure reaches its minimum (Fig. 5.1, Point E), LV pressure and volume increase to the end of diastole, when the filling by atrial contractions ceases (Point A).
Fig. 5.2
Relationship between pressures in the left ventricle (LV), left atrium (LA), and filling. LV and LA pressure and the LV volume rate (dv/dt) were obtained in conscious chronically instrumented dogs. The dv/dt shows LV filling and LV ejection in each phase. See the text for details. Reprinted with permission from Masutani et al. [3]
The pressure-volume loop of one cardiac cycle provides useful and important hemodynamic information. The x-axis of Points C and D represents the end-systolic volume, while the x-axis of Points A and B represents the end-diastolic volume. The x-axis distance between lines AB and CD represents the stroke volume (SV), while the SV/end-diastolic volume (EDV) represents the ejection fraction (EF).
The slope of the thick-dashed line in Fig. 5.1 represents the effective arterial elastance (Ea) [4], which indicates the relationship between the SV and the Pes. Ea is an integrated measure of LV afterload [5, 6]. The slope of the line between Points E and A, which is calculated by dividing the change in the pressure from the time of minimal LV pressure to the end-diastolic pressure by the change in the volume during this period, is defined as the LV chamber stiffness and greatly affects ventricular filling [7, 8]. The area surrounded by one cardiac pressure-volume loop shows stroke work (or external work) during one cardiac cycle. The dimension of stroke work is that of energy (force times length) because it is equal to the product of pressure (force/area) and volume (volume).
In summary, one single pressure-volume loop provides six kinds of pressure, two kinds of volume, stroke volume, ejection fraction, stroke work, and Ea.
5.3 Noninvasive Estimation of a Single Pressure-Volume Loop
According to the basal knowledge described in the previous section on what a single pressure-volume loop involves, the opposite directional thinking enables noninvasive estimation of a single pressure-volume loop (Fig. 5.3). We can use echocardiographic measurements to determine the LV end-systolic and end-diastolic volumes as well as the relative position of the pressure-volume loop on the x-axis. Among the six kinds of pressure provided in Fig. 5.1, sphingomanometric pressure measurements provide systolic (top of slope between Points B and C), mean (approximately y-axis of Point C), and diastolic blood pressure (y-axis of point B). Pes approximately equals mean blood pressure. Doppler and tissue Doppler echocardiographic measurements of E/e′ provide information about whether end-diastolic pressure is elevated, although validation studies in children were limited. Other two pressures, namely LV minimal pressure and LV pressure on the MVO opening, cannot be determined noninvasively. Finally, with such information taken together, the pressure-volume loop was noninvasively constructed (Fig. 5.3). Although the inferior portion of the loop cannot be accurately estimated, such pressure-volume loops shown in Fig. 5.3 provide useful assessments about loading conditions, functions, and those interactions in daily bedside practice.
Fig. 5.3
Noninvasive estimation of a single pressure-volume loop. See the text for details
5.4 Multiple Loops Obtained by Changing Loads
The single-loop pressure-volume curve and the elements of the cardiac cycle are well understood using a time-varying elastance model [9] in which the elastance of the ventricle changes with time during the cardiac cycle. This model is analogous to the elastic energy stored in a stretched spring; mechanical energy must be increased within the time-varying elastance when the elastance increases within the ventricular wall according to the following equation:
 where V 0 is almost equal to the volume axis intercept of the Pes-volume relationship (ESPVR). The increasing slope of the ESPVR and, hence, the increasing elastance during systole are analogous to a thickening spring within the ventricular wall (Fig. 5.4) [9]. At the end of systole, the elastance generally reaches its maximum (E max) [9]. Although E max is an important ventricular property, it is somewhat difficult to use in the clinical setting. The slope of ESPVR of multiple loops is called Ees, which is obtained independent of a timing of maximum elastance and is more clinically useful. Thus, Ees and ESPVR rather than E max will be detailed in the following section as a relatively load-insensitive measure of contractility.
Fig. 5.4
The increasing elastance during systole is symbolized by a thickening spring within the ventricular wall (time-varying elastance model). Reprinted with permission from Suga et al. [9]
It is difficult to gain load-insensitive measures of contractility or ventricular stiffness using a single pressure-volume loop. To obtain those values, variably loaded multiple pressure-volume loops are needed, which can be obtained by preload or afterload modification. Figures 5.5 (experimental dog) [10] and 5.6a [11] are examples of such multiple pressure-volume or area loops, respectively, that are obtained by inferior vena cava (IVC) occlusion. As shown in Fig. 5.3a, the trajectory of Points C and A in Fig. 5.1 represents the ESPVR and the end-diastolic pressure-volume relationship (EDPVR), respectively. Ees is defined as the slope of the ESPVR. ESPVR position and slope provide load-insensitive measures of contractility. As shown in Figs. 5.5 and 5.6, increasing contractility induced by inotropes causes the ESPVR position to shift upward and to the left and the Ees to increase. In contrast, decreasing contractility causes the ESPVR position to shift lower and to the right and the Ees to decrease. Increased ventricular diastolic stiffening causes a steep EDPVR in the physiologically working range regardless of right or left position.
Fig. 5.5
Representative pressure-volume relationships during inferior vena cava occlusion before and after the use of the calcium sensitizer levosimendan (LS), an inodilator, in a conscious instrumented heart failure dog. Volume measurements were performed by ultrasonic crystals. After inodilator administration, end-diastolic volume was decreased and end-systolic volume was further decreased. Thus, stroke volume was increased. The end-systolic pressure-volume relationship was shifted to the upper left area and its slope was increased
Fig. 5.6
Pressure-area relationships during vena cava occlusion before and after dobutamine and contractility assessment. Similar to the pressure-volume relationship [19], the end-systolic pressure-area relationship, stroke work-end-diastolic area relationship, and dp/dt max-end-diastolic area relationships are linear, and their slopes increase with dobutamine. Reprinted with permission from Senzaki et al. [11]
With respect to ESPVR nonlinearity, the Ees may differ between preload and afterload manipulations [12]. More importantly, it cannot be overemphasized that an understanding of the entire pressure-volume relationship is preferable to knowing just a single Ees value [12].
To change the afterload, drugs such as phenylephrine [13] have been sometimes used in clinical settings. In light of ease, safety, quick recovery to the original state, and repeatability, drug-induced modulations have significant disadvantages over transient IVC occlusion . Transient IVC occlusion seems to be the most easily repeatable and, thus, suitable way to change load in clinical settings. In contrast to the use of drugs to change load, IVC occlusion does not take a long time (usually about 5 s of inflation time) and balloon deflation can be quickly completed. During the simultaneous measurement of LV pressure and volume/area of catheterization, transient IVC occlusion can be safely performed in both adults [14] and children [11, 15].
Newly developed balloon catheters for IVC occlusion with a reasonable size (5–7 Fr) for use in all pediatric and adult patients [11, 15] have contributed to the safety and easy applicability of this procedure (Fig. 5.7). A balloon catheter is usually introduced from the femoral vein through an appropriately sized sheath and advanced into the right atrium under fluoroscopic guidance. The balloon is inflated with CO2 gas in the right atrium and then withdrawn toward the IVC, thus obstructing venous inflow [15]. Blood pressure recovers quickly enough after the procedure.
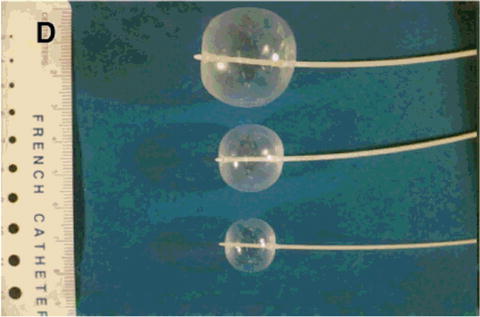
Fig. 5.7
Occlusion balloon catheter that can be inserted in a regular sheath for pediatric catheterization (5–7 Fr). Reprinted with permission from Senzaki et al. [15]
5.5 Pressure and Volume Measurement Methodology
For accurate pressure-volume analyses, LV pressure is preferably measured by a micromanometer due to the considerable limitations in pressure waveforms obtained by heparinized saline-filled catheters that are connected to the transducers (Fig. 5.8). For pediatric catheterization, pressure transducers mounted on a 0.014-F guidewire (RADI Medical Systems AB, Uppsala, Sweden), which can be placed in a 3- to 5-F pigtail catheter, are useful for obtaining accurate measurements of LV pressure [11]. Measurement by a pressure guidewire provides more accurate waveform information without false fluctuations that may result in inaccurate analysis in Ees, relaxation, and stiffness (Fig. 5.8).
Fig. 5.8
Comparison of pressure measurements using a pressure guidewire and a saline-filled catheter. (a) Analog recordings of the left ventricular pressure waveform using a pressure guidewire (orange) and a saline-filled catheter (black). The waveform by saline-filled catheter (black) had unphysiological fluctuations. (b) The pressure-area relationship during inferior vena cava occlusion by pressure measurements using a saline-filled catheter (left panel) and a pressure guidewire (right panel) demonstrating the usefulness of pressure measurements using a pressure guidewire
On the other hand, obtaining accurate and continuous LV volume measurements has been challenging. Although volumetry by cineangiograms has been used to construct human pressure-volume loops, it takes huge amounts of time to measure the LV volume by determining the border of the LV cavity frame by frame. Moreover, the frame rate on cineangiograms is too low to enable precise pressure-volume analyses. If the frame rate were increased, the radiation exposure would be increased as well. The development of a conductance catheter has overcome these issues and enabled a relatively feasible way to continuously monitor LV volume [14] with simultaneous measurements of LV pressure. This is currently one of the most frequently used tools for pressure-volume data acquisition in adult clinical settings. However, in small children, conductance catheters cannot be used due to catheter size limitations. Moreover, based on the measurement principle and its geometric assumption of the conductance catheter, it should be difficult to accurately measure ventricular volume in patients with large ventricular septal defects or a single right ventricle.
Because of such difficulties in continuous volume recordings in children, LV areas have sometimes been used in clinical settings to generate pressure-area loops. Although caution should be exercised, pressure-area relationships (Fig. 5.5) [11] provide essentially the same physiological evaluations as pressure-volume relationships in the physiological range as previously validated. Pressure-area relationships, which can be less invasively applied to small children, elucidate the complicated hemodynamics in complex congenital heart disease. This continuous measurement of ventricular area may overcome the aforementioned limitations of conductance catheter measurement in children. Although volume measurement on magnetic resonance imaging (MRI) is the best methodology since it does not depend on geometrical assumptions, pressure-volume analyses employing MRI [16, 17] are currently under development and await further progress.
5.6 Assessment of Systolic Function
Indices of systolic function or ventricular contraction that can be derived from the pressure-volume loop during one cardiac cycle, such as EF and dp/dt max, are load-dependent indices and, thus, are not purely intrinsic systolic functions. In contrast, three indices of the Ees , M SW (the slope of stroke work [SW] to end-diastolic volume), the slope of dp/dt max, and end-diastolic volume relationships [18], are highly load-independent; hence, they are useful for assessing ventricular function independent of loading condition [18]. These three relationships in pressure-volume correlations are linear in physiological ranges as well as the increases in slope in response to increased contractility by dobutamine [19]. Similarly, as shown in Fig. 5.6, these three relationships have also been obtained in pressure-area relationships in children [11]. Among these three relationships, the strong points of M SW are that its dimensions consist of mmHg in pressure-volume, pressure-area, or pressure-dimension relationships and that adjustment by body size is unnecessary in contrast to the other two indices, which require body size correction. Among these three indices, M SW is the most stable but the least sensitive to changes in inotropic states, whereas the slope of dp/dt max and the end-diastolic volume relationship are the most sensitive but most variable measures of the contractile state [19]. Among these, Ees has advantages over the other two indices in that it can be used to assess ventricular-arterial coupling, which is directly related to heart energy, and predict systemic pressure/stroke volume responses to afterload or preload reduction therapy [12, 20, 21]. This issue will be described in the next section.
5.7 Assessment of Ventricular-Arterial Coupling
The LV pumps blood into the artery, which then delivers it to the tissues. To effectively achieve this, the relationship between the ventricular and arterial system, or ventricular-arterial coupling, is an important determinant. This ventricular-arterial coupling is quantified by the ratio between ventricular and arterial elastance expressed as Ea/Ees (or Ees/Ea). Given the preload, which is defined as end-diastolic volume (Fig. 5.1), the SV and the Pes result from the balance between Ees (describing the ventricle) and Ea (describing the arterial system) [1].
The SW is the external work of the heart during one cardiac cycle (represented by the shadowed area in Figs. 5.1 and 5.9). The pressure-volume area (PVA) is defined as the area circumscribed by the ESPVR, EDPVR, and systolic segment of the pressure-volume trajectory (Fig. 5.9). The area under the ESPVR and to the left of the SW area is the potential energy (PE) and is expressed according to this equation:
Fig. 5.9
Concept of pressure-volume area (PVA). (a) PVA in schematic presentation and (b) PVA in a real pressure-area relationship. The potential energy (PE) is defined as the area under the end-systolic pressure-volume relationship (ESPVR), above the end-diastolic pressure-volume relationship (EDPVR), and to the left of the pressure-volume loop. PVA is the sum of PE and stroke work (SW) or external work (EW)
PVA represents the total mechanical energy that is produced by the LV. The efficiency of the conversion of mechanical energy to external work of the heart is calculated as SW/PVA [22]. The mechanical efficiency (SW/MVO2) of the LV can be expressed as the product of the ratio of PVA to MVO2 (the conversion of metabolic energy to mechanical energy) and the ratio of SW to PVA (the conversion of mechanical energy to external work) as follows [23]:
 where SW is approximated by SV × Pes. The efficiency of SW/PVA and ventricular-arterial coupling is a tight relationship expressed as follows:
This equation shows that the efficiency of the conversion of mechanical energy to external work of the heart is approximately determined by ventricular-arterial coupling and explains its importance.
Suga et al. clarified the close relationship between the metabolic energy of the heart (MVO2) and PVA [9], which established the integrated concept of heart energy in pressure-volume analyses based upon the following time-varying elastance model:
 where a × PVA corresponds to the PVA-dependent VO2 and b corresponds to the PVA-independent VO2. Because b changes with Ees, b can be written as the sum of c × Ees + d. The variable a indicates the O2 cost of PVA, c indicates the O2 cost of Ees, and d indicates basal metabolism [9]. Thus, PVA is a measure of the total mechanical energy that is generated by each ventricular contraction. This PVA concept is an important extension of the Ees concept.
The left ventricle and arterial system are optimally coupled to produce SW when Ea/Ees = 1.0. When Ees exceeds Ea (Ea/Ees < 1.0), SW remains nearly optimal, but when Ea exceeds Ees (Ea/Ees > 1.0), SW falls and the LV becomes less efficient [24]. In normal subjects, the LV and arterial system are optimally coupled both at rest and during exercise [22, 25]. In contrast, in patients with systolic heart failure, Ees is reduced and peripheral vascular resistance and Ea are increased, as the LV and arterial system are suboptimally coupled (Ea/Ees > 1.0). Because Ea is approximately equal to the peripheral vascular resistance times the heart rate, any increase in heart rate will further increase Ea, making the coupling even worse [26, 27].
5.8 Assessment of Diastolic Function
Diastole consists of isovolumic relaxation and filling. Thus, diastolic function is assessed in two phases.
5.8.1 Isovolumic Relaxation
Early diastolic (from end systole to MVO; Fig. 5.1, Points C to D) function is relaxation: how fast the LV can relax and the LV pressure can decrease. Early diastolic function can be assessed by the time constants of relaxation. The LV pressure of this phase is approximately fitted to a monoexponential curve. Thus, relaxation can be assessed by the time constant (τ) of the monoexponential curve with a zero asymptote and a nonzero asymptote [28]. To better fit the LV pressure, the logistic fit has been developed to obtain an accurate and robust fit [29–31]. If LV relaxation is severely impaired, it may develop a characteristic change in the diastolic pressure-volume relationship [32]. However, it seems difficult to precisely evaluate an abnormality in relaxation from an actual pressure-volume curve.
5.8.2 Filling
Late diastole (from MVO to end-diastole; Fig. 5.1, Points D and A) is the filling duration. The late diastolic function of LV consists of how the LV can easily receive blood from the left atrium. Such an ability is represented by compliance (ΔV/ΔP). Stiffness (ΔP/ΔV), the reciprocal of compliance, indicates how much pressure is needed to increase the unit volume. The slope of the line between Points E and A in Fig. 5.1, which is calculated by dividing the change in the pressure from the time of minimal LV pressure to end-diastolic pressure by the change in the volume during this period, is defined as LV chamber stiffness [7, 8]. LV chamber stiffness can be noninvasively assessed by the deceleration time of early mitral inflow velocity (E wave) in echocardiography, which seems more useful in cases of restrictive physiology with increased left atrial pressure. LV chamber stiffness may have a greater impact on LV filling than the absolute position of the EDPVR curve [33]. However, caution should be exercised since chamber stiffness is preload dependent; that is, chamber stiffness increases with greater preload. In hypertrophic cardiomyopathy, there may be a large disparity between flat pressure-volume relationships during filling and steep end-diastolic relationships [34].
EDPVR position and slopes indicate the LV stiffness, which can be obtained by multiplying loaded pressure-volume loops by IVC occlusion as curvilinear trajectories (Fig. 5.9) of the end-diastolic point (Fig. 5.1, Point A). The EDPVR is shallow in a compliant LV and steep in a stiff LV. Quantification of EDPVR is obtained by fitting to the exponential curve to calculate the stiffness constant (β) [35, 36]. Increased ventricular stiffening causes steep EDPVR values in physiologically working ranges regardless of right or left position.
Diastolic LV-right ventricular interaction (ventricular interaction) [37] is an important factor of LV diastolic pressure-volume relationships because the LV and right ventricle exist in the cavity in the pericardium and share both the intraventricular septum and the outside layer of muscle (Fig. 5.10a). A substantial proportion of the up and down positions of the diastolic pressure-volume relationship (Fig. 5.10b) stems from forces that are extrinsic to the LV rather than from intrinsic diastolic stiffness in the LV itself. This is called pericardial (or external) constraint [37, 38], and right-heart filling is one major factor of it. When the resting diastolic pressure was >6 mmHg, almost 38 % of the pressure was due to external factors [37]. Thus, in patients with high LV end-diastolic pressure, unloading of the right ventricle would decrease LV diastolic pressure and improve LV filling.