Fig. 6.1
Schema of the three-element windkessel model
During cardiac catheterization, simultaneous measurements of blood flow and pressure can be obtained by using a manometer-mounted pressure-flow wire in vivo, and both waveforms are resolvable to a large number of sine curves, whose frequencies are the products of the integral multiplication of the basic frequencies (see equations below). Importantly, all of the resolved waves are prime and independent of each other.
 where Pn and Fn are the pressure and flow amplitude of the nth harmonic, respectively; fn = n*HR/60 (frequency of the nth harmonic); θn, ρn = pressure and flow phase angle of the nth harmonic.

The quotient of the pressure waveform divided by the flow waveform gives the dimension of resistance (Zn) and is expressed as the amplitude of each term. The phase angles are calculated by subtracting the aortic pressure and flow components.


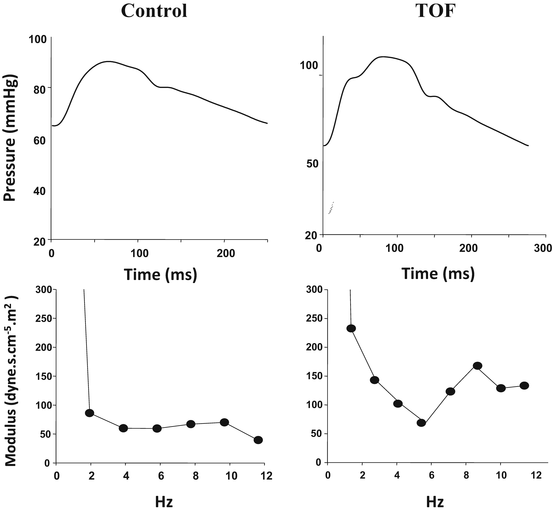
Each coefficient of the terms is called the impedance modulus, indicating the index of the vascular characteristics (Fig. 6.2, left).


Fig. 6.2
Examples of input impedance in control (left) and patients with TOF (right). Zc, represented by average modules of 3–10 Hz, is markedly increased in patients with TOF, indicating increased proximal aortic impedance. In addition, Z1, represented by the fundamental frequency modules, and fluctuation in the high-frequency domain are also markedly increased in patients with TOF
The impedance can be interpreted as the transfer function by which blood pressure waveforms are determined if the blood flow waveforms are input; thus, the impedance is an independent characteristic of vascular function regardless of the input to the arteries. Most important, input impedance coupled with the cardiac function evaluated by using the pressure-volume relation (elastance model) can be used to simulate blood flow and pressure waveforms in patient models. Input impedance itself conveys a variety of vascular characteristics in a frequency domain by which the specific mechanical properties of the artery can be evaluated.
6.2.1.2 Characteristic Impedance (Zc, Rc)
The averaged amplitude of high frequency is called the characteristic impedance, indicating the impedance of the proximal aorta mainly acting as the cardiac afterload. Characteristic impedance is the impedance to the forward traveling electric current until electricity fills the lead, represents the property of the electric leads independent of their length. Similar to the electric circuit, Zc in the arterial system represents the property of the proximal aorta and is usually calculated as the average of n = 3–10 frequency domains [19, 20], which are relatively free from the effects of reflection waves originating from the distal vessels. These frequency-analyzed data are validated by analyzing the early systolic pressure-flow (volume) data of the aorta and arterial elastance [3, 21].
6.2.1.3 Impedance Modules in Zero Harmonic: Peripheral Arterial Resistance (Rp)
Because the zero-frequency domain is free from the influence of sine curve components of flow and pressure formula, Z0 is equivalent to the peripheral arterial resistance, which is free from the pulsatile components. Accordingly, Z0 is theoretically equal to the nonpulsatile arterial resistance calculated as the pressure difference divided by the cardiac output (total arterial resistance, R).
The peripheral arteries are the most distal arteries from the heart, and they usually accept a nonpulsatile flow of blood. These are considered the resistant components of the electric circuit and comprise the total peripheral resistance (TPR). TPR is usually calculated as the difference between the mean arterial pressure and the right atrial pressure divided by the cardiac output:
 where TPR is the total peripheral resistance, mBP is the mean blood pressure, mRAp is the mean right atrial pressure, and CI is the cardiac index.

6.2.1.4 Reflection Index
The pulsatile components of the cardiac output generate reflex from heterogeneous parts of the vessels, where impedance mismatch, measured as the fluctuation of the impedance modules, exists. The magnitude of the fluctuation is considered as the intensity of reflex [22]; thus, the reflection index is calculated as the difference between the maximum and minimum values of impedance modulus at a frequency of >3 Hz. The reflection components are not included in the three-element windkessel model, but are suspected as the determinants of enhanced systolic pressure [23]. In addition, because low-frequency modules have large power, the module of the first harmonic can also be considered a representative of a reflection [24].
Senzaki et al. had reported about and emphasized the feasibility of input impedance analysis in patients with TOF and Kawasaki disease [14, 15]. Figure 6.2 shows examples of input impedance analysis in patients with TOF.
However, because such a frequency domain approach requires specific equipments and extra time for the analysis, the time domain approach is often used in the clinical evaluation of arterial function. These evaluations are presented in the latter part of this chapter.
6.2.1.5 Total Arterial Compliance
Total arterial compliance (TAC) [25, 26] is a quantitative index that corresponds to the characteristic of the condenser in the windkessel model. TAC represents the elastic property of the aorta; it is influenced by pulse wave transmission and reflection. Thus, it can be a comprehensive determinant of the cardiac afterload against the pulsatile blood flow. TAC decreases in response to increased arterial stiffness (e.g., due to aging) and is reported to be associated with essential hypertension [27] and the myocardial oxygen demand-supply balance [28].
The arterial pressure-volume relation and diastolic pressure decline in diastole had been used to evaluate TAC. Because the time constant (τ) of diastolic aortic pressure decay is the product of peripheral resistance (Rp) and arterial compliance (TAC), total arterial compliance can be obtained by the direct calculation of τ divided by arterial resistance. Liu et al. reported a simplified estimation of compliance (C area) calculated from the area under the curve of the aortic pressure waveform [29].
 where K is the area coefficient, As is the systolic pressure wave area, and Ad is the diastolic pressure wave area.

More recently, Chemla et al. found that the TAC calculation by using the area method can be replaced with the following formula [30]:
 where SV is the stroke volume and PP is the pulse pressure.

To summarize, arterial characteristics can be estimated, according to the concepts of the windkessel model, by using the data obtained during cardiac catheterization. These data can be relatively load-independent indices and, when combined with the cardiac parameters, can be used to simulate a human circulation model.
6.2.2 Estimation of Arterial Function with Indirect Methods
As mentioned above, although impedance analysis provides comprehensive information about arterial hemodynamics and function, computing impedance is somewhat cumbersome. In this section, we will introduce an indirect method to evaluate arterial stiffening during cardiac catheterization. This assessment can be performed even noninvasively; however, a couple of limitations exist because of problems specific to children.
6.2.2.1 Pulse Wave Velocity
Pulse wave velocity (PWV) is an index based on the principle that the pulse wave transmits faster in rigid substances than in compliant substances. Thus, an increase in PWV can be used as an indirect marker of arterial stiffening, which is associated with an increase in afterload.
The PWV is defined by the following formula introduced by Korteweg-Moens:
 where PWV is the pulse wave velocity, E is the Young’s modulus, h is the vascular wall thickness, ρ is the blood density, and D is the vessel radius diameter.

The formula represents the important influence of vascular diameter and wall thickness as determinants of the PWV, which should be kept in mind in the evaluation of vascular stiffness with PWV.
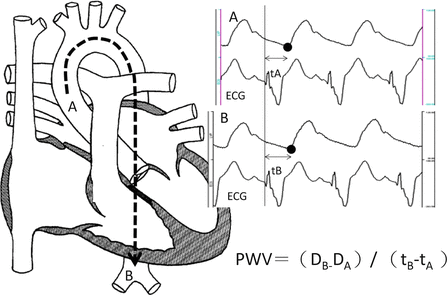
The measurement of PWV during catheterization is shown in Fig. 6.3. During catheterization, the pulse transmission time is calculated from the simultaneous measurements of pressure waveform and electrocardiogram (ECG), and the distances of the two different parts are obtained as the length of the catheter outside the body. Accordingly, the PWV is calculated as the distance divided by the traveling time interval between the two points. This method requires catheter insertion to the vessel; however, this PWV measurement is more accurate than the noninvasive alternatives, especially in children. If catheter examination is planned with the clinical requirement, then PWV can be evaluated without additional cardiovascular risk even in extremely small children such as neonates.


Fig. 6.3
Schema of calculating the pulse wave velocity (PWV) during cardiac catheterization
The large cohort studies of adult heart disease emphasized the clinical importance of PWV in predicting cardiovascular events, including myocardial infarction, unstable angina, heart failure, and stroke [17, 31]. In patients with congenital heart disease, we found the significant association between stiffening of the ascending aorta and dilatation in TOF [12]. Because Niwa et al. had elucidated the close correlation between aortic dilatation and arterial wall degeneration [32, 33], we concluded that arterial stiffening in TOF is associated with arterial mid-wall degeneration. In a similar-patients group, arterial stiffness, adjusted for confounding factors such as blood pressure and age, was significantly increased in unrepaired TOF than in repaired TOF [13]. Therefore, early anatomical correction would be recommended to prevent arterial degeneration and dilatation in patients with TOF. In addition, we also found that a similar correlation exists between arterial stiffness and dilatation in patients with a single ventricular circulation. Interestingly, the magnitude of the correlation between stiffness and dilation in a single-ventricle heart is much smaller than that of TOF, suggesting genetic background as an underlying mechanism of aortic dilation/stiffening in TOF.
For a better understanding, the relation between input impedance analysis and PWV should be addressed. As shown in the early part of this chapter, characteristic impedance (Zc) is the index of arterial property that mainly reflects proximal arterial stiffness without the influence of the reflection wave. Therefore, Zc and PWV should have a close correlation with each other. The relation between the two parameters is described as follows:
 where ρ is the blood density, Zc is the characteristic impedance, PWV is the pulse wave velocity, and r is the arterial lumen radius.

From this water-hammer formula and the Korteweg-Moens formula, it can be seen that Zc is more influenced by the arterial diameter than by the PWV.
6.2.2.2 Augmentation Index
The augmentation index (AI) represents the magnitude of blood pressure enhancement by the reflected wave. The underlying principle is simple: if the artery is stiff, the reflection wave is enhanced and returns early to the proximal aorta. In this concept, AI is a user-friendly marker evaluated by using only the arterial pressure waveform without any other special device. In considering the clinical utility of AI, its limitations should be elucidated, especially the following two points: First, AI is easily influenced by hemodynamic parameters. Studies about the association between input impedance analysis and wave reflection have shown that the variability of modules in high frequency, rather than those in low frequency, has considerable effects on the increase in AI, implying the importance of reflection in determining AI, whereas the reflection can also be influenced by the mean blood pressure [34, 35]. Second, systolic augmentation does not necessarily indicate the early arrival of the reflection wave. Mitchell et al. suggested that the enhancement of the systolic wave might be the result of an impedance mismatch induced by the small aortic size compared with the body size [36]. Therefore, AI is influenced by a variety of hemodynamic factors. Despite these limitations, influences of the decrease in TAC on the increase of reflection are also reported, thus confirming the usefulness of AI as an index of arterial stiffness [37]. We therefore propose that in the vascular assessment with AI, the limitations of this index should be accounted for and that it seems suitable to judge hemodynamic status only during cardiac catheterization.
6.3 Evaluation of Venous Function by Using Cardiac Catheterization
The venous system retains almost 75 % of the total amount of blood in the body and mobilizes or reduces venous return in response to the body’s demands. This is the basis of the preload reserve; thus, venous function can be considered as one of the main components of circulation. This can be understood through the concept of pressure-volume relation; if the preload is reduced, significant increase of afterload or dramatic hyper-contractility is required to maintain the body’s blood pressure. Decreased preload reserve is a frequently encountered pathophysiology in pediatric cardiology in the management of repaired TOF [38], pulmonary atresia with intact ventricular septum [39], and Ebstein’s anomaly [40]. The common fundamental pathophysiology would be decreased pulmonary ventricular function, and the Fontan circulation represented by a lack of the right ventricle is the extreme example of this pathophysiology. In addition, heart failure gives rise to activation of the RAA hormonal axis, leading to cardiac diastolic dysfunction [41]. Thus, the preload is one of the easily disrupted mechanisms, especially in congenital heart disease (which includes various types of right ventricular failure).
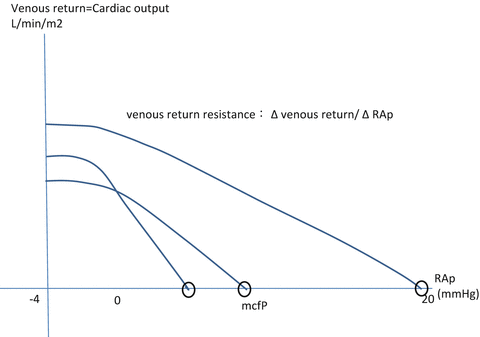
Despite the importance of venous capacity and thus preload reserve in the cardiovascular system, assessment of venous properties is scarcely understood in humans. Guyton et al. proposed the concept of venous return curves in animal and theoretical experiments [42–44], which represent the relation between right atrial pressure and cardiac output (Fig. 6.4).


