Fig. 8.1
Cardiovascular MR setup for pediatric general anesthetic cases. View of the MR scanner room showing the monitoring equipment
The three imaging techniques listed below represent the three groups in which the subjects in this study were divided for the purpose of performing hemodynamic evaluation using cardiac function analysis/MRI in CHD patients. A detailed discussion of each technique is also included.
1.
Cine MRI
2.
VEC-MRI
3.
Other: MRI with contrast and tagging cine MRI
8.2 Evaluation of Cardiac Function by Using MRI: Detailed Discussion of the Methods Used
8.2.1 Cine MRI
The cine MRI technique has the advantage of allowing the operator to take video images of the heart in segments in any direction without interference from bones or air [4]. It is the most accurate method to evaluate cardiac function and wall movement and has high reproducibility. Iodinated contrast media must be administered to the patient when MDCT is used for cardiac function evaluation, and rapid intravenous injection of contrast medium may affect cardiac function. However, since cine MRI does not involve exposure to radiation, contrast medium is unnecessary, making it a highly noninvasive procedure. Further, in MDCT, the heart rate of patients is effectively lowered by beta-blocker administration, causing reduction of artifacts and radiation exposure; however, the operator needs to be careful while performing MDCT after the beta-blocker administration to prevent a significant increase in left-ventricular end-diastolic and end-systolic volumes, which can cause a drop in cardiac output [5]. In contrast, since cine MRI does not require beta-blocker administration, accurate evaluation of cardiac function in the physiological state is possible.
8.2.1.1 Characteristics and Imaging Technique of Cine MRI
The cine MRI technique uses ECG gating, imaging 16–40 video frames of heart movement per beat. The SSFP imaging technique obtains high-intensity blood signals without the use of contrast media and clearly renders both the inner and outer sides of the pericardium at the left ventricle [6–8]. This sequence refocuses all gradients of three axes in a single TR in order to obtain the signals, making it possible to obtain powerful signals in a steady state. Imaging in TR and echo time (TE) is possible, which reduces the imaging time to less than half of that required by the GRE technique. Since contrast is determined by T2/T1, the myocardium is shown with a low-intensity signal and blood is shown with a high-intensity signal. Further, since this technique does not rely upon inflow effects, its advantages are that even slow blood flow can be shown with a high-intensity signal and that lumen is shown with a uniform high-intensity signal. Fat and pericardial effusions are also shown with a high-intensity signal, and the border of the outer margin of the myocardium is also clearly shown; however, care must be taken because it is difficult to distinguish between fat and pericardial effusions.
The cine MRI procedure is as follows: after performing cine MRI of the vertical and horizontal longitudinal sections, serial cine-MRI sections that cover the entire left ventricle from the mitral valve to the apex are obtained, and, when necessary, four-chamber and three-chamber long-axis cine MR images that show the left-ventricular outflow tract are also generally obtained. Since each cine image slice is a series of images of different cardiac phases, one slice includes images of several phases (Fig. 8.2). Thus, not only is the time that a patient must hold their breath reduced, but image quality is also improved. In the past, a single slice required the patient to hold their breath for approximately 20 s, but when steady state is used, this time is reduced to approximately 7 s. Further, when parallel imaging is concurrently used, this time can be further reduced to approximately 4 s, without any loss of image quality.


Fig. 8.2
Cine MRI using steady-state free precession. The panels are typical long-axis views; the left panel shows systole and the right panel shows diastole. MR images of a 1-year-old patient with mitral valve regurgitation
ECG gating of cine MRI can be either prospective or retrospective. In general, prospective ECG gating requires a shorter imaging time, but the signal for the last 10–20 % of the cardiac cycle, i.e., the end-diastole, cannot be obtained, which means that the cardiac cycle data are incomplete. This is a particularly important issue for physiological and functional images. Retrospective ECG gating is used when data for the entire cardiac cycle are required. Since cine imaging using ECG gating requires the patient to hold their breath, image quality deteriorates if arrhythmia occurs or if the patient does not hold their breath completely.
8.2.1.2 Analysis of Cardiac Function
Volume analysis using echocardiography and left ventriculography calculates approximate spheroid and other shaped geometric models of the left ventricle. Thus, errors increase when there are morphological abnormalities in the left ventricle. Cine MRI has the advantage of allowing the operator to accurately set the direction of the image slices freely so that they are taken at regular intervals and in parallel. When cine MRI and the Simpson technique are used, deformation of the left ventricle leads to almost no deterioration in accuracy, making it possible to obtain ideal cardiac function measurements (Fig. 8.3) [9, 10]. Specifically, left-ventricular short-axis cine images from the base to the apex are taken in succession, and each slice traces the outer pericardial edge of the myocardium during both the diastole and systole. Thus, left-ventricular end-diastolic volume, left-ventricular end-systolic volume, and myocardial mass can be calculated (Fig. 8.4). Even in cases of left-ventricular deformation, localized thickening of the wall, and lump formation, accurate analysis of volume and myocardial mass is possible. Thus, currently, cine MRI is the gold standard for the evaluation of ventricular volume [11, 12]. When measuring the rate of systolic wall thickening from the localized areas of myocardial wall thickness by using cine MRI during the diastole and systole, a more accurate diagnosis of localized myocardial contractility can be made than is possible with visual evaluation. Further, since all frames trace the short axis, diastolic function can be evaluated on the basis of time–volume curves.

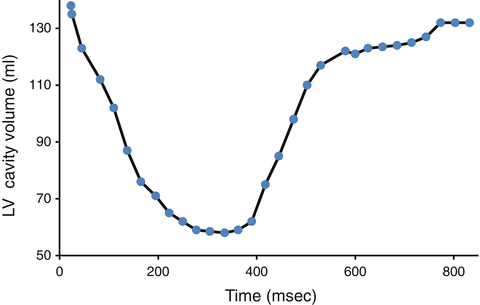

Fig. 8.3
Cine MRI used to assess cardiac index. The MR images are from the same patient as that in Fig. 8.1, i.e., a 1-year-old patient with mitral valve regurgitation. By measuring end-diastolic and end-systolic endocardial borders on all slices, stroke volume can be calculated

Fig. 8.4
Time–volume curve of the left ventricle during the cardiac cycle in a 13-year-old patient with mitral valve regurgitation. Short-axis cine imaging using contiguous 8-mm-thick slices and 2-mm slice gaps
In the field of pediatric cardiology, testing of ventricular volume and diastolic function determines the timing of surgery, and it is very important to do this after diagnosing and treating cardiac insufficiency. In many cases of CHD, it is important to evaluate not only left-ventricular function but also right-ventricular function. Since the right ventricle has a complicated three-dimensional shape, unlike the left ventricle, the accuracy of measurements of the right-ventricular capacity taken by echocardiography and cardiac catheterization is severely limited. However, axial transverse section slices taken using cine MRI allow accurate evaluation of right-ventricular volume and diastolic function (Fig. 8.5) [13]. After surgery for tetralogy of Fallot (TOF), complications such as pulmonary stenosis and pulmonary regurgitation are often observed, and these conditions can cause right-ventricular hypertrophy, enlargement, and right-ventricular insufficiency over the long term. Geva et al. evaluated cardiac function after surgery for TOF in patients by using MRI and reported the risk factors [14]. Schmitt evaluated cardiac function during exertion after the Fontan procedure in patients by using MRI [15]. As shown in the abovementioned and many other studies, cine MRI is used more often in the evaluation of cardiac function than is any other technique in cases of CHD [16, 17].


Fig. 8.5
Cine MRI used to assess right-ventricular volume and ejection fraction. The MR images are from the same patient as that in Fig. 8.1, i.e., a 1-year-old patient with mitral valve regurgitation. By measuring the end-diastolic and end-systolic endocardial borders on all slices, stroke volume can be calculated
8.2.1.3 Disadvantages of Cine MRI
One of the disadvantages of cine MRI is that images become blurred when arrhythmia is present. Arrhythmia causes errors to occur when this technique, which involves imaging using ECG gating, is used. In clinical settings, the time required for posttreatment is also a major problem. Most of the types of measurement software currently in use recognize the lumen and have functions that allow them to automatically set the borders. However, these settings require that an operator check and correct the borders. Especially when assessing CHD in pediatric patients, specialist advice regarding the anatomical position of structures is required. When patients cannot hold their breath reliably or sufficiently long enough—pediatric patients are completely unable to hold their breath—or when imaging is performed while the patient is breathing normally, the position of the heart changes, owing to the movements of breathing. The resulting image may be blurred, the tracing function of the measurement software may be impossible to use, and measurement errors may occur. In the future, it will be necessary to speed up the imaging time and develop posttreatment methods.
8.3 Velocity-Encoded Cine MRI (VEC-MRI)
In general, cardiac catheterization and echocardiography are used for quantitative measurements of cardiac output and volume of blood flow. Cardiac catheterization can be used to perform quantitative measurements using the Fick principle and thermodilution; however, this method has disadvantages in that it is invasive. Echocardiography has the advantage of being a noninvasive bedside technique that can be performed at any time. Thus, it is the first diagnostic method of choice for blood flow volume measurement. However, this method also has disadvantages in that it is often difficult to obtain images with satisfactory quality or a good incidence angle of the ultrasonic beam and reproducibility is poor between different testers and even when performed multiple times by the same tester. Among the cine MRI techniques, VEC-MRI using the PC method has been attracting attention as a less invasive and safer measurement technique than the invasive cardiac catheterization method, because it can accurately measure blood flow volume as the flow velocity of each cardiac phase of a freely selected blood vessel section even if the intravascular blood flow distribution is complex.
8.3.1 Principle and Technique of VEC-MRI for Blood Flow Measurements
VEC-MRI allows noninvasive measurements of blood flow velocity in the heart and blood vessels, including those locations where an ultrasonic beam cannot reach. VEC-MRI switches the polarity of the gradient magnetic field for blood flow measurements and collects two types of MRI data. On comparing the phases of the images obtained, the same phases are observed for stationary objects, but for moving objects, phase differences are observed that are proportional to the speed of the moving objects, which makes it possible to measure the velocity of movement. In VEC-MRI, the mean value [the intensity within a region of interest (ROI), which represents the blood flow velocity] of every image pixel can be calculated in images from diastole to systole. The methods include the use of body array coil and spine array coil. To ascertain the blood flow direction in the blood vessels whose blood flow volume is desired, PC is used to make the sections vertical, and then, cine MR images are obtained (Fig. 8.6a). After several minutes of imaging time for each slice have elapsed, magnitude images (Fig. 8.6b) and PC images (Fig. 8.6c) are obtained. The ROI of the target blood vessel is set, and blood flow velocity is measured using the analytical software included in the imaging equipment (Fig. 8.7). A time–velocity curve is then constructed using the average velocity of the blood flow passing through the ROI during one cardiac cycle (Fig. 8.8a). A time–flow curve is then produced by multiplying the velocity curve with the area of the ROI (Fig. 8.8b). The blood flow volume (time–net flow curve) passing through the ROI can be obtained by integrating the flow–volume curve (Fig. 8.8c).
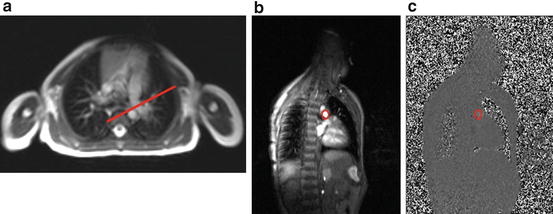
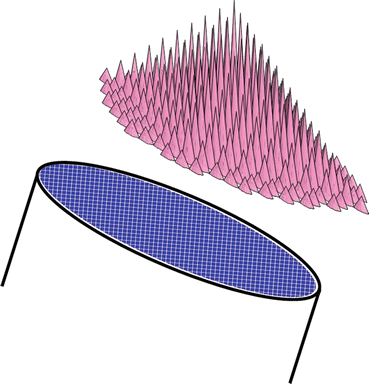
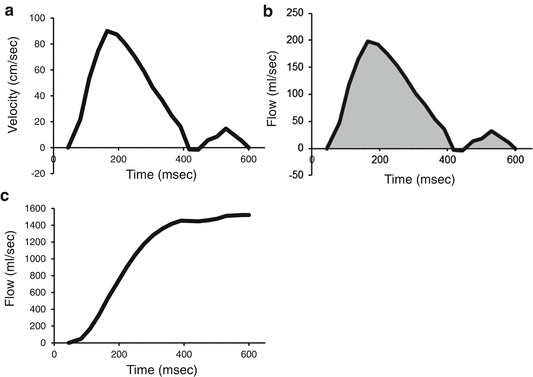

Fig. 8.6
(a) Localization of the left pulmonary artery. Phase-mapping sequence applied perpendicular to the left pulmonary artery axis. The magnitude (b) and phase contrast (c) images allowed measurement of the vessel cross-sectional area, “ROI”

Fig. 8.7
The vascular cross section is divided in many pixels. Momentary velocity of each pixel is measured using VEC-MRI. Average velocity is obtained by dividing the sum of these velocities by the number of pixels

Fig. 8.8
(a) Time–velocity curve: the cross axis indicates one cardiac cycle and the vertical axis indicates velocity. (b) Time–flow curve: velocity is multiplied by the area of the ROI; the cross axis indicates one cardiac cycle and the vertical axis indicates flow volume. (c) Time–net flow curve: flow volume is added during one cardiac cycle; the cross axis indicates one cardiac cycle and the vertical axis indicates true blood flow
8.3.2 Investigation of Usefulness in Pediatric Patients
We investigated the usefulness of VEC-MRI for measuring the following data in pediatric patients with CHD (Table 8.1): pulmonary blood flow (Qp), cardiac output (CO), and pulmonary blood flow/systemic blood flow ratio (Qp/Qs). The velocity curve for normal pulmonary arteries is represented by an isosceles triangle (Fig. 8.9a). In the case of ventricular septal defect (VSD) (Fig. 8.9b), where the systolic pulmonary arterial pressure was high, the period from the start of ejection to the peak was much shorter than normal. In contrast, the ejection period of the velocity curve pattern was longer, reflecting an increase in pulmonary blood flow. However, in cases of atrial septal defect (ASD) (Fig. 8.9c), where there was no pulmonary hypertension, the velocity curve pattern had a wider base along the time axis, which was similar to VSD, but the period from the start of ejection to the peak was the same as normal. Moreover, in cases of VSD with Eisenmenger syndrome (Fig. 8.9d), the period from the start of ejection to the peak was extremely short, and the ejection time was shorter than normal.
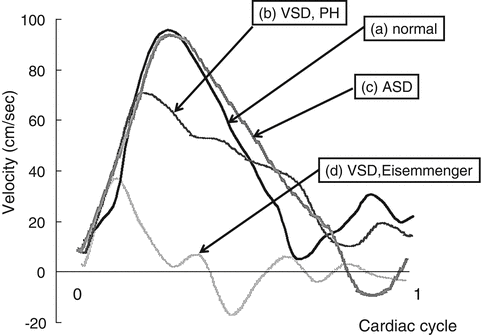
Table 8.1
Characteristics of patients
Without shunt (including ICR) | With shunt | |
|---|---|---|
Ventricular septal defect (VSD) | 5 | |
Atrial septal defect (ASD) | 5 | |
Patent ductus arteriosus (PDA) | 4 | |
Tetralogy of Fallot (ToF) | 3 | |
Double-outlet right ventricle (DORV) | 1 | |
Atrioventricular septal defect (AVSD) | 1 | 1 |
Transposition of the great arteries (TGA) | 2 | |
Single ventricle (SV) | 3 | |
Coarctation of the aorta (CoA) | 4 | |
Aortic valve stenosis (AS) | 5 | |
Total | 15 | 19 |

Fig. 8.9
The velocity curve for normal pulmonary arteries is represented by an isosceles triangle (a). In the case of VSD (b), where the systolic pulmonary arterial pressure was high, the period from the start of ejection to the peak was much shorter than normal. In contrast, the ejection period of the velocity curve pattern was longer, reflecting an increase in pulmonary blood flow. However, in cases of ASD (c), where there was no pulmonary hypertension, the velocity curve pattern had a wider base along the time axis, which is similar to VSD, but the period from the start of ejection to the peak was the same as normal. Moreover, in cases of VSD with Eisenmenger syndrome (d), the period from the start of ejection to the peak was extremely short, and the ejection time was shorter than normal
(a)
Comparison of the sum of the blood flow volumes of the main pulmonary artery (MRI-Qp) and the right and left pulmonary arteries (MRI-Qp [Rt + Lt]) (Fig. 8.10)
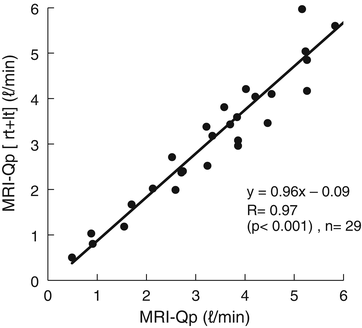

Fig. 8.10
Comparison between the blood flow volume of the main pulmonary arteries (MRI-Qp) and the sum of that of the right and left pulmonary arteries (MRI-Qp [Rt + Lt]), measured using VEC-MRI
We measured the blood flow volumes of the main pulmonary artery and the right and left pulmonary arteries—three vessels that differ in direction and diameter—to determine if the sum of the blood flow volumes of the two vessels matches that of the third vessel, which should normally be the same. Our results showed an extremely good correlation. This confirms the reproducibility and accuracy of VEC-MRI to measure blood flow in pediatric patients, including infants.
(b)
Comparison of cardiac output (Fig. 8.11)
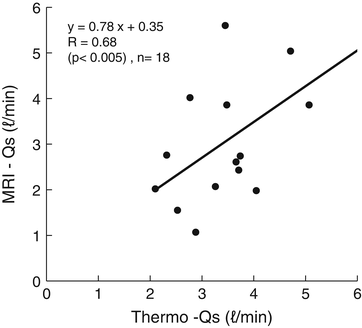

Fig. 8.11
Comparison between the systemic blood flow measured using VEC-MRI (MRI-Qs) and that measured using cardiac catheterization with thermodilution (Thermo-Qs)
The use of thermodilution with a Swan–Ganz catheter is the gold standard for measuring cardiac output. However, it is difficult to use this method in pediatric patients. Caputo et al. performed phantom experiments that showed that cardiac output measured using VEC-MRI was slightly lower than the values obtained using echocardiography [18]. Kuehne et al. used swine in their comparison between VEC-MRI and thermodilution, but to our knowledge, almost no studies have been conducted on pediatric patients [19]. Our study on pediatric patients showed a good correlation between the use of thermodilution and VEC-MRI to measure cardiac output.
(c)
R/L comparison of the blood flow volume of the right and left pulmonary arteries and R/L comparison of pulmonary perfusion scintigraphy (Fig. 8.12)
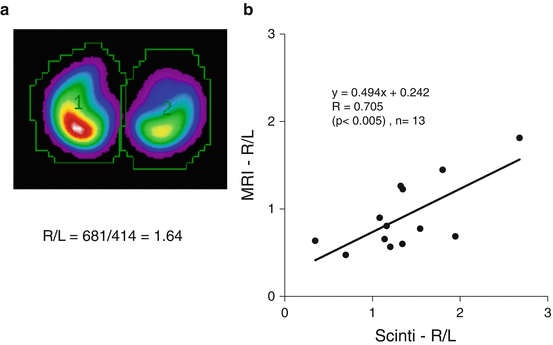

Fig. 8.12
(a) Pulmonary perfusion scintigraphy image of a 3-year-old patient with left pulmonary arterial stenosis after intracardiac repair of TOF. (b) Comparison between the ratio of right and left pulmonary blood flow measured using VEC-MRI (MRI-R/L) and that measured using scintigraphy (Scinti-R/L)
Pulmonary perfusion scintigraphy is a physiological function test that allows a comparison between the right and left pulmonary blood flow. Osada et al. compared the use of VEC-MRI and pulmonary perfusion scintigraphy for assessing pulmonary blood flow in adults not having heart disease and obtained satisfactory outcomes [20]. Ordovas et al. evaluated the use of VEC-MRI and pulmonary perfusion scintigraphy for assessing right and left pulmonary blood flow in postoperative congenital heart disease patients [21]. Our study on pediatric patients also showed a good correlation between the R/L comparison of scintigraphy and that of MRI. Fratz et al. compared the use of VEC-MRI and pulmonary perfusion scintigraphy for assessing the right and left pulmonary blood flow in patients who had undergone the Fontan procedure and found that VEC-MRI was more accurate [22]. This is because VEC-MRI not only provides a comparison of blood flow but also shows blood flow volume. Further, R/L comparison of pulmonary perfusion scintigraphy after the Glenn procedure and the Fontan procedure in patients showed that radioisotope (RI) had to be intravenously injected at several sites, but when VEC-MRI was used, this was not necessary, suggesting that the target values could be obtained with a single test.
(d)


Comparison of pulmonary to systemic blood flow ratio (Qp/Qs) in CHD patients (Fig. 8.13)
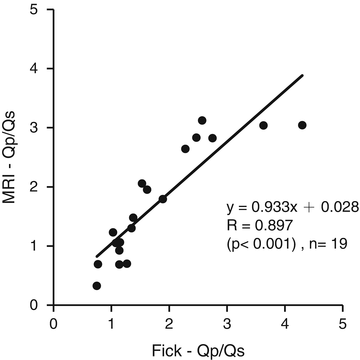

Fig. 8.13
Comparison between Qp/Qs measured using VEC-MRI (MRI-Qp/Qs) and that measured using the Fick method (Fick-Qp/Qs)
The use of VEC-MRI to measure the blood flow volume of the ascending aorta and pulmonary arteries in CHD patients allows the noninvasive measurement of the left and right shunt blood flow volume and Qp/Qs. Qp/Qs is an important indicator that helps determine whether surgery is appropriate for CHD patients with ASD, VSD, or other conditions. Brenner et al. compared Qp/Qs values that were obtained using VEC-MRI and echocardiography in adults with a long history of ASD [23]. Peterson et al., in their study on VSD and patent ductus arteriosus (PDA) in addition to ASD, showed that there was a good correlation between Qp/Qs values obtained using VEC-MRI and those obtained using oximetry in cardiac catheterization tests performed on 17 adult patients [24]. Beerbaum et al. found a good correlation between Qp/Qs values obtained using VEC-MRI and those obtained using cardiac catheterization in pediatric ASD patients [25].
Stay updated, free articles. Join our Telegram channel

Full access? Get Clinical Tree


