2 Aortic Stenosis 
Goals of Echocardiography in Aortic Stenosis
 To determine that aortic stenosis is present
 To determine the level(s) of obstruction/stenosis (valvar versus other)
 To determine the hemodynamic severity of the aortic stenosis
 To assess the regional and overall left ventricular (LV) function carefully
 To determine the stroke volume
 To assess for bicuspid valve anomaly, its associations, and its complications
Scanning Issues
Required Parameters to Obtain from Scanning
 Morphology (bicuspid?)—use a zoom view, focus in systole

 Severity of associated aortic insufficiency
 Left ventricular outflow tract (LVOT) diameter

 Ejection fraction (EF) or “grade” of dysfunction

 Sinotubular junction (STJ) level (more pressure recovery when STJ is <30 mm)
 Ascending aorta level (associated dilation)
 Exclusion or identification of concurrent subvalvar obstruction
 Noting height and weight for body surface area normalization
Scanning Notes
 To minimize error, a zoom view must be used.
 If the image quality confers ambiguity, repeat the measurement on several different zoom views.

 If the LVOT diameter is in doubt, consider:

 Do not record the V1 from within the LV cavity, or the recorded velocity and AVA tend to be too low.


 AVA calculations traditionally are made from integrals; peak velocities are a surrogate.
 If sinus rhythm: measure three spectral profiles.
 If in atrial fibrillation: measure five spectral profiles.


 If sinus rhythm: measure three spectral profiles.
 If in atrial fibrillation: measure five spectral profiles.
 If in the idea world: measure ten spectral profiles.
 Annotate the site of sampling for future reference comparison.


Equations


where AVG = average gradient, CSA = cross-sectional area, SBP = systolic blood pressure, and VTI = velocity time integral.
Pathophysiology and Findings of Aortic Stenosis
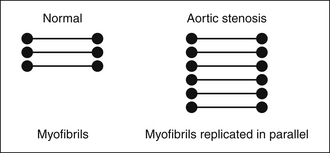
In severe AS, where the systolic pressure within the LV doubles, LV mass essentially doubles (increases to 178 g/m2 vs. normal of 86 g/m2),1 due to near doubling of the wall thickness to normalize wall stress that otherwise would be nearly doubled (Fig. 2-1).
Severe AS may remain seemingly static and compensated for years, or may progress. The rate of progression depends on many factors, few of which are well understood. Progression rates between –0.01 cm2/year and –0.1 cm2/year have been described. Calcification of the aortic valve is somewhat predictive of a faster rate of progression, but it is not known how to quantify calcification toward this purpose. Electron beam CT studies have not shown good correlation of calcification quantification by Agatston score with aortic valve area, especially for moderate and severe AS.2
In summary, the pathophysiology of severe AS generates expected findings: increased wall thickness, no increase in left ventricular cavitary size, and left atrial dilation. An increase in cavitary size requires additional explanation, such as concurrent volume overload from aortic insufficiency or mitral regurgitation, impaired systolic function from CAD or cardiomyopathy, or terminal decompensated AS.
Role of Transesophageal Echocardiography in Aortic Stenosis
There is no routine role for TEE in the assessment of AS.
TEE probably is the best test available to image subvalvar lesion morphology in detail.
TEE is a standard test prior to percutaneous aortic valve replacement (AVR) (see Chapter 26) and optimally is used to determine the size of the prosthesis and the morphology of the annuli, valve, and root.
Reporting Issues
Gradient Issues
 Bradycardia in the context of normal LV function or contractile recruitment
 Causes of larger stroke volume ± lower peripheral resistance


 Adequate spectral profiles are complete and plausible parabolic profiles.


 The published correlation of Doppler versus catheterization mean gradients averages 0.90,3,4 but importantly, 1 standard error of estimate (SEE) of Doppler gradient versus catheterization gradient is actually 10 mm Hg [SEE range, 6–12 mm Hg].5
 Rahimtoola5 emphasized consideration of the SEE by Doppler when describing AS severity (by gradient):

 LVSWL, originally a catheterization-based parameter, can be approximated by echocardiography, and has been validated as a way to discriminate clinical end-points: an LVSWL ≤25 is the best predictor.6 The concept expresses kinetic energy loss across the aortic valve in reference to the aortic pressure.
Continuity Equation–Derived Aortic Valve Area Issues
 Place less emphasis on the valve area alone; instead, emphasize the combination of area, gradient, and stroke volume. Unless these afford a congruent assessment of aortic stenosis severity, further consideration is needed.
 Continuity-derived AVA is not flow independent.7

 The average published correlation of Doppler-derived AVA versus catheterization-derived AVA is r = 0.90. However, recall that the SEE of Doppler AVA versus catheterization gradients is, on average, 0.3 mm Hg [0.1–0.4 cm2].5
 Rahimtoola5 suggests consideration of patient body size indexing of the AVA.


Other Issues
Describe the dimensions and appearance of the root and ascending aorta. These are potentially important surgical details that may modify the approach to surgery. Furthermore, if a case is obviously severe, and the aortic annulus is small, the size of the annulus should be mentioned. An unusually small root will allow only a small prosthesis, which engenders a gradient little better than the AS it was supposed to relieve—an outcome known as “patient–prosthesis mis-match.” Although such a mismatch probably is not as significant a clinical problem as has been purported, it still has validity in some cases.
Concurrent Subvalvar Stenosis
 Subvalvar AS is revealed by the PISA (flow convergence) at a level well beneath the aortic valve (>1 cm beneath, but influenced by the Nyquist limit). Formerly, emphasis of detection was on pulsed wave Doppler sampling; however, as color flow mapping is essentially a flow map of pulsed-wave Doppler, clear color Doppler depiction of PISA well away from the valve is equivalent.


 Although one catheter study has suggested a 30% incidence of subvalvar gradients,8 the incidence does not appear to be as high as that.

Low-Gradient Severe Aortic Stenosis
 The definition of “low-gradient severe AS” is unresolved and variable, but may be approached as follows:


 EF% generally increases after AVR10,11 unless a perioperative infarction occurs, or the LV is intractably stiff. It appears that selected cases of low-gradient severe AS still benefit from AVR,12 although the data in this field are preliminary.13


 Valve resistance has been proposed as a means of establishing the severity of AS (>300 dynes/sec/cm−5 = severe disease) that is independent of flow output, but it has not been proved to be better than valve area calculation,9 nor has it been popular. It appears less useful than LVSWL.6
 Determination of contractile reserve in low-gradient severe AS cases

Discordance of Catheterization and Echocardiographic Determination of the Severity of Aortic Stenosis
Possible Reasons for Discordance of Catheterization and Echocardiographic Determination of the Severity of Aortic Stenosis
 Recall that nonsimultaneous (echocardiographic and catheterization) estimates of gradient and area are obviously likely to differ more as stroke volume (cardiac output) and peripheral load is variable over time.

 Recall that the published SEE of Doppler AVA versus catheterization gradients is about 0.3 cm2.

Stay updated, free articles. Join our Telegram channel

Full access? Get Clinical Tree


