3 Aortic Insufficiency 


Scanning Issues
Required Parameters to Obtain from Scanning


 The assessment of AI severity should incorporate multiple methods. Stronger methods include:
Determination of the Cause of Aortic Insufficiency

 Aortic dissection and intramural hematoma*: Dissection and intramural hematoma of the root may lead to AI from several mechanisms. Dissection into the root will compromise the support of the adjacent cusp, which then prolapses, resulting in eccentric AI. Another mechanism seen in aortic dissection that may occur is prolapse of the intimal flap into the valve orifice, preventing it from coapting.


 Myxomatous degeneration (approximately 10% of pure severe AI)


 Hypertension: patients with systolic hypertension commonly have mild leaflet thickening and mild AI.1
Spectral and Volumetric Techniques
 In general, spectral profiles should be displayed as two-thirds the height of the display, and wide enough so that two or three profiles are available for measurement.


 Total forward stroke volume (if no MR) is described by Simpson’s EDV-ESV or LVOT stroke volume.


Reporting Issues
 Describe the cause of the AI and the severity together: For example, “Severe aortic insufficiency due to a flail leaflet, with a regurgitant fraction of 60%.”


 Compare all findings to previous studies.


 In the context of AI, do not report the total forward cardiac output (CO) as the net forward CO.
 False-positives of abdominal aortic flow reversal are rare.

Notes on Echocardiographic Methods to Describe Severity of Aortic Insufficiency
Retrograde Holodiastolic Flow in the Abdominal Aorta
Retrograde holodiastolic flow in the abdominal aorta is sensitive (100%) and specific (96%) for level 3+ or 4+ AI. Consequently, it is one of the best signs to determine whether AI is severe. The potential false-positives include aortopulmonary shunts and patent ductus arteriosus2 and also, possibly, aortic root to left atrial, right ventricular, or right atrial fistulae, all of which should be evident from color Doppler scanning. Abdominal diastolic flow reversal is analogous to the time-honored peripheral pulse signs used in physical diagnosis.
Retrograde Flow Profiles in the Proximal Thoracic Descending Aorta
The peak velocity of the regurgitant (diastolic) flow correlates with the regurgitant fraction (r = 0.82) and the regurgitant grade by angiography (r = 0.81). AI of 3+ by angiography correlates with a TVI of 22 ± 6 cm/sec SD, and 4+ by angiography with 34 ± 9 cm/sec).3 End-diastolic flow velocity of 40 cm/sec or greater predicts a regurgitant fraction of 40% or more with a sensitivity of 89% and a specificity of 96%.4
The integral of the spectral display of diastolic flow recorded from the proximal descending aorta (divided by the integral of the systolic flow) mapped in the proximal descending aorta correlates well with angiographic regurgitant fraction: r = 0.915 and r = 0.90; standard error of estimate (SEE) 9%.6 However, the sign is inaccurate in the presence of aortic stenosis,7 because the high-velocity systolic aortic stenosis jet continues around the arch in some cases. Neither the “cut-off” for the diastolic flow nor that for the diastolic flow integral/systolic flow integral that it constitutes has been conclusively established for severe AI. Some centers use 15 cm as the threshold above which AI is defined as severe. Obvious pan-diastolic flow above the baseline correlates well with the presence of severe AI,6 as long as no aorticopulmonary shunt is present.
Color Doppler Flow Mapping of the Left Ventricular Outflow Tract
Color Doppler flow mapping of the LVOT is useful to detect AI. Indexing improves correlation8 with angiography (r = 0.88) and can classify the majority of central AI jets with thoracic (83%) and abdominal (86%)9 aortic flow profiles. It is a poor technique to assess eccentric AI jets, however, and overall tends to be inaccurate. Indexing is performed to the height or area of the LVOT, to the aortic valve area, or to body surface area, and correlates with severity (r = 0.87).10 Oblique jets are problematic, because they result in overestimation of severity. Jet length into the LV has been proved to be an inaccurate means of describing AI severity, because jets of severe AI can be shorter than jets of moderate AI. Perry8 proposed the categorizations shown in Table 3-1.
TABLE 3-1 Categorization of AI Severity by Color Doppler Flow Mapping Indexed to the LVOT
| AI GRADE | JET HEIGHT/LVOT | JET AREA/LVOT |
|---|---|---|
| I | 1–24% | <4% |
| II | 25–46% | 4–24% |
| III | 47–64% | 25–59% |
| IV | ≥65% | ≥60% |
AI, aortic insufficiency; LVOT, left ventricular outflow tract.
Vena Contracta Width and Area
The vena contracta imaged in the posterior long-axis view correlates well (P < 0.0001) with Doppler effective regurgitant orifice (ERO; r = 0.89) and RVolume (0.90), and 2D methods (r = 0.90, r = 0.90), as well as with angiographic grading (r = 0.82; P = 0.01).11,12 A vena contracta width of ≥6 mm is 95% sensitive and 90% specific for diagnosing severe AI (ERO ≥ 30 mm2),11 and vena contracta area ≥7.5 mm2 is 100% sensitive and specific for severe AI (RVolume > 50 mL).12 Vena contracta width appears to be afterload independent.12
Effective Regurgitant Oriface Method: Proximal Isovelocity Surface Area and Doppler
The proximal isovelocity surface area (PISA) ERO method correlates well with reference techniques (P < 0.0001) but exhibits a trend to underestimate ERO due to cases where the AI jet is obtuse.4 Doppler ERO correlates well with angiographic estimates of ERO (r = 0.97) when the aortic diameter is less than 4.8 cm.13 Aortic pressure changes may influence the ERO, depending on whether the defect causing the AI is central (dynamic ERO: 51 ± 33% change with pharmacologic hypertension) versus a perforation in a leaflet proper (minimally dynamic orifice (9 ± 7%).14 Aortic root area is strongly dependent on the aortic diastolic pressure and can vary widely with pharmacologic hypertension.14
 Regurgitant volume of AI (RVolume):
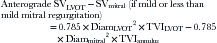
where Diam = diameter, PA = pulmonary artery, and SV = stroke volume.
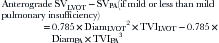
 Regurgitant fraction of AI (RFraction):

The regurgitant fraction of AI can be calculated by left ventricular outflow as the total forward systolic volume (RVolume + net forward SV) minus anterograde flow anywhere there is no regurgitant flow (mitral level or PA).3,15,16 RFraction by Doppler correlates well with RFraction by catheterization: r = 0.96.3 Using this technique, 3+ and 4+ AI by angiography are associated with 53% and 62% RFraction by Doppler.3 The technique is less accurate with depressed left ventricular ejection fraction, and, as would be anticipated, in the presence of mitral regurgitation.15

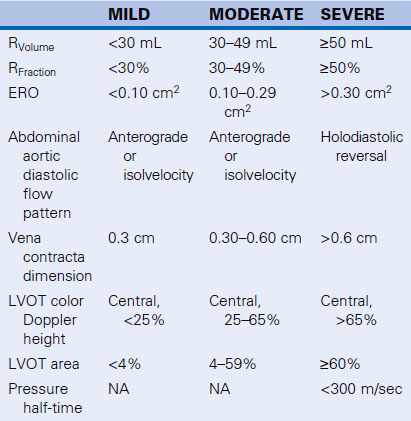
Aortic Insufficieny Deceleration Time, Pressure Half-Time, and Slope
The PHT assessment of AI is feasible when the spectral profile can be obtained, and AI spectral profile DT and PHT correlate with angiographic AI severity (r = −0.79 and r = −0.89, respectively)1719 and are independent of the alignment of sampling.17 Echo PHT correlates well with catheter-derived PHT, but factors such as systemic vascular resistance and aortic and LV compliance all affect AI PHT. Thus, unless the PHT is <300 msec where AI is always severe, the PHT method is not reliable for distinguishing different grades of AI.20 Slope also correlates with left ventricular end-diastolic pressure (LVEDP; r = 0.8018 and r = 0.84),21 but in two studies18,21 the SEE has been reported to be 5 mm Hg. Therefore, this technique is unreliable in the presence of an abnormal ventricle,22 or varying aortic load on the AI.
Calculation of Left Ventricular End-diastolic Pressure
The LVEDP may be approximated by subtracting the end-diastolic peak gradient from the EDP.
Doppler tends to overestimates LVEDP by catheterization using the AI end-diastolic gradient.21 The sensitivity and specificity of Doppler-estimated LVEDP >15 mm Hg versus that of <15 mm Hg are 76% and 90%. repectively.21
Aortic Insufficiency Deceleration Time
Measurement of AI DT is possible when the spectral profile is clear. Although DT correlates with angiographic grade (r = 0.85), Labovitz et al.23 found that DT >2 m/sec establishes that AI is worse than mild, but DT is not nearly as helpful in distinguishing severe from moderate AI. The same authors found that PHT did not distinguish moderate from severe AI.
Mitral Valve Preclosure
Preclosure is an uncommon sign seen with some cases of acute, severe (“torrential”) AI, usually due to infective endocarditis, proximal aortic dissections, and trauma. Preclosure also may result from a long PR interval24 or from complete heart block, both of which may occur with aortic valve endocarditis if there is a root abcess.25 Pulsed-wave Doppler offers timing and the chance to record the valve leaflet “click.”26 Although the sign is spectacular, it is disappointingly absent in many cases where it seems it should be present.
Fluttering of the Anterior Mitral Leaflet
Fluttering of the anterior mitral leaflet is an older (M-mode) sign that adds little, if anything, to the standard assessment of AI. The more the AI jet impacts the anterior mitral leaflet, the more likely the anterior leaflet is to vibrate (flutter), but some severe AI jets are directed toward the septum, not the anterior mitral leaflet. In addition, atrial fibrillation and especially atrial flutter, will reproduce this sign in the absence of AI.27
Utility of Transesophageal Echocardiography in Aortic Insufficiency
For routine AI, TEE offers little to the assessment. TEE is able to resolve the mechanism of AI28 and probably the disease causing AI in most cases where these issues are not apparent on TTE. There is no significant difference in the detection of AI by TTE and TEE: there is 80% concordance; and most differences are of one grade, with only 3% differing by two grades.29
Summary
 Echocardiography is useful to identify AI and to establish its cause, its severity, and the reparability of the valve.
 Multiple diagnostic criteria should be used, with emphasis on the more robust ones.

 In addition to identifying severity, echocardiography can garner some indices of surgical timing.


