The aim of this study was to investigate the annual incidence of atrial fibrillation (AF) and related factors from health surveys in 2006 and 2007. Participants (aged ≥40 years) were examined from annual health surveys provided by the Kurashiki Public Health Center twice, in 2006 and 2007. Participants were classified into 2 groups: a control group without AF in 2006 and 2007, and an AF group with documented AF in 2007 but not in 2006. Annual AF incidence (per 1,000 patient-years) was calculated, and baseline characteristics were compared between groups. Independent factors for new documented AF were analyzed using multivariate logistic regression modeling. Health surveys were performed for 30,449 participants in 2006 and 2007. Excluding 439 participants with AF in 2006, newly documented AF was observed in 278 participants (0.9%), while the control group comprised 29,732 participants. The overall incidence of newly documented AF was 9.3/1,000 patient-years. Newly documented AF was significantly associated with age ≥80 years (odds ratio [OR] 1.57, 95% confidence interval [CI] 1.20 to 2.06, p = 0.001), history of cardiac disease (OR 7.47, 95% CI 5.79 to 9.63, p <0.001), increasing estimated glomerular filtration rate of 10 ml/min/1.73 m 2 (OR 0.93, 95% CI 0.87 to 0.99, p = 0.025), and hypercholesterolemia (OR 0.75, 95% CI 0.58 to 0.96, p = 0.023).
In a Western study, factors for the incidence of newly documented atrial fibrillation (AF) were identified as age, hypertension, diabetes mellitus, congestive heart failure, and valve disease in men and women. Regarding Asian populations, we have previously reported that not only these factors but also decreasing estimated glomerular filtration rate (eGFR) was associated with the presence of AF. However, the annual incidence of AF in Asians and related factors have been unclear. Our aim was to investigate the annual incidence of AF and related factors on the basis of health surveys in Kurashiki, Japan.
Methods
The Kurashiki annual health survey provided by the Kurashiki Public Health Center is a prospective, population-based investigation of risk factors for the presence of AF in men and women aged ≥40 years, as described in our previous report. In Kurashiki, there were 471,131 residents for the 2006 survey. The Kurashiki Public Health Center did not send this notification of the survey to employees of private companies, offices, government, and factories, because the labor standards law stipulates that employers should survey the health conditions of their own employees. The Kurashiki Public Health Center thus sent official mail requests to 120,408 residents from May to December 2006 and to 121,813 residents from May to December 2007. Of these, 30,449 residents participated in health surveys in 2006 and 2007.
All participants answered questions on medical history (hypertension, diabetes mellitus, and hypercholesterolemia) and smoking status. Physical examinations, including blood pressure, electrocardiography, and blood testing (glycosylated hemoglobin, serum creatinine, and total cholesterol) were performed. Cardiovascular risk factors were identified as follows : (1) hypertension: use of antihypertensive agents, systolic blood pressure ≥140 mm Hg, or diastolic blood pressure ≥90 mm Hg on admission; (2) hypercholesterolemia: use of cholesterol-lowering agents or serum total cholesterol >220 mg/dl; (3) diabetes mellitus: use of oral hypoglycemic agents or insulin, fasting blood glucose level ≥126 mg/dl, random blood glucose level ≥200 mg/dl, or glycosylated hemoglobin level >6.1%; and (4) smoking: any lifetime experience of cigarette use. Cardiac disease included coronary heart disease and heart failure. Past and present illnesses were based on medical interviews of participants by physicians. The 3-component Modification of Diet in Renal Disease (MDRD) equation was used to calculate eGFR, incorporating age, gender, and serum creatinine level: eGFR = 194 × serum creatinine −1.094 × age −0.287 . For women, the product of this equation was multiplied by a correction factor of 0.739. A 12-lead electrocardiogram at rest was recorded in each subject to assess the presence of AF, and then all electrocardiographic records classified as indicating AF were reviewed by a physician.
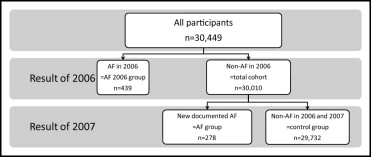
Regarding all 30,449 participants receiving health surveys in 2006 and 2007, participants with AF in 2006 was categorized as the AF-2006 group ( Figure 1 ). The total cohort for the present study was considered to comprise participants with AF not recorded in 2006. The total cohort was then divided into 2 groups in accordance with the results of the 2007 survey, with an AF group comprising participants with AF in 2007 only and a control group comprising participants without AF in either 2006 or 2007. Data from the 2006 health survey were used as baseline data. All data from participants were registered into the database of the Kurashiki Public Health Center. Personal information identifying subjects was blinded. The protocol for the present investigation was approved by the committee of Kawasaki Medical School and was in accordance with the Declaration of Helsinki.

First, the annual incidence of newly documented AF in the total cohort was calculated. Second, to identify factors associated with newly documented AF, baseline and demographic data were compared between control and AF groups using Fisher’s exact test and the Mann-Whitney U test, as appropriate. Then, to estimate independent factors associated with newly documented AF, a multivariate logistic regression analysis model was constructed for variables showing values of p <0.10 on univariate analysis. All statistical analyses were performed using PASW Statistics version 18.0 (SPSS, Inc., Chicago, Illinois). Results were considered significant for p values <0.05.
Results
The health survey was performed in 2006 and 2007 for 30,449 participants, with 439 participants categorized in the AF-2006 group. Table 1 lists baseline data for the remaining 30,010 participants in the total cohort (AF group plus control group; median age 73 years, range 66 to 78; 9,874 men). The control group comprised 29,732 participants (97.6%), and the AF group comprised 278 participants (0.9%). The overall annual incidence of AF was 9.3/1,000 patient-years. Men and older participants were frequently seen in the AF group. In particular, the AF group included a significantly higher proportion of elderly participants (aged ≥80 years) than the control group (39.2% vs 20.4%, respectively, p <0.001).
| Variable | Total Cohort (n = 30,010) | AF Group (n = 278) | Control Group (n = 29,732) | p Value |
|---|---|---|---|---|
| Men | 9,874 (32.9%) | 129 (46.4%) | 9,745 (32.8%) | <0.001 |
| Age (years) | 73 (66–78) | 77 (73–82) | 73 (66–78) | <0.001 |
| Age ≥80 years | 6,171 (20.6%) | 109 (39.2%) | 6,062 (20.4%) | <0.001 |
| History | ||||
| Hypertension | 14,036 (46.8%) | 146 (52.5%) | 13,890 (46.7%) | 0.061 |
| Diabetes mellitus | 3,738 (12.5%) | 44 (15.8%) | 3,694 (12.4%) | 0.096 |
| Hypercholesterolemia | 15,933 (53.1%) | 114 (41.0%) | 15,819 (53.2%) | <0.001 |
| Smoking | 2,139 (7.1%) | 19 (6.8%) | 2,120 (7.1%) | 0.987 |
| Cardiac disease | 2,445 (8.1%) | 122 (43.9%) | 2,323 (7.8%) | <0.001 |
| Height (m) | 1.53 (1.47–1.60) | 1.54 (1.47–1.63) | 1.53 (1.48–1.60) | 0.151 |
| Weight (kg) | 54 (47–61) | 55 (48–63) | 54 (48–61) | 0.238 |
| Body mass index (kg/m 2 ) | 22.8 (20.7–24.9) | 22.9 (20.8–24.9) | 22.7 (20.7–24.9) | 0.531 |
| Systolic blood pressure (mm Hg) | 132 (120–144) | 134 (121–144) | 132 (120–144) | 0.474 |
| Diastolic blood pressure (mm Hg) | 75 (68–81) | 76 (66–82) | 75 (68–81) | 0.970 |
| Laboratory data | ||||
| Total cholesterol (mg/dl) | 207 (185–230) | 194 (172–220) | 208 (185–230) | <0.001 |
| Creatinine (mg/dl) | 0.7 (0.6–0.8) | 0.8 (0.7–0.9) | 0.7 (0.6–0.8) | <0.001 |
| eGFR (ml/min/1.73 m 2 ) | 84.7 (69.4–100.5) | 71.0 (60.0–89.4) | 84.7 (69.5–100.6) | <0.001 |
| eGFR ≤60 ml/min/1.73 m 2 | 3,851 (12.8%) | 72 (25.9%) | 3,779 (12.7%) | <0.001 |
| Glycosylated hemoglobin (%) | 5.2 (4.9–5.5) | 5.2 (5.0–5.5) | 5.2 (4.9–5.5) | 0.167 |
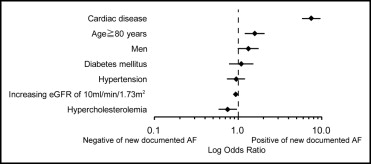
Multivariate regression modeling for factors independently associated with AF was performed. Because total cholesterol was a confounding factor in the history of hypercholesterolemia, we excluded this factor from analysis. A forest plot was constructed summarizing independent correlates to AF adjusted for age ≥80 years, hypertension, diabetes mellitus, hypercholesterolemia, cardiac disease, and increasing eGFR of 10 ml/min/1.73 m 2 ( Figure 2 ). AF was significantly associated with age ≥80 years (odds ratio [OR] 1.57, 95% confidence interval [CI] 1.20 to 2.06, p = 0.001) and cardiac disease (OR 7.47, 95% CI 5.79 to 9.63, p <0.001). Hypercholesterolemia (OR 0.75, 95% CI 0.58 to 0.96, p = 0.023), and increasing eGFR of 10 ml/min/1.73 m 2 (OR 0.93, 95% CI 0.87 to 0.99, p = 0.025) were inversely associated with AF.

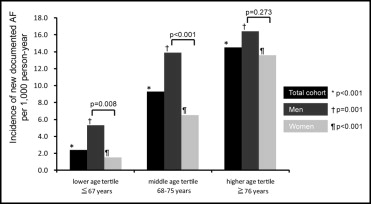
After categorizing all participants into 3 age tertiles with thresholds of 67 and 76 years, we estimated disparities in AF between men and women ( Figure 3 ). The incidence rate of AF for the total cohort was 2.4/1,000 patient-years in the lower age tertile (≤67 years), 9.3 in the middle tertile (68 to 75 years), and 14.5 in the higher tertile (≥76 years). Concerning gender, AF incidence was 5.3/1,000 patient-years for men and 1.5 for women in the lower age tertile (p = 0.008), 13.9 for men and 6.5 for women in the middle tertile (p <0.001), and 16.4 for men and 13.6 for women in the higher tertile (p = 0.273). AF incidence was higher in men than in women in the lower and middle age groups, but no difference by gender was seen for the higher age group. Consequently, the incidence of AF gradually elevated for the total cohort, men, and women in accordance with increasing age (total cohort p <0.001, men p = 0.001, and women p <0.001).

Table 2 lists the clinical background in comparison to AF and control groups in each age tertile. We conducted a multivariate regression analysis for factors independently associated with AF ( Figure 4 ). Cardiac disease was independently associated with the AF in the lower age tertile (OR 25.93, 95% CI 10.45 to 64.38, p <0.001), middle age tertile (OR 7.33, 95% CI 4.81 to 11.19, p <0.001), and higher age tertile (OR 5.74, 95% CI 4.17 to 7.92, p <0.001). However, hypercholesterolemia in the higher age tertile (OR 0.67, 95%CI 0.48 to 0.93, p = 0.017) and increasing eGFR of 10 ml/min/1.73 m 2 in the middle age tertile (OR 0.86, 95% CI 0.76 to 0.96, p = 0.011) were inversely associated with the AF.
| Variable | Lower Age Tertile (≤67 Years) | Middle Age Tertile (68–75 Years) | Higher Age Tertile (≥76 Years) | ||||||
|---|---|---|---|---|---|---|---|---|---|
| AF Group (n = 21) | Control Group (n = 8,607) | p Value | AF Group (n = 99) | Control Group (n = 10,436) | p Value | AF Group (n = 158) | Control Group (n = 10,689) | p Value | |
| Men | 11 (52.4%) | 2,056 (23.9%) | 0.008 | 57 (57.6%) | 4,021 (38.5%) | <0.001 | 61 (38.6%) | 3,668 (34.3%) | 0.273 |
| History | |||||||||
| Hypertension | 5 (23.8%) | 2,634 (30.6%) | 0.638 | 56 (56.6%) | 5,079 (48.7%) | 0.061 | 85 (53.8%) | 6,177 (57.8%) | 0.331 |
| Diabetes mellitus | 3 (14.3%) | 708 (8.2%) | 0.247 | 17 (17.2%) | 1,410 (13.5%) | 0.3 | 24 (15.2%) | 1,576 (14.7%) | 0.832 |
| Hypercholesterolemia | 14 (66.7%) | 5,228 (60.7%) | 0.659 | 43 (43.4%) | 5,679 (54.4%) | 0.033 | 57 (36.1%) | 4,912 (46.0%) | 0.016 |
| Smoking | 3 (14.3%) | 701 (8.1%) | 0.243 | 6 (6.1%) | 789 (7.6%) | 0.704 | 10 (6.3%) | 630 (5.9%) | 0.735 |
| Cardiac disease | 9 (42.9%) | 194 (2.3%) | <0.001 | 38 (38.4%) | 697 (6.7%) | <0.001 | 75 (47.5%) | 1,432 (13.4%) | <0.001 |
| Height (m) | 1.61 (1.54–1.71) | 1.56 (1.51–1.61) | 0.014 | 1.57 (1.51–1.64) | 1.54 (1.49–1.61) | 0.004 | 1.51 (1.44–1.61) | 1.50 (1.44–1.58) | 0.183 |
| Weight (kg) | 59.8 (54.8–67.8) | 54.9 (49.4–61.8) | 0.024 | 58.4 (50.8–65.8) | 55.5 (49.2–62.5) | 0.011 | 52.1 (45.0–58.0) | 51.0 (44.0–58.0) | 0.326 |
| Body mass index (kg/m 2 ) | 23.3 (21.9–24.8) | 22.6 (20.7–24.8) | 0.291 | 23.5 (21.4–25.6) | 23.2 (21.2–25.2) | 0.311 | 22.4 (20.4–24.7) | 22.4 (20.1–24.6) | 0.821 |
| Systolic blood pressure (mm Hg) | 134 (118–148) | 128 (116–140) | 0.162 | 138 (122–146) | 134 (122–144) | 0.56 | 132 (120–142) | 136 (124–146) | 0.051 |
| Diastolic blood pressure (mm Hg) | 80 (69–87) | 76 (68–83) | 0.173 | 78 (69–84) | 76 (70–82) | 0.517 | 74 (66–80) | 73 (66–80) | 0.917 |
| Laboratory data | |||||||||
| Total cholesterol (mg/dl) | 224 (202–249) | 215 (194–238) | 0.238 | 200 (179–223) | 208 (187–230) | 0.02 | 187 (167–211) | 200 (178–222) | <0.001 |
| Creatinine (mg/dl) | 0.8 (0.7–0.9) | 0.7 (0.6–0.8) | 0.027 | 0.8 (0.7–1.0) | 0.7 (0.6–0.9) | <0.001 | 0.8 (0.7–1.0) | 0.8 (0.7–0.9) | 0.038 |
| eGFR (ml/min/1.73 m 2 ) | 85.3 (66.8–96.5) | 96.5 (82.1–110.0) | 0.015 | 70.0 (60.7–89.3) | 84.0 (70.1–98.9) | <0.001 | 71.1 (58.7–88.1) | 76.4 (62.1–91.8) | 0.027 |
| eGFR ≤60 ml/min/1.73 m 2 | 3 (14.3%) | 325 (3.8%) | 0.044 | 24 (24.2%) | 1,122 (10.8%) | <0.001 | 45 (28.5%) | 2,332 (21.8%) | 0.049 |
| Glycosylated hemoglobin (%) | 5.2 (4.9–5.5) | 5.2 (4.9–5.4) | 0.792 | 5.3 (5.0–5.6) | 5.2 (5.0–5.5) | 0.308 | 5.2 (4.9–5.5) | 5.2 (4.9–5.5) | 0.588 |
Stay updated, free articles. Join our Telegram channel

Full access? Get Clinical Tree


