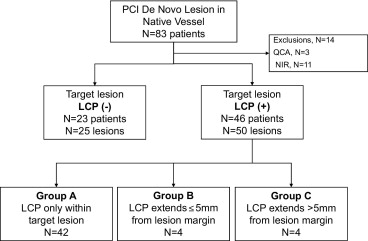
Lipid core plaque (LCP) can extend beyond the angiographic margins of a target lesion, potentially resulting in incomplete lesion coverage. We sought to compare the target lesion length using near-infrared spectroscopy (NIRS) combined with conventional coronary angiography versus angiography alone. NIRS was performed in 69 patients (75 lesions) undergoing native vessel percutaneous coronary intervention (LipiScan Coronary Imaging System). Chemograms were analyzed for the presence and location of LCP, either within or extending beyond, the angiographic margins of the target lesion. The target lesion length was measured by quantitative coronary angiography (QCA) and compared to the lesion length measured using QCA and NIRS. LCP was present in 50 target lesions (67%). In 42 lesions (84%), LCP was present only within the target lesion. In 8 lesions (16%) LCP extended beyond the angiographic margins of the lesion. Of these 8 lesions, 4 (8%) had LCP ≤5 mm from the margins, and 4 lesions (8%) had LCP >5 mm from the angiographic margins. The mean distance that the LCP extended beyond the angiographic lesion margin was 7 ± 4 mm (range 2 to 14). For these 8 lesions, the target lesion length with NIRS plus QCA was 28 ± 10 mm versus 21 ± 8 mm with QCA alone. In conclusion, patients undergoing coronary artery stenting could have LCP extending beyond the intended treatment margins as defined using QCA alone. This could have implications for stent length selection and optimal lesion coverage.
Although several techniques can be used to evaluate target lesion length, in clinical practice, visual assessment of the coronary angiogram is used most often to determine the lesion margins and appropriate stent length. Recently, an intracoronary catheter (LipiScan Coronary Imaging System, InfraReDx, Inc., Burlington, Massachusetts) that uses near-infrared spectroscopy (NIRS) has been developed to identify lipid core plaque (LCP) in coronary arteries. This novel device uses automated pullback to generate a longitudinal chemographic road map of the coronary artery to define the presence and location of LCP. During our initial experience with this system, we observed that LCP can extend beyond the angiographic margins of a target lesion, potentially resulting in “geographic miss” during stent implantation. Therefore, we sought to determine whether NIRS provides incremental information when evaluating lesion length compared to conventional coronary angiography alone.
Methods
We compared lesion length measured by angiography alone versus lesion length measured by angiography plus NIRS in 69 patients undergoing coronary stenting of a de novo native vessel lesion at our center from May 2008 to January 2010. All patients were enrolled in an institutional review board-approved registry of the LipiScan System. Patients with ST-segment elevation myocardial infarction, chronic total occlusion, in-stent restenosis, suboptimal angiographic images for quantitative angiographic analysis, or suboptimal NIRS chemograms were excluded ( Figure 1 ) . The hypothesis was that the target lesion length measured with angiography plus NIRS would not be different from the lesion length measured with angiography alone.
NIRS was performed with the LipiScan Coronary Imaging System (InfraReDx), which consists of a 3.2F, 0.014-in. guidewire-compatible, rapid-exchange coronary catheter, a pullback and rotation device, and a console. Using automated catheter pullback (0.5 mm/s), the system acquires approximately 1,000 NIRS measurements/12.5 mm of artery scanned. The NIRS algorithm, which has been extensively validated with histologic examination in a human coronary artery study, displays the probability of LCP within the artery on both a chemogram map and block chemogram, using a color scale from red (low probability) to yellow (high probability). The chemogram map indicates the longitudinal and circumferential position of LCP within a pullback, and the block chemogram provides a display of the probability that LCP is present for all NIRS measurements made in each 2-mm longitudinal block of the pullback.
Percutaneous coronary intervention (PCI) was performed using 6F or 7F guiding catheters and standard interventional equipment. NIRS was performed with the LipiScan catheter, either before PCI or after predilation with an undersized balloon, depending on lesion severity. Before the pullback run, the operator carefully placed several “bookmarks” on the chemogram map, corresponding with anatomic landmarks such as the lesion margins or significant side branches, by sliding the position of the optical tip within the catheter and confirming the landmarks with contrast injection. The optical tip was then advanced to the distal catheter tip before pullback initiation. The placement of these bookmarks was critical to co-register the chemographic data with the coronary angiographic findings. The NIRS data were available to the operator at the procedure. Stenting was then performed with bare or drug-eluting stents (DESs) at the discretion of the operator. All patients were treated with aspirin and clopidogrel.
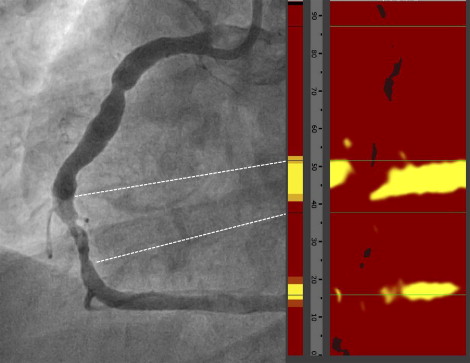
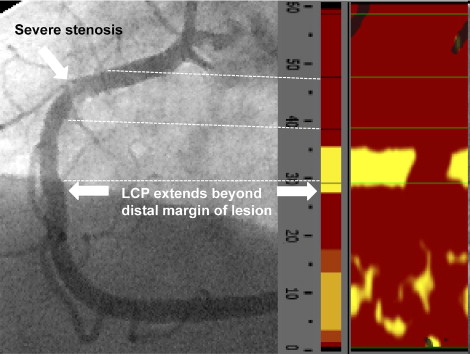
A LCP-positive lesion was defined as the presence of a single yellow 2-mm block on the block chemogram. Nonyellow blocks were considered non-LCP lesions. The coronary angiograms and chemograms were evaluated by 2 observers. The presence of LCP at the target lesion was analyzed by examining the 2-mm blocks of the block chemogram corresponding to the angiographic lesion as co-registered by the anatomic “bookmarks” placed on the initial chemogram road map ( Figure 2 ). Quantitative coronary angiography (QCA) was performed to determine the angiographic lesion length (Medis Medical Imaging Systems, Leiden, The Netherlands). The lesion length was measured as the distance (in millimeters) from the proximal to the distal shoulder of the lesion in the projection that demonstrated the lesion with the least foreshortening. In LCP-positive lesions, the location of LCP on the block chemogram was examined in relation to the angiographic margins of the target lesion, and classified into 3 groups: (A) LCP present only within the angiographic margins of the lesion, (B) LCP extending ≤5 mm beyond the proximal or distal lesion margin, and (C) LCP present >5 mm beyond the proximal or distal lesion margins by angiography ( Figures 3 to 6 ).