Mortality after transcatheter aortic valve implantation (TAVI) has been reported to range up to 3 years. However, long-term mortality remains underexplored. The aims of this study were to determine long-term mortality in patients who undergo TAVI and to identify correlates of long-term death. From a single institution’s prospectively collected TAVI database, all patients who underwent TAVI with a maximum follow–up duration of 5 years were analyzed. The population was analyzed on the basis of access route (transapical TAVI or transfemoral TAVI). Cox regression and Kaplan-Meier survival analysis were conducted. A total of 511 patients who underwent TAVI were included in the analysis (transapical TAVI n = 115, transfemoral TAVI n = 396). The mean Society of Thoracic Surgeons score was 9.6 ± 4. Mortality at 30 days (18% vs 6%, p <0.001) and 1 year (32% vs 21%, p <0.01) was significantly increased in the transapical TAVI group. Long-term survival probability was <50% for the 2 approaches (log-rank p = 0.33). Vascular complications (hazard ratio [HR] 2.14, 95% confidence interval [CI] 1.38 to 3.33, p = 0.001), more than mild aortic insufficiency (HR 1.81, 95% CI 1.15 to 2.83, p = 0.01), atrial fibrillation (HR 1.87, 95% CI 1.36 to 2.57, p <0.001), and in-hospital stroke (HR 2.35, 95% CI 1.39 to 4.00, p = 0.002) were independently associated with long-term death. The survival probability of patients at high surgical risk versus those who were inoperable was similar in the long term (log-rank p = 0.53). In conclusion, the overall long-term survival of patients with aortic stenosis who were approved to undergo TAVI was <50% irrespective of access method. Strategies geared toward reducing in-hospital stroke, vascular complications, and aortic regurgitation are still needed, as these variables are correlates of long-term mortality.
Transcatheter aortic valve implantation (TAVI) is currently the standard of care for patients unable to undergo surgical aortic valve replacement. Recently, the CoreValve pivotal trial revealed that TAVI might be a superior option to surgical aortic valve replacement. TAVI was associated with lower rates of all-cause mortality at 1 year in the as-treated and the intention-to-treat analyses (14.2% vs 19.1%, p = 0.04, and 13.9% vs 18.7%, p = 0.04, respectively). A substantial body of data now exists in relation to the early clinical outcomes after TAVI, but there are few published data on outcomes beyond 24 months. Since the first reported implantation, numerous publications have explored the outcomes of patients after TAVI, primarily in terms of short-term and midterm complications and survival. The long-term durability of transcatheter valves and long-term survival in patients who undergo TAVI have been not thoroughly explored, and they have been reported in a small number of patients outside the United States. Therefore, the aim of this study was to evaluate the long-term survival and to identify correlates of long-term mortality in patients who underwent TAVI in the United States, from a large-volume center.
Methods
From May 2007 to June 2014, 511 consecutive patients with severe symptomatic aortic stenosis who underwent TAVI through the transfemoral (TF) (n = 396) and transapical (TA) (n = 115) access routes were included in this retrospective analysis. All patients were evaluated according to protocol by our institution’s multidisciplinary heart team, composed of interventional cardiologists, general cardiologists, and cardiac surgeons, who determined the eligibility of each individual patient. Although protocols and device availability evolved over time, all patients were classified as high-risk or inoperable on the basis of contemporary risk assessment at the time of screening. Surgical risk was determined by 2 expert cardiovascular surgeons and discussed at the heart team meeting. Inoperability and high surgical risk assessment considered technical (porcelain aorta, hostile chest, and so on) and clinical (frailty, severe liver disease, Society of Thoracic Surgeons [STS] risk score, and so on) risk factors.
The pre-TAVI evaluation was performed with coronary angiography to detect significant coronary stenosis, contrast computed tomography with standard postprocessing reconstructions for aortoiliac sizing evaluation, and transthoracic echocardiography. All procedures were performed under conscious sedation or general anesthesia provided by a cardiac anesthesiologist in our hybrid catheterization laboratory. The femoral artery was accessed percutaneously or by surgical cut-down. In the first case, the arteriotomy site was closed with either a Prostar XL device (Abbott Vascular, Redwood City, California) or 2 Perclose ProGlide 6Fr suture devices (Abbott Vascular). After successful TAVI, antiplatelet therapy consisted of clopidogrel 75 mg and aspirin 81 mg for 3 to 6 months. Demographic, clinical, imaging, and follow-up data were prospectively collected and entered into a registry by an independent cardiologist from the MedStar Cardiovascular Research Network at MedStar Washington Hospital Center, located in Washington, District of Columbia. Deaths were confirmed by accessing the Social Security Death Index database, through careful inspection of death certificates, and by contacting patients at defined time intervals. The population was analyzed on the basis of access route. All definitions of clinical end points used (in-hospital death, 30-day and 1-year all-cause mortality, stroke, vascular complications, bleeding complications, acute kidney injury, and so on) were in concordance with the Valve Academic Research Consortium 2 (VARC-2) definitions. Aortic regurgitation after TAVI, pacemaker implantation, and new-onset postoperative atrial fibrillation (AF) were also collected prospectively during the index hospitalization.
This study complied with the principles of the Declaration of Helsinki regarding investigation in humans and was approved by the institutional review board of MedStar Washington Hospital Center. Statistical analyses were performed using SAS version 9.2 (SAS Institute Inc., Cary, North Carolina). Continuous variables are expressed as mean ± SD for normally distributed variables. Categorical variables are expressed as percentages. Analyses of the differences between the 2 groups were performed using chi-square or Fisher’s exact tests for categorical variables. Cox proportional hazards regression analysis was performed to detect predictors of long-term all-cause mortality. Variables were selected on the basis of overall clinical relevance. Variables included were gender, age, diabetes mellitus, hypertension, history of AF, the left ventricular ejection fraction, previous coronary artery bypass surgery, chronic obstructive pulmonary disease (COPD), chronic kidney disease (CKD), STS score, history of cerebrovascular accident or transient ischemic attack, TF access, history of cancer, postoperative new-onset AF, post-TAVI pacemaker implantation, mild aortic regurgitation after TAVI, more than mild aortic regurgitation after TAVI, VARC-2 vascular complications, VARC-2 bleeding complications, and in-hospital stroke. After univariate analysis, variables with p values <0.10 were incorporated into the multivariate analysis. The results are presented as adjusted hazard ratios (HRs) with their 95% confidence intervals (CIs) and p values. Death-free survival rates of the overall population and in selected subgroups were calculated using the Kaplan-Meier method. The log-rank test was used to compare the differences in curves among groups. A p value of <0.05 was considered to indicate statistical significance.
Results
A total of 511 patients were included. Of the 511 patients, 115 (23%) underwent TA TAVI and 396 (77%) underwent TF TAVI. The average age of the entire population was 83 ± 2 years. Patients who underwent TA TAVI were older than those who underwent TF TAVI (84 ± 2 vs 82 ± 8 years, p = 0.05); although this difference did not reach statistical significance, an important trend was noted. There were no disparities in race between the 2 groups, with most patients identifying themselves as of Caucasian background, 87% in the TA TAVI group and 82% in the TF TAVI group (p = 0.21). Patients in the TA TAVI group had a higher prevalence of history of cerebrovascular accident or transient ischemic attack (24% vs 15%, p = 0.01), peripheral arterial disease (56% vs 29%, p <0.001), and higher mean STS scores (10.9 ± 4.5 vs 9.2 ± 4.4, p <0.001). The prevalence of co-morbid conditions was statistically similar between groups. The patients’ baseline characteristics and pre- and postprocedural echocardiographic assessments are listed in Table 1 .
| Variable | TA (n=115) | TF (n=396) | p value |
|---|---|---|---|
| Age (years ± SD) | 84 ± 6 | 82 ± 8 | 0.05 |
| Men | 54 (47%) | 202 (51%) | 0.44 |
| African American | 10 (9%) | 286 (82%) | 0.21 |
| Mean Society of Thoracic Surgeons score | 10.9 ± 4.5 | 9.2 ± 4.4 | <0.001 |
| Chronic obstructive lung disease | 39 (34%) | 115 (30%) | 0.39 |
| Hypertension | 106 (94%) | 351 (92%) | 0.50 |
| Diabetes mellitus | 32 (28%) | 131 (34%) | 0.23 |
| Hyperlipidemia | 86 (77%) | 299 (79%) | 0.64 |
| Peripheral arterial disease | 62 (56%) | 106 (28%) | <0.001 |
| Previous coronary artery bypass surgery | 41 (36%) | 123 (32%) | 0.43 |
| Atrial fibrillation/atrial flutter | 46 (41%) | 159 (42%) | 0.85 |
| Prior myocardial infarction | 19 (17%) | 74 (19%) | 0.53 |
| Chronic kidney disease | 57 (51%) | 195 (52%) | 0.84 |
| Permanent Pacemaker | 24 (24%) | 60 (21%) | 0.52 |
| Prior CVA/TIA | 27 (23%) | 53 (14%) | 0.01 |
| Prior Cancer | 19 (20%) | 52 (20%) | 0.25 |
| Pre-procedural echocardiogram | |||
| Mean left ventricular ejection fraction (%) | 51 ± 13 | 52 ± 13 | 0.55 |
| Left ventricular ejection fraction <40% | 31 (27%) | 83 (27%) | 0.20 |
| Mean aortic gradient (mm Hg) (± SD) | 48 ± 13 | 47 ± 12 | 0.20 |
| Mean aortic valve area (cm 2 ) (± SD) | 0.65 ± 0.1 | 0.66 ± 0.1 | 0.25 |
| Mean peak aortic velocity (m/s) (± SD) | 4.4 ± 0.5 | 4.3 ± 0.5 | 0.35 |
| Mean pulmonary artery systolic pressure (± SD) | 45 ± 15 | 46 ± 16 | 0.31 |
In the preprocedural echocardiographic assessment, the mean transaortic gradients were 48 ± 13 and 47 ± 12 mm Hg (p = 0.20), average peak aortic velocities were 4.4 ± 0.5 and 4.3 ± 0.5 m/s (p = 0.35), and average aortic valve areas were 0.65 ± 0.1 and 0.66 ± 0.1 cm 2 (p = 0.25) for patients in the TA TAVI and TF TAVI groups, respectively. Left ventricular function was similar in the 2 groups (51 ± 13% in the TA TAVI group vs 52 ± 13% in the TF TAVI group, p = 0.55). The prevalence of significant left ventricular dysfunction (ejection fraction <40%) was comparable in the 2 groups (27% vs 21%, p = 0.20).
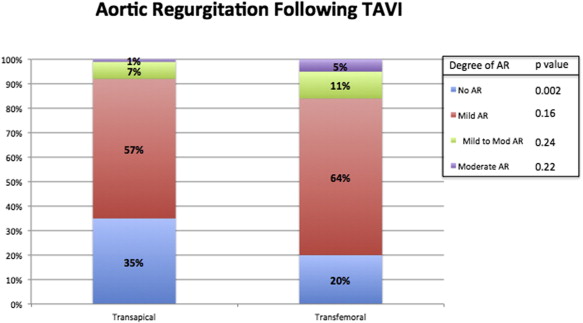
In-hospital outcomes are listed in Table 2 . In-hospital mortality due to all-cause death and cardiac death was significantly higher in patients who underwent TA TAVI compared with TF TAVI (all-cause death 19% vs 4%, p <0.001, and cardiac death 12% vs 1.8%, p <0.001). New-onset postoperative AF was significantly increased in the TA TAVI group compared with TF TAVI patients (31% vs 9%, p <0.001). A strong trend toward higher pacemaker implantation after TAVI was found in the TF TAVI group compared with the TA TAVI group (8% vs 4%, p = 0.07). Despite these differences in tachyarrhythmias and bradyarrhythmias, the survival probability of patients with and without pacemaker implantation (log-rank p = 0.17) and with and without new-onset postoperative AF (log-rank p = 0.35) was statistically similar ( Figure 1 ). The 2 variables were not independent predictors of long-term mortality at the univariate level (postoperative AF: HR 1.18, 95% CI 0.81 to 1.72, p = 0.37; pacemaker implantation after TAVI: HR 1.47, 95% CI 0.85 to 2.54, p = 0.16) and therefore were not included in the multivariate model. VARC-2 minor bleeding complications were higher in the TF TAVI group (17% vs 4.5%, p <0.001), but the rate of VARC-2 life-threatening bleeding events was higher in the TA TAVI group (15% vs 6.3%, p = 0.003). Bleeding overall was not a correlate of long-term mortality at the univariate level (HR 0.85, 95% CI 0.57 to 1.26, p = 0.42). VARC-2 vascular complications occurred predominantly in the TF TAVI group ( Table 2 ). The rate of postimplantation pleural effusion was increased in the TA TAVI group (23% vs 4%, p <0.001). The rates of mild to moderate and moderate aortic regurgitation were low and not statistically significant between the TA TAVI and TF TAVI groups. More than half of patients included in the 2 groups had mild aortic regurgitation after implantation (57% in the TA TAVI group vs 64% in the TF TAVI group, p = 0.16). Figure 2 shows the proportions of aortic regurgitation after TAVI in the 2 groups. Postprocedural length of stay and intensive care unit length of stay were significantly longer in the TA TAVI group (p <0.001 for the 2 comparisons). Thirty-day and 1-year all-cause mortality was significantly increased in the TA TAVI group (18% vs 6%, p <0.001, and 32% vs 21%, p = 0.013; Figure 3 ). However, the survival probability at 5 years was similar between the TA TAVI and TF TAVI groups (log-rank p = 0.33; Figure 4 ). The 5-year mortality of patients deemed at high risk and inoperable was also similar (log-rank p = 0.53; Figure 5 ).
| Variable | TA (n=115) | TF (n=396) | p value |
|---|---|---|---|
| Implanted Valve Sizes | |||
| 23 mm | 59 (52%) | 194 (20%) | 0.45 |
| 26 mm | 53 (46%) | 144 (48%) | 0.03 |
| 29 mm | 1 (0.9%) | 47 (11%) | <0.001 |
| 31 mm | 0 (0%) | 17 (4%) | 0.03 |
| In-Hospital Outcomes | |||
| In-hospital all-cause death | 22 (19%) | 17 (4%) | <0.001 |
| In-hospital cardiac death | 14 (12%) | 7 (1.8%) | <0.001 |
| Ischemic stroke | 5 (4.5%) | 20 (5%) | 0.80 |
| All Stroke | 5 (4.5%) | 21 (5%) | 0.72 |
| New onset AF post TAVI | 34 (31%) | 37 (9%) | <0.001 |
| Pacemaker Implantation post TAVI | 4 (4%) | 34 (8%) | 0.07 |
| VARC-2 minor bleed | 5 (4.5%) | 68 (17%) | <0.001 |
| VARC-2 major bleed | 0 (0%) | 6 (1.5%) | 0.34 |
| VARC-2 life threatening bleed | 17 (15%) | 25 (6.3%) | 0.003 |
| VARC-2 AKI 1 | 7 (7%) | 14 (4%) | 0.27 |
| VARC-2 AKI 2 | 25 (25%) | 26 (7%) | <0.001 |
| VARC-2 AKI 3 | 4 (4%) | 12 (3%) | 0.76 |
| VARC-2 minor vascular complication | 0 (0%) | 88 (22%) | <0.001 |
| VARC-2 major vascular complication | 5 (4.5%) | 38 (9.6%) | 0.085 |
| Pleural effusion | 26 (23%) | 17 (4%) | <0.001 |
| Length of Stay | |||
| ICU length of stay (days) | 5.4 ± 7.8 | 2.3 ± 2.8 | <0.001 |
| Post procedure length of stay (days) | 10.2 ± 10.1 | 6.5 ± 5.2 | <0.001 |

Stay updated, free articles. Join our Telegram channel

Full access? Get Clinical Tree


