Myocardial extracellular matrix expansion and reduced coronary flow reserve (CFR) occur in patients with type 2 diabetes mellitus without heart failure or coronary artery disease. Because aldosterone is implicated in the pathophysiology of cardiac fibrosis and vascular injury, the aim of this study was to test the hypothesis that aldosterone is associated with extracellular matrix expansion and reduced CFR in type 2 diabetes mellitus. Patients with type 2 diabetes mellitus without evidence of coronary artery disease were recruited. Blood pressure, lipid management, and glycemic control were optimized over 3 months. Cardiac magnetic resonance imaging with T1 mapping was used to measure myocardial extracellular volume (ECV). Cardiac positron emission tomography was used to assess CFR. On a liberal, 250 mEq/day sodium diet, 24-hour urinary aldosterone and change in serum aldosterone with angiotensin II stimulation were measured. Fifty-three participants with type 2 diabetes (68% men, mean age 53 ± 7 years, mean body mass index 32.2 ± 4.3 kg/m 2 , mean glycosylated hemoglobin 6.8 ± 0.7%, mean systolic blood pressure 126 ± 14 mm Hg) without infarction or ischemia by cardiac magnetic resonance and positron emission tomography were studied. Subjects had impaired CFR (2.51 ± 0.83) and elevated ECV (0.36 ± 0.05), despite normal echocardiographic diastolic function and normal left ventricular function. Myocardial ECV, but not CFR, was positively associated with 24-hour urinary aldosterone excretion (r = 0.37, p = 0.01) and angiotensin II–stimulated aldosterone increase (r = 0.35, p = 0.02). In a best-overall multivariate model (including age, gender, body mass index, glycosylated hemoglobin, and blood pressure), 24-hour urinary aldosterone was the strongest predictor of myocardial ECV (p = 0.004). In conclusion, in patients with type 2 diabetes mellitus without coronary artery disease, aldosterone is associated with myocardial extracellular matrix expansion. These results implicate aldosterone in early myocardial remodeling in type 2 diabetes mellitus.
Diabetic cardiomyopathy occurs even in the absence of coronary artery disease (CAD) and is a significant contributor to increased morbidity and mortality in patients with type 2 diabetes mellitus (T2DM). Before the onset of symptomatic angina or myocardial infarction, patients with T2DM have subtle changes in cardiac structure and function, including impaired myocardial blood flow and expansion of the cardiac extracellular matrix. These abnormalities are independent of traditional cardiovascular risk factors and may contribute to cardiac dysfunction. Aldosterone and the mineralocorticoid receptor play a key role in the pathogenesis of vascular injury and cardiac fibrosis. T2DM is associated with elevated aldosterone levels in some studies, and mineralocorticoid receptor blockade reduces renal injury in patients with T2DM. Furthermore, there is evidence that aldosterone blockade reduces biomarkers of collagen turnover and cardiovascular mortality in patients with heart failure. The impact of aldosterone on subclinical myocardial remodeling and microvascular dysfunction in patients with T2DM without CAD remains poorly characterized. Therefore, we tested the hypothesis that aldosterone levels correlate with myocardial matrix remodeling and microvascular dysfunction in men and women with T2DM.
Methods
This study is part of an ongoing clinical study, which enrolled men and women with T2DM, aged 18 to 70 years ( ClinicalTrials.gov identifier NCT00865124 ). Analyses were performed with data obtained before randomization to drug therapy in the first 53 subjects who showed no evidence of previous myocardial infarction and/or reversible ischemia on cardiac positron emission tomography and cardiac magnetic resonance and who were in balance on a liberal sodium diet (urinary sodium >150 mmol/24 hours). Exclusion criteria were clinical evidence of coronary, cerebrovascular, or peripheral vascular disease; asthma; estimated glomerular filtration rate <60 ml/min/1.73m 2 ; cigarette smoking; pregnancy; illicit drug use; contraindications to cardiac magnetic resonance or adenosine; uncontrolled hypertension (systolic blood pressure >160 mm Hg); and active major medical illness. The institutional review board at Brigham and Women’s Hospital (Boston, Massachusetts) approved the study protocol, and all study participants provided written informed consent.
Enrolled study participants were started on enalapril 20 mg/day and tapered off other antihypertensive medications. Amlodipine (5 to 10 mg/day) was added for systolic blood pressure ≥140 mm Hg. Simvastatin was added if low-density lipoprotein was >100 mg/dl at the screening visit. Diabetic medications were adjusted to target a glycosylated hemoglobin (HbA 1c ) level ≤7%.
Study participants were admitted to an inpatient unit after ≥3 months of angiotensin-converting enzyme inhibitor or angiotensin receptor blockade therapy with at least the final month being enalapril and 3 months of statin therapy (if applicable; Figure 1 ). For 4 days before admission and continuing through admission, participants consumed an isocaloric, caffeine-free, liberal sodium (250 Na + mmol/day) diet containing 100 mmol/day potassium, 1,000 mg/day calcium, 300 mg/day magnesium, and 30% carbohydrate by calories. Amlodipine was held 36 hours before admission. Oral hypoglycemic agents and insulin were held during fasting.
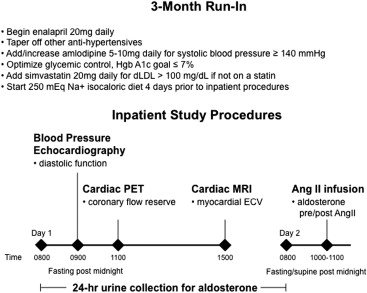
Urine was collected for 24 hours for aldosterone, creatinine, and sodium, after which morning blood samples were collected for serum aldosterone and plasma renin activity in subjects who had been supine and fasting since midnight. To assess the aldosterone response to a controlled stimulus, supine subjects were next infused with angiotensin II at 3 ng/kg/min with reassessment of serum aldosterone after 60 minutes. The infusion rate was reduced to 1 ng/kg/min if systolic blood pressure increased to >180 mm Hg or diastolic blood pressure increased to >100 mm Hg.
Focused transthoracic echocardiography (Vivid i, 3.6-MHz bandwidth, phased-array transducer; GE Healthcare, Schenectady, New York) was performed for analysis of left ventricular diastolic function. Pulse-wave Doppler interrogation of mitral valve inflow was used to determine early (E) and atrial (A) left ventricular filling velocities. Tissue Doppler myocardial velocities at the lateral mitral annulus were measured (e′ and a′).
Study participants were studied with a whole-body positron emission tomographic/computed tomographic scanner (Discovery RX or STE LightSpeed 64; GE Healthcare, Milwaukee, Wisconsin). Regional myocardial blood flow was measured at rest and during an intravenous infusion of adenosine (0.14 mg/kg/min) using nitrogen-13 ammonia as a flow tracer. A nongated, low-dose transmission computed tomographic scan was acquired for correction of photon attenuation. Beginning with the intravenous bolus administration of nitrogen-13 ammonia (20 mCi), serial images were acquired for 20 minutes, as previously described. After 30 minutes, intravenous adenosine was infused for 4 minutes. Two minutes into the adenosine infusion, a second dose of nitrogen-13 ammonia was injected, and images were recorded again in the same sequence. Heart rate, blood pressure, and a 12-lead electrocardiogram were recorded at baseline and every minute during and after the infusion of adenosine. Coronary flow reserve (CFR) was determined as the ratio of adenosine-stimulated myocardial blood flow to baseline myocardial blood flow corrected for the baseline pulse-pressure product. Study participants with abnormal findings on cardiac positron emission tomography consistent with CAD were excluded.
Cardiac magnetic resonance imaging was performed using a 3-T magnet (Magnetom Tim Trio or Verio; Siemens Healthcare, Erlangen, Germany) with an 8-element phased-array coil. The cardiac magnetic resonance protocol included localizers, cine function, late gadolinium enhancement imaging, and sequences for the assessment of myocardial extracellular volume (ECV). Electrocardiographically gated cine images were acquired in short-axis (contiguous 8-mm slices) and long-axis views of the left ventricle with a balanced steady-state free precession sequence (repetition time 3.4 ms, echo time 1.2 ms, matrix size 256 × 256, field of view 32 to 34 cm). After an injection of 0.15 mmol/kg intravenous gadolinium diethylenetriamine penta-acetic acid (Magnevist; Berlex Pharmaceuticals, Wayne, New Jersey), late gadolinium enhancement was performed using standard techniques. Left atrial volumes were measured when technically feasible using the biplane area-length method and indexed to body surface area using commercially available software (cmr42; Circle Cardiovascular Imaging Inc., Calgary, Alberta, Canada). Quantitation of left and right ventricular volumes, function, and mass were performed using QMASS version 9.3 (Medis Medical Imaging Systems, Leiden, The Netherlands).
Quantification of ECV was performed using standard techniques described by our laboratory. T1 measurements were performed with a breath-hold Look-Locker sequence, which is based on a spoiled gradient-echo cine sequence (without steady-state free precession), with temporal resolution of 117 ms for precontrast T1 measurements and 55 ms for postcontrast T1 measurements. Briefly, a non-slice-selective BIR-4 adiabatic inversion pulse is applied after the detection of an R wave, followed by a segmented gradient-echo acquisition for ≥17 cardiac phases (repetition time 5 ms, echo time 2.2 ms, flip angle 10°, slice thickness 8 mm, matrix size 192 × 100, field of view approximately 34 × 30–34 cm, number of signals acquired 1, iPAT factor 2). T1 measurements were made at 1 mid left ventricular slice. One precontrast acquisition was obtained, and 2 or 3 postcontrast acquisitions were acquired, with ≥5 minutes after contrast injection for the first postcontrast acquisition. Endocardial and epicardial contours were segmented, taking care to avoid blood pool. A region of interest was placed in the blood pool. The left ventricle was segmented into 6 sectors for analysis. Segmental T1 was derived by exponential fit of the inversion recovery. Segmental myocardial R1 (1/T1) was plotted against blood R1, and the slope of the linear fit defined the partition coefficient for gadolinium, λ Gd , for each segment. Myocardial ECV for each segment was calculated by multiplying λ Gd by (1 − hematocrit), and then the 6 myocardial segments were averaged for a final myocardial ECV.
Serum and urinary aldosterone were analyzed using the Siemens assay (Siemens, Los Angeles, California; intra-assay variation 2.3% to 5.4%, interassay variation 3.8% to 15.7%), and plasma renin activity was analyzed using the Diasorin assay (Diasorin, Inc., Stillwater, Minnesota; intra-assay variation 4.6% to 10%, inter-assay variation 5.6% to 7.6%). Blood levels of electrolytes, HbA 1c , and lipids and urine levels of sodium, creatinine, and microalbumin were assessed using routine clinical assays from the Laboratory Corporation of America (Raritan, New Jersey).
Baseline demographic, echocardiographic, cardiac magnetic resonance, and positron emission tomographic data are expressed as mean ± SD, except that medians and interquartile ranges are given for data that were not normally distributed. The primary end points for this analysis were the relation between 24-hour urinary aldosterone excretion and ECV as well as the relation between 24-hour urinary aldosterone excretion and CFR. Because CFR and ECV data were normally distributed, Pearson’s correlation coefficients were used to express the association between continuous covariates and ECV and CFR. We constructed a best-overall multivariate model (p <0.10 for model entry, p <0.05 for model retention) for predictors of myocardial ECV, including covariates reflecting cardiometabolic risk (age, body mass index, gender, systolic and diastolic blood pressure, and HbA 1c ), CFR, 24-hour urinary aldosterone excretion, and change in aldosterone with angiotensin II stimulation. All statistical analysis was performed with SAS version 9.3 (SAS Institute Inc., Cary, North Carolina) or JMP version 10.0 (SAS Institute Inc.).
Results
The study participants (68% men) included in the analysis had a mean age of 53 ± 7 years and a mean body mass index of 32.2 ± 4.34 kg/m 2 (see Table 1 for characteristics of the study population on the day of imaging procedures). The median duration of T2DM was 5 years, with 17% of study participants receiving insulin for glycemic control. Per the study protocol, all study participants were taking the angiotensin-converting enzyme inhibitor enalapril and had excellent glycemic, blood pressure, and lipid management per American Diabetes Association guidelines.
| Characteristic | Value |
|---|---|
| Age (yrs) | 53 ± 7 |
| Men | 36 (68%) |
| European American | 34 (64%) |
| African American | 15 (28%) |
| Other | 4 (8%) |
| Body mass index (kg/m 2 ) | 32.2 ± 4.34 |
| Blood pressure (mm Hg) | |
| Systolic | 126 ± 14 |
| Diastolic | 76 ± 9 |
| Duration of T2DM (yrs) | 5 (2–10) |
| Number of diabetic medications | |
| Diet controlled | 8 (15%) |
| Monotherapy | 19 (36%) |
| ≥2 | 26 (49%) |
| Antihypertensive medications | |
| Enalapril | 53 (100%) |
| Amlodipine | 13 (24%) |
| Statin use | 40 (75%) |
| Fasting laboratory data ∗ | |
| Blood glucose (mg/dl) | 110 ± 21 |
| Total cholesterol (mg/dl) | 148 ± 31 |
| Low-density lipoprotein cholesterol (mg/dl) | 81 ± 24 |
| High-density lipoprotein cholesterol (mg/dl) | 43 ± 11 |
| Triglycerides (mg/dl) | 124 ± 72 |
| Other laboratory data | |
| HbA 1c (%) | 6.8 ± 0.7 |
| Corrected creatinine clearance (ml/min/1.73 m 2 ) | 107 ± 21 |
| Serum thyrotropin (mIU/ml) | 1.50 ± 0.70 |
∗ Fasting laboratory data obtained on the day of imaging studies.
Twenty-four hour urinary sodium excretion was 279 ± 67 mmol/day, and median 24-hour urinary aldosterone excretion was 6.28 μg ( Table 2 ). Study participants with above-median compared with below-median 24-hour urinary aldosterone excretion had lower high-density lipoprotein cholesterol (38 ± 9 vs 48 ± 11 mg/dl, p = 0.0006) despite similar statin use, had higher creatinine clearance (115 ± 19 vs 98 ± 20 ml/min/1.73 m 2 , p = 0.003) and were more likely to require amlodipine for blood pressure control (41% vs 7%, p = 0.009). All other subject characteristics in Table 1 were similar in patients with above- versus below-median 24-hour urinary aldosterone excretion.
| Variable | Value |
|---|---|
| Before angiotensin II infusion | |
| Urinary aldosterone (μg/24 h) | 6.28 (3.32–9.48) |
| Urinary sodium (mmol/24 h) | 279 ± 67 |
| Urinary potassium (mmol/24 h) | 94 ± 20 |
| Urinary creatinine (mg/24 h) | 1,644 ± 398 |
| Serum aldosterone (ng/dl) | 2.49 (2.49–4.03) |
| Plasma renin activity (ng/ml/h) | 0.6 (0.1–2.3) |
| Serum potassium (mmol/L) | 4.2 ± 0.23 |
| Mean arterial pressure (mm Hg) | 95 ± 11 |
| After angiotensin II infusion | |
| Change in serum aldosterone (ng/dl) | 5.80 (3.35–8.83) |
| Change in mean arterial pressure (mm Hg) | 16 ± 7 |
The myocardial ECV in our diabetic population was 0.36 ± 0.05 ( Table 3 ), which is elevated compared with with published values of ECV in healthy subjects and with the mean ECV of 0.27 ± 0.03 (p <0.0001) obtained in our laboratory in 10 healthy, normotensive volunteers (mean age 54.8 ± 12.6 years, mean body mass index 28 ± 6 kg/m 2 , mean systolic blood pressure 123 ± 8.3 mm Hg). In our diabetic study population, higher 24-hour urinary aldosterone excretion was associated with higher myocardial ECV, when treated continuously (r = 0.37, p = 0.01) and when stratified by median 24-hour urinary aldosterone excretion (p = 0.03) ( Figure 2 ). This correlation persisted even after the removal of 2 study participants with 24-hour urinary aldosterone excretion ≥2.5 SDs above the mean (r = 0.33, p = 0.02). In addition, the change in aldosterone with angiotensin II infusion was associated with myocardial ECV (r = 0.35, p = 0.02; Figure 2 ). Myocardial ECV did not show a significant correlation with age, gender, race, body mass index, duration of T2DM, HbA 1c , lipids, blood pressure, amlodipine use, the left ventricular ejection fraction, indexed left ventricular mass, or diastolic function (transmitral E/A wave or E/e′). Myocardial ECV was associated with a higher left atrial volume index (r = 0.37, p = 0.02) and a higher left ventricular end-diastolic volume (r = 0.29, p = 0.04). In a best-overall multivariate model including age, gender, body mass index, HbA 1c , systolic and diastolic blood pressure, 24-hour urinary aldosterone excretion was a significant predictor of myocardial ECV (p = 0.004).


