Public reporting of coronary artery bypass grafting (CABG) mortality in California was initiated in 2003. Drug-eluting stents were widely introduced in the same year. Adverse events after percutaneous coronary intervention (PCI) and CABG were analyzed to study the impact of these events. Annual California hospital discharge data were collected from 2000 through 2010. In-hospital mortality and hospital readmission for adverse events <1 year were determined for patients undergoing isolated CABG, PCI for acute coronary syndrome (PCI-ACS), and all other PCIs (PCI-noACS). CABG volume peaked in 2000 and subsequently decreased by 58%; PCI volume peaked in 2005 and subsequently decreased by 20%. After 2003, in-hospital mortality and 1-year mortality for CABG decreased whereas mortality after PCI remained unchanged. Event rates for acute myocardial infarction and stroke varied little over the decade; acute myocardial infarction at 1 year was 2.5% to 2.8% (CABG), 4.5% to 5.4% (PCI-ACS), and 4.6% to 5.8% (PCI-noACS); stroke rate was 1.4% to 1.7% (CABG), 1.2% to 1.6% (PCI-ACS), and 1.0% to 1.2% (PCI-noACS). Reintervention for PCI decreased markedly, from 18.8% to 12.8% (PCI-ACS) and 22.5% to 13.3% (PCI-noACS). Multiple adverse cardiovascular and cerebral events rate at 1 year decreased from 10.8% to 9.4% (CABG), 26.5% to 21.2% (PCI-ACS), and 26.8% to 18.4% (PCI-noACS). Excluding reinterventions, multiple adverse cardiovascular and cerebral events rate at 1 year was 8.3% (CABG), 14.6% (PCI-ACS), and 10.1% (PCI-noACS) in 2010. In conclusion, the volume of coronary interventions in California decreased whereas adverse event rates decreased after the introduction of public reporting and drug-eluting stents. Lower procedure volume combined with improved outcomes resulted in an annual decrease of >6,000 adverse events by the end of the decade.
Major advances have occurred in the field of coronary revascularization during the first decade of the 21st century. Improvements in surgical techniques and postoperative care have resulted in decreased operative mortality for coronary artery bypass grafting (CABG), despite a greater risk population of patients undergoing operation. Significant changes have occurred in the management of coronary artery disease (CAD) such that far fewer CABG surgeries are being performed now than in the past decades. This is perhaps in part because medical management has proven more effective, but also because of the greater utilization of percutaneous interventions. With the advent of drug-eluting stents in 2003, which have been shown to reduce target vessel restenosis, interventional cardiologists have become more confident in using percutaneous coronary intervention (PCI) to manage such previously exclusive surgical situations such as left main and 3-vessel coronary disease. Although current American College of Cardiology Foundation/American Heart Association guidelines continue to recommend CABG over PCI in most patients with complicated disease, it is uncertain whether these guidelines have had a significant impact on “real-life” management of coronary interventions. Public reporting in California of CABG outcomes, but not PCI, was also initiated in 2003. The present study examines trends in the associated time period—the first decade of the 21st century. The analysis includes comparison of in-hospital and 1-year outcomes in cardiovascular morbidity and mortality for CABG, PCI for acute coronary syndrome (PCI-ACS), and all other PCIs (PCI-noACS).
Methods
The California Cardiac Surgery and Intervention Project (CCSIP) collects data from the California Office of Statewide Health Planning and Development (OSHPD) patient discharge database on all cardiac surgery and PCI procedures performed in the state. Because California requires licensed hospitals to submit data on all discharged patients biannually, a 100% collection rate is assured for patients undergoing either CABG or PCI. OSHPD includes confidential information about healthcare outcomes to qualified investigators such as the CCSIP, a program that is supported by the California Society of Thoracic Surgeons. The CCSIP reports volume and outcomes on all cardiac surgery and interventions on its website to provide quality improvement data for healthcare givers and other stakeholders.
All patients who underwent an isolated coronary artery revascularization procedure (CABG or PCI) during 2000 to 2010 were included. Annual follow-up was complete for 99% of patients who underwent PCI and 97% of patients who underwent CABG through 2011. Patients who underwent a concomitant cardiac procedure with coronary revascularization were excluded. In-hospital mortality (IHM) was corrected for “same-day” transfers to another healthcare facility. Documentation of methodology and risk modeling is reported on the CCSIP web site. Post-hospital readmission rates within the first year were collected for death, stroke, acute myocardial infarction (MI), and reintervention for any other procedure (CABG or PCI); the annual rate of any major adverse cardiac or cerebrovascular event (MACCE) was determined for isolated CABG (emergent or elective), PCI-ACS (ICD-9-CM codes 410.xx [International Classification of Diseases, Ninth Revision], ST elevation MI and non-ST elevation MI), and PCI-noACS (all other PCIs). Before 2006, OSHPD data did not include the number of vessels stented during a single procedure, after that time it was possible to determine if the procedure included single or multiple vessel stenting.
The collection of MACCE data was accomplished using ICD-9-CM codes. Events (i.e., MACCE) were counted as present if they were new discharge diagnoses that occurred within the specified period. Although it was possible to have a patient sustain >1 MACCE within the specified period, only the first such event was counted for the combined outcome.
Results
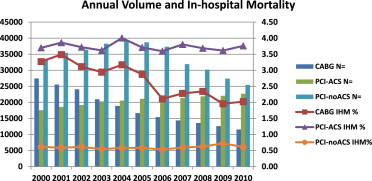
California statewide CABG volume peaked in 2000 and subsequently decreased by 58% in 2010 (27,450 to 11,568); total PCI volume peaked in 2005 and decreased by 20% in 2010 (59,855 to 48,135) ( Figure 1 , Table 1 ). This change was entirely because of PCI-noACS, which decreased by 34% (38,731 to 25,453), whereas PCI-ACS increased by 7% (21,124 to 22,682). IHM for CABG decreased from 3.3% (898 of 27,450 in 2000) to 2.0% (234 of 11,568 in 2010); IHM for PCI-ACS has remained in the 3.6% to 3.8% (853 of 22,682 in 2010) range and IHM of PCI-noACS has stayed constant at approximately 0.6% (156 of 25,453 in 2010). The expected risk increased over the study period for all 3 revascularization strategies ( Table 1 ).

| Year | CABG | PCI-ACS | PCI-noACS | ||||||
|---|---|---|---|---|---|---|---|---|---|
| n | IHM, % | Expected, % | n | IHM, % | Expected, % | n | IHM, % | Expected, % | |
| 2000 | 27,450 | 3.27 | 1.63 | 17,569 | 3.70 | 2.75 | 33,413 | 0.61 | 0.45 |
| 2001 | 25,547 | 3.49 | 1.67 | 18,598 | 3.86 | 2.83 | 35,474 | 0.59 | 0.45 |
| 2002 | 24,088 | 3.11 | 1.66 | 19,168 | 3.72 | 2.89 | 36,370 | 0.61 | 0.48 |
| 2003 | 20,993 | 2.94 | 1.72 | 20,314 | 3.62 | 2.97 | 38,273 | 0.55 | 0.48 |
| 2004 | 18,890 | 3.17 | 1.74 | 20,548 | 4.01 | 3.10 | 39,149 | 0.58 | 0.49 |
| 2005 | 16,675 | 2.87 | 1.71 | 21,124 | 3.71 | 3.17 | 38,731 | 0.58 | 0.51 |
| 2006 | 15,408 | 2.11 | 1.75 | 21,566 | 3.59 | 3.35 | 37,338 | 0.53 | 0.56 |
| 2007 | 14,386 | 2.28 | 1.79 | 21,368 | 3.80 | 3.44 | 31,913 | 0.60 | 0.59 |
| 2008 | 13,583 | 2.34 | 1.97 | 21,887 | 3.69 | 3.50 | 30,216 | 0.62 | 0.60 |
| 2009 | 12,613 | 1.96 | 2.01 | 22,050 | 3.61 | 3.61 | 27,390 | 0.72 | 0.65 |
| 2010 | 11,568 | 2.02 | 1.96 | 22,682 | 3.76 | 3.77 | 25,453 | 0.61 | 0.69 |
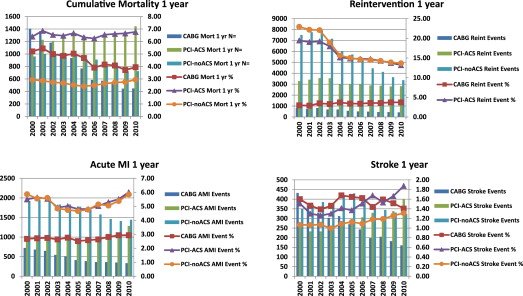
Annual hospital readmission rates for adverse events are shown in Figure 2 . The major findings are a decrease in CABG 1-year mortality beginning in 2004, and a decrease in reintervention rates for PCI beginning in 2002. There was little change in the incidence of readmission for acute MI or stroke diagnoses during the decade. However, there is a trend upward during the most recent years for PCI procedures.

The annual incidence of any adverse event (MACCE) at 1 year is listed in Table 2 . MACCE rate for CABG peaked at approximately 11% early in the decade and was 10% in 2010. MACCE rate peaked at approximately 27% for PCI and was 23% (PCI-ACS) and 19% (PCI-noACS) in 2010. The total number of adverse events for all coronary revascularization procedures peaked >17,000 in 2002 and decreased to <11,000 in 2010.
| Year | CABG MACCE | PCI-ACS MACCE | PCI-noACS MACCE | Total Events | |||
|---|---|---|---|---|---|---|---|
| Events, n | Event Rate, % | Events, n | Event Rate, % | Events, n | Event Rate, % | ||
| 2000 | 2,920 | 10.82 | 4,643 | 27.52 | 8,955 | 27.36 | 16,518 |
| 2001 | 2,725 | 10.85 | 4,901 | 27.35 | 9,271 | 26.52 | 16,897 |
| 2002 | 2,595 | 10.96 | 5,053 | 27.31 | 9,485 | 26.42 | 17,133 |
| 2003 | 2,218 | 10.71 | 5,108 | 25.96 | 8,823 | 23.33 | 16,149 |
| 2004 | 2,100 | 11.29 | 4,703 | 23.73 | 7,795 | 20.17 | 14,598 |
| 2005 | 1,741 | 10.62 | 4,662 | 23.06 | 7,488 | 19.65 | 13,891 |
| 2006 | 1,473 | 9.84 | 4,640 | 22.89 | 7,016 | 19.22 | 13,129 |
| 2007 | 1,403 | 10.19 | 4,573 | 23.33 | 5,941 | 19.34 | 11,917 |
| 2008 | 1,321 | 10.27 | 4,616 | 23.03 | 5,554 | 19.19 | 11,491 |
| 2009 | 1,178 | 9.82 | 4,638 | 22.83 | 5,014 | 19.13 | 10,830 |
| 2010 | 1,147 | 10.07 | 4,794 | 22.47 | 4,706 | 19.09 | 10,647 |
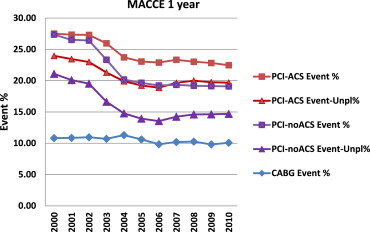
Reintervention comprises a large portion of the MACCE rate for PCI, and a significant percentage of PCI reinterventions are performed electively for nontarget vessel lesions. Our data source did not identify the vessel site for PCI, so we used nonelective readmissions as a surrogate for “unplanned” PCI. Figure 3 shows the annual incidence of adverse events after revascularization, with and without elective admissions for reintervention. When only mortality, acute MI, and stroke were included as adverse events, excluding reinterventions, the MACCE rate was 8% to 9% for CABG, 13% to 14% for PCI-ACS, and 9% to 10% for PCI-noACS, varying little over the decade ( Table 3 ).

Stay updated, free articles. Join our Telegram channel

Full access? Get Clinical Tree


