Quantitative assessment of aortic regurgitation (AR) remains challenging. The present study evaluated the accuracy of 2-dimensional (2D) and 3-dimensional (3D) transthoracic echocardiography (TTE) for AR quantification, using 3D 3-directional velocity-encoded magnetic resonance imaging (VE-MRI) as the reference method. Thirty-two AR patients were included. With color Doppler TTE, 2D effective regurgitant orifice area (EROA) was calculated using the proximal isovelocity surface area method. From the 3D TTE multiplanar reformation data, 3D-EROA was calculated by planimetry of the vena contracta. Regurgitant volumes (RVol) were obtained by multiplying the 2D-EROA and 3D-EROA by the velocity-time integral of AR jet and compared with that obtained using VE-MRI. For the entire population, 3D TTE RVol demonstrated a strong correlation and good agreement with VE-MRI RVol (r = 0.94 and −13.6 to 15.6 ml/beat, respectively), whereas 2D TTE RVol showed a modest correlation and large limits of agreement with VE-MRI (r = 0.70 and −22.2 to 32.8 ml/beat, respectively). Eccentric jets were noted in 16 patients (50%). In these patients, 3D TTE demonstrated an excellent correlation (r = 0.95) with VE-MRI, a small bias (0.1 ml/beat) and narrow limits of agreement (−18.7 to 18.8 ml/beat). Finally, the kappa agreement between 3D TTE and VE-MRI for grading of AR severity was good (k = 0.96), whereas the kappa agreement between 2D TTE and VE-MRI was suboptimal (k = 0.53). In conclusion, AR RVol quantification using 3D TTE is accurate, and its advantage over 2D TTE is particularly evident in patients with eccentric jets.
Quantification of aortic regurgitation (AR) remains challenging in clinical practice. Currently, the proximal isovelocity surface area (PISA) method, using 2-dimensional (2D) Doppler echocardiography, is the recommended approach to estimate the regurgitation volume (RVol) and effective regurgitation orifice area (EROA). However, several assumptions inherent in its derivation may hamper the accuracy of 2D PISA method to quantify AR, such as noncircular orifices and eccentric jets. Real-time 3-dimensional (3D) echocardiography permits direct visualization of the vena contracta and measurement of the EROA, without the need for additional computation or geometric assumptions. In addition, 3D echocardiography is not restricted by any imaging plane, unlike 2D echocardiography, which is limited to quantify flow aligned along the ultrasound beam. Therefore, quantification of AR would be more accurate using 3D than 2D echocardiography, and this would probably become more evident in patients with eccentric AR. Recently, 3D 3-directional velocity-encoded magnetic resonance imaging (VE-MRI) has been proposed as a more accurate method to assess transvalvular flow. The current evaluation assessed the accuracy of 2D and 3D transthoracic echocardiography (TTE) for quantification of AR, using 3D 3-directional VE-MRI as the reference method.
Methods
Thirty-two patients with AR who were clinically referred for TTE and MRI to quantify AR, aortic root, and aortic dimensions were retrospectively evaluated. Patients with acute AR or concomitant valvular disease of more than mild severity, atrial fibrillation, or contraindications for MRI (i.e., implanted devices, claustrophobia) were not included. Clinical data including demographics and symptoms were collected in the departmental electronic patient file (EPD vision version 8.3.3.6; Leiden, The Netherlands) and retrospectively analyzed. All patients underwent standard 2D and 3D color Doppler TTE to quantify AR RVol and EROA. In addition, cardiac MRI was performed in all patients to assess left ventricular (LV) size and function, aortic valve morphology, AR severity, and aortic root and ascending aorta dimensions. Severity of AR was assessed using 3D 3-directional VE-MRI data to quantify the AR Rvol.
Patients were imaged at rest in the left lateral decubitus position using a commercially available ultrasound system (iE33, Philips Medical Systems, Andover, Massachusetts) equipped with a S5-1 transducer. A complete 2D, color, pulsed, and continuous wave Doppler examination was performed according to the standard guidelines. For AR quantification, color Doppler images of the aortic valve were acquired with optimized gain and Nyquist scale (50 to 60 cm/s). From the zoomed color Doppler view of the AR jet, the vena contracta was identified as the narrowest portion of the regurgitant jet that occurred at or just downstream from the regurgitant orifice. For a more quantitative assessment of AR, the PISA method was used. In brief, by shifting the baseline of the aliasing velocity toward the direction of the regurgitant jet (between 20 and 40 cm/s), a well-defined hemisphere of the convergence zone could be identified. From this, the maximal 2D-EROA could be estimated. Subsequently, the RVol was calculated as 2D-EROA multiplied by the velocity-time integral of the AR jet, from the continuous wave Doppler obtained either at the apical 5- or 3-chamber views. AR severity was graded based on RVol: grade 1 (mild), <30 ml; grade 2 (mild-to-moderate), 30 to 44 ml; grade 3 (moderate-to-severe), 45 to 59 ml; and grade 4 (severe), ≥60 ml.
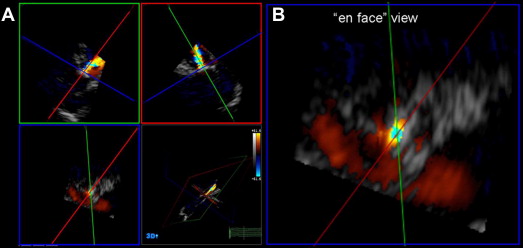
The 3D TTE was performed using the same ultrasound system (the iE33 system) with a fully sampled matrix-array X3 transducer. Apical and parasternal full-volume color Doppler data sets of the AR jets were obtained using electrocardiographic gating over 7 consecutive heart beats to obtain 7 small real-time subvolumes in a larger pyramidal volume. To minimize stitch artifact, the acquisition was performed during 5 to 7 seconds of breath-holding. The color gain and scale were set as previously mentioned. All images were digitally stored and analyzed offline (Q-Lab 3DQ, Philips Medical Systems). To measure 3D-EROA, multiplanar reconstruction of the 3D data sets and manual cropping were performed. First, a cross-sectional plane through the vena contracta of the regurgitant jet, perpendicular to the direction of the AR jet, was obtained. Next, from the en face view of the vena contracta, the 3D-EROA of the narrowest cross-sectional area of the regurgitant jet was measured by manual planimetry from the diastolic frame with the most relevant lesion size ( Figure 1 ). The 3D-RVol was derived by multiplying the 3D-EROA by the velocity-time integral of the AR jet.
MRI was performed using a 1.5-T scanner (Philips Medical Systems, Best, The Netherlands) equipped with a 5-element cardiac synergy coil. First, from a series of short-axis images, encompassing the LV from apex to base and throughout the entire cardiac cycle, quantification of LV volumes and ejection fraction were obtained by using the MASS research software (Division of Image Processing, Department of Radiology, LUMC, Leiden, The Netherlands) with contour segmentation of the epicardial and endocardial borders. For AR quantification, 3D 3-directional VE-MRI was used. A detailed description of the 3D VE-MRI acquisition protocol has been described. In brief, a free-breathing 3D phase-contrast acquisition was used with velocity encoding in 3 orthogonal directions. Imaging parameters were as follows: repetition time 7.5 milliseconds, echo time 4.3 milliseconds; field of view 370 mm, 3D volume imaging with 48-mm slab thickness reconstructed into 12 slices of 4 mm, flip angle of 10°, acquisition voxel size 2.9 × 3.8 × 4.0 mm voxel reconstructed into 1.4 × 1.4 × 4.0 mm voxel, 1 acquired signal, and with 30 phases reconstructed during 1 average cardiac cycle from the retrospective gated acquisition (temporal resolution between 25 and 40 milliseconds, depending on the heart rate). Echo-planar imaging was performed with a factor of 5 resulting in scan duration of approximately 5 minutes. The velocity encoding was initially set at 150 cm/s in all 3 directions. However, additional 2D VE-MRI of the aortic valve was used to determine if a higher maximal velocity was required and the optimized velocity was then applied for 3D VE-MRI in all 3 directions.
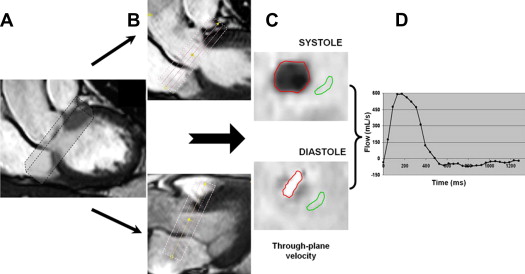
The 3D VE-MRI acquisitions were postprocessed with the in-house developed MASS research software package. Two orthogonal views of the aortic valve were used for retrospective valve tracking and a reformatting plane (with 5 parallel planes equally spaced at 5 mm apart) was marked at the level of the valve annulus in every cardiac phase, perpendicular to the aortic regurgitant flow ( Figure 2 ). Next, the 3D velocity data were reformatted in the center of the valvular plane to generate 1-directional through-plane velocity-encoded images. If aliasing occurred in any of the velocity directions as a result of high-velocity regurgitant jets, the phase unwrapping option of the software was used to correct the velocity data and to avoid underestimation of regurgitation. Background correction was performed to correct for through-plane motion of the myocardium in basal-to-apical direction and local phase offset. The background region of interest was placed at the most caudal plane (i.e., 10 mm distance from the central plane in the LV anterior wall). Finally, the transvalvular volume flow was obtained by integrating the resulting velocities taken over the annular area. The MRI RVol was obtained by calculating the Riemann sum of backward flow during diastole in the flow graph ( Figure 2 ). The reformatting process required 5 minutes, and subsequent image analysis took another 5 to 10 minutes.
Continuous data are presented as mean ± SD, and categorical variables as absolute numbers (percentages). Chi-square or Fisher’s exact tests were used for comparison of categorical variables as appropriate. Linear regression analysis (Pearson correlation) for continuous variables was performed to evaluate the relation between RVol measurements derived from 2D TTE, 3D TTE, and MRI. Bland-Altman plots were used for agreement analysis between 2D TTE, 3D TTE, and MRI derived RVol measurements. In addition, the kappa statistics were used to assess the agreement among different imaging methods with regard to AR severity grading. In 20 randomly selected patients, interobserver reproducibility for 3D TTE–derived measurements were performed by 2 independent, blinded observers and evaluated by intraclass correlation coefficient (ICC). To evaluate intraobserver reproducibility, the same observer repeated the measurements at 2 time points. Good agreement was defined as ICC >0.8. All statistical analyses were performed using SPSS for Windows version 16.0 (SPSS Inc., Chicago, Illinois) and MedCalc 10.0 (Mariakerke, Belgium).
Results
Table 1 summarizes the clinical characteristics and parameters of the patients, with bicuspid aortic valve anatomy in 14 patients (44%). AR was equally divided into central (50%) and eccentric (50%) jets. In patients with eccentric jets, a higher proportion of bicuspid compared with tricuspid valve anatomy was observed (75% vs 25%, p = 0.001). Figures 1 and 3 show examples of a central and an eccentric AR jet, respectively.
| Variable | Patients (n = 32) |
|---|---|
| Age (yrs) | 53 ± 18 |
| Male | 22 (69%) |
| Body surface area (m 2 ) | 1.97 ± 0.23 |
| Heart rate (beats/min) | 67 ± 13 |
| Systolic blood pressure (mm Hg) | 142 ± 20 |
| Diastolic blood pressure (mm Hg) | 73 ± 9 |
| New York Heart Association functional class | |
| I | 23 (72%) |
| II | 7 (22%) |
| III | 2 (6%) |
| Co-morbidities | |
| Hypertension ∗ | 16 (50%) |
| Hypercholesterolaemia ∗ | 9 (28%) |
| Diabetes mellitus | 4 (13%) |
| Coronary artery disease | 4 (13%) |
| Aortic regurgitation etiology | |
| Calcific degeneration | 14 (44%) |
| Bicuspid | 14 (44%) |
| Previous infective endocarditis | 1 (3%) |
| Rheumatic | 2 (6%) |
| Idiopathic dilatation of the aorta | 1 (3%) |
| LV end-diastolic volume (ml) | 210 ± 77 |
| LV end-systolic volume (ml) | 93 ± 46 |
| LV ejection fraction (%) | 58 ± 9 |
| Aortic annulus (mm) | 26 ± 4 |
| Aortic sinus (mm) | 37 ± 6 |
| Sinotubular junction (mm) | 31 ± 6 |
| Ascending aorta (mm) | 34 ± 7 |
∗ Hypertension was defined as blood pressure ≥140/90 mm Hg or on antihypertensive medication for hypertension. Hypercholesterolemia was defined as a serum low-density lipoprotein cholesterol >160 mg/dl or on lipid-lowering medication for hypercholesterolemia.
Stay updated, free articles. Join our Telegram channel

Full access? Get Clinical Tree


