Patients with end-stage liver disease (ESLD) who also have underlying coronary artery disease (CAD) may be at increased risk for undergoing hemodynamically challenging orthotopic liver transplantation. Noninvasive single-photon emission computed tomographic (SPECT) imaging is often used to determine whether a patient with ESLD has unsuspected CAD. The objective of this study was to determine the accuracy of SPECT imaging for detection of CAD in patients with ESLD. Patients with ESLD who underwent coronary angiography and SPECT imaging before orthotopic liver transplantation were analyzed retrospectively. The predictive accuracy of clinical risk factors was calculated and compared to the results of SPECT imaging. There were 473 SPECT imaging studies. Adenosine SPECT imaging had a sensitivity of 62%, specificity of 82%, positive predictive value of 30%, and negative predictive value of 95% for diagnosing severe CAD. Regadenoson SPECT imaging had a sensitivity of 35%, specificity of 88%, positive predictive value of 23%, and negative predictive value of 93% for diagnosing severe CAD. The accuracy of a standard risk factor analysis showed no statistical difference in predicting CAD compared with adenosine (sensitivity McNemar’s p = 0.48, specificity McNemar’s p = 1.00) or regadenoson (sensitivity McNemar’s p = 0.77, specificity McNemar’s p = 1.00) SPECT studies. In conclusion, the 2 pharmaceutical agents had low sensitivity but high specificity for diagnosing CAD. However, because the sensitivity of the test is low, the chances of missing patients with ESLD with CAD is high, making SPECT imaging an inaccurate screening test. A standard risk factor analysis as a predictor for CAD in patients with ESLD is less expensive, has no radiation exposure, and is as accurate as SPECT imaging.
In patients with end-stage liver disease (ESLD), the prevalence of coronary artery disease (CAD) increases with age and ranges from 5% to 27%. Mortality at 3 years after liver transplantation was reported to be 26% to 50% in patients with CAD, compared with 7% in patients without CAD. However, a recent multicenter study showed no difference in mortality between patients with CAD (29%) and those with no CAD (24%) at 3 years, demonstrating improved results with current management of CAD in patients with liver failure. Coronary angiography remains the gold standard to evaluate the presence of CAD in patients with ESLD, but the American College of Cardiology and American Heart Association guidelines consider routine angiography not indicated (class III) for patients who undergo noncardiac surgery unless noninvasive testing reveals high risk for an adverse outcome. In addition, there is an increased risk for bleeding from angiographic procedures in patients with ESLD because of decreased coagulation factors, low platelet count, and increased fibrinolytic activity. As part of the preoperative screening workup, patients may undergo either myocardial perfusion single-photon emission computed tomographic (SPECT) imaging or dobutamine stress echocardiography. The mode of stress for a SPECT study is either exercise or a pharmacologic agent such as adenosine or regadenoson. Studies assessing the diagnostic use of dobutamine stress echocardiography and SPECT in candidates for orthotopic liver transplantation have been inconclusive. No study has described the accuracy of regadenoson stress tests in patients with ESLD. The aim of this study was to assess the diagnostic accuracy of adenosine or regadenoson SPECT stress tests versus standard risk factor analysis compared to coronary angiography in patients with ESLD who underwent cardiac evaluation for consideration for undergoing orthotopic liver transplantation.
Methods
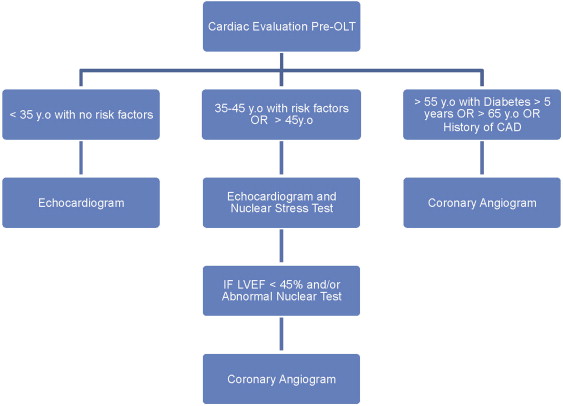
From 2006 to 2011, all patients with ESLD who were being evaluated for possible liver transplantation were analyzed retrospectively. Patients who underwent angiography and myocardial perfusion imaging were included in this study. The protocol used for the cardiac evaluation for orthotopic liver transplantation candidates at the University of California, Los Angeles, Medical Center is shown in Figure 1 . Myocardial perfusion imaging was performed per standard protocols. The initial study involved the intravenous injection of technetium-99m tetrofosmin or sestamibi at rest, followed by imaging 5 to 10 minutes later. The pharmacologic stress agent changed over the time course of the analysis. In patients who underwent stress testing before 2008, the agent of pharmacologic stress was adenosine, given as a continuous infusion at a dose of 140 μg/kg/min over a 6-minute period. After 2008, regadenoson was used as a stressor at a single dose of 0.4 mg given intravenously as a rapid (approximately 10 seconds) injection. Technetium-99m tetrofosmin or sestamibi was injected at peak stress, and standard SPECT images were acquired 60 minutes after the injection. Electrocardiogram, blood pressure measurements, and heart rate were monitored serially during the stress test. The University of California, Los Angeles, institutional review board approved this retrospective study, in which patients records were assessed for demographics, results of coronary angiography, and nuclear stress testing.
The clinical coronary risk factors present in an individual were used to assess the predictive value of risk factors to diagnose CAD. The risk factors that were assessed were age >45 years in men or >55 years in women, diabetes mellitus, history of hypertension, hyperlipidemia, cigarette smoking, and family history of CAD.
Coronary artery stenosis of >50% involving any epicardial vessel was defined as significant CAD. Severe CAD was defined as a stenosis of >70% involving any of the epicardial coronary vessels. Radionuclide stress test results were defined as positive if they showed the presence of ischemia, irrespective of size (small, medium, or large), severity (mild, moderate, or severe), or reversibility.
Continuous variables are expressed as mean ± SD and were compared using Student’s unpaired t tests. Discrete variables are expressed as percentages and were compared using chi-square analysis. Statistical analysis was performed using SPSS version 20 (SPSS, Inc., Chicago, Illinois). A p value <0.05 was considered statistically significant. Classification and regression tree analysis was used to obtain the optimal predictor for CAD for the continuous variable of age on the basis of gender in our patient population. Logistic regression was performed to evaluate the effect of each of the risk factors for predicting CAD, and the regression coefficients were used to determine a score. Using the presence of a risk factor as a value of 1 and the absence of a risk factor as a value of 0, a score was assigned to each case, which gave a minimum score of 0 and a maximum score of 3.5. The sensitivity and specificity of the risk factors as a predictor of CAD on angiography were calculated at different cut-off values of the score. The sensitivity and specificity results for scoring the risk factors were compared with the matched sensitivity and specificity of SPECT studies using McNemar’s test.
Results
Baseline patient characteristics are listed in Table 1 . Of the 414 patients in the analysis who underwent myocardial perfusion scans and coronary angiography, 248 (60%) were men, 201 (48%) had hypertension, 234 (56%) had diabetes, 71 (17%) had hyperlipidemia, and 92 (22%) were on dialysis. The average age at the time of angiography was 60 ± 7.6 years, with an average Model for End-Stage Liver Disease score of 21 ± 10. There were in total 473 radionuclide scans. Of these, 293 (62%) used adenosine as the vasodilating agent, and 180 (38%) used regadenoson. There were 38 patients who underwent scans after revascularization procedures (percutaneous coronary intervention) to assess the status of the coronary arteries and stents. The postprocedural angiogram was used in these cases to compare to the radionuclide stress test results. CAD (>50% stenosis) was present in 17% of the patient cohort (n = 70), while 13% of patients (n = 55) had severe CAD (>70% stenosis).
| Characteristic | Value |
|---|---|
| Men | 248 (60%) |
| Age at catheterization (yrs) | 60 ± 7.6 |
| Hypertension | 201 (48%) |
| Diabetes mellitus | 234 (56%) |
| Dyslipidemia ∗ | 71 (17%) |
| Family history of CAD † | 49 (12%) |
| Smoking history | 167 (40%) |
| Cause of liver disease | |
| Viral | 162 (39%) |
| Alcohol | 83 (20%) |
| Alcohol + viral | 29 (7%) |
| Nonalcoholic steatohepatitis | 52 (12%) |
| Primary biliary cirrhosis | 11 (3%) |
| Autoimmune | 11 (3%) |
| Others | 24 (6%) |
| Idiopathic | 42 (10%) |
| Dialysis | 92 (22%) |
| Model for End-Stage Liver Disease (MELD) | 21 ± 10 |
∗ Medical record of dyslipidemia or treated with a lipid-lowering drug.
† CAD before the age of 55 years in men and 65 years in women in a direct blood relative.
There were 293 adenosine scans (62%) ( Table 2 ). The sensitivity of adenosine perfusion scans for diagnosing severe CAD was 62%, and the specificity was 82%. Results for CAD with diameter stenosis >50% were also similar (sensitivity 54%, specificity 82%). The negative predictive value of adenosine scans for ruling out severe CAD was 95% and for CAD of > 50% stenosis was 92%. The positive predictive value of adenosine scans for diagnosing severe CAD was 30% and for CAD of >50% stenosis was 32%.
| Adenosine Myocardial Perfusion Scan | Coronary Angiography | ||
|---|---|---|---|
| Severe CAD (>70% stenosis) | No CAD (<70% stenosis) | ||
| Ischemia | TP = 20 | FP = 46 | PPV = 30% |
| No ischemia | FN = 12 | TN = 215 | NPV = 95% |
| Sensitivity = 62% | Specificity = 82% | ||
| CAD (>50% stenosis) | No CAD (<50% stenosis) | ||
|---|---|---|---|
| Ischemia | TP = 21 | FP = 45 | PPV = 32% |
| No ischemia | FN = 18 | TN = 209 | NPV = 92% |
| Sensitivity = 54% | Specificity = 82% |
There were 180 regadenoson scans (38%). Results of the regadenoson scans are listed in Table 3 . The sensitivity of the regadenoson perfusion scan was 35% and the specificity 88% for predicting severe CAD. The results did not change when the cutoff for CAD was lowered to stenosis of >50% (sensitivity 35%, specificity 88%). Regadenoson scans performed well in terms of negative predictive value (93% for severe CAD and 91% for CAD of >50% stenosis), but the positive predictive value for diagnosing CAD was low (23% for severe CAD and 27% for CAD of >50% stenosis). Pearson’s chi-square value for adenosine versus regadenoson was 0.80 (p = 0.37), suggesting no significant association between the 2 tests. The chi-square value for the sensitivity of the 2 tests was 0.6 (p = 0.44), and the chi-square value for the specificity of the 2 tests was 0.46 (p = 0.50), again suggesting no significant association between the 2 test results.
| Regadenoson Myocardial Perfusion Scan | Coronary Angiography | ||
|---|---|---|---|
| Severe CAD (>70% stenosis) | No CAD (<70% stenosis) | ||
| Ischemia | TP = 6 | FP = 20 | PPV = 23% |
| No ischemia | FN = 11 | TN = 143 | NPV = 93% |
| Sensitivity = 35% | Specificity = 88% | ||
Stay updated, free articles. Join our Telegram channel

Full access? Get Clinical Tree


