The noninvasive estimation of pulmonary artery systolic pressure (PASP) has become a standard component of the echocardiographic examination. Our aim was to evaluate the accuracy of this modality in a large series of unselected studies obtained in clinical practice. All right heart catheterizations during a 4-year period were reviewed. Studies with echocardiographic findings available within 48 hours were evaluated for PASP agreement. In an effort to mirror clinical practice, the right heart catheterization findings were used as the reference standard and the PASP values were taken directly from the respective clinical reports. Overall, 792 right heart catheterization–echocardiogram pairs were identified. Echocardiographic PASP could not be estimated in 174 of these studies (22.0%). The correlation between modalities was moderate, but agreement was poor (bias 9.0%, 95% limits of agreement −53.2% to 71.2%, r = 0.52, p <0.001). Misclassification of clinical PASP categories occurred more often than not (54.4%). Multivariate analysis using multiple potential sources of error could only account for 3.2% of the total variation in the discrepancy between the study modalities (p = 0.003). In conclusion, noninvasively estimated PASP had limited agreement with the invasively determined PASP, and misclassification of PASP clinical categories occurred frequently. Given the widespread use of echocardiographically determined PASP, these data are in need of replication in a large prospective study.
Several small studies have recently raised concerns about the agreement between the echocardiographically estimated pulmonary artery systolic pressure (PASP ECHO ) and the right heart catheterization-derived PASP (PASP RHC ). To date, PASP ECHO has yet to be validated in a large series of unselected patients. Our aim was to evaluate the accuracy of PASP ECHO in a “real world” population performed during standard patient care conditions and to investigate the potential sources of error. We hypothesized that the favorable results of earlier studies, performed under research conditions, would not necessarily be reproducible in actual clinical practice.
Methods
All consecutive RHCs performed in the cardiac catheterization laboratory of our institution from January 1, 2004 to January 1, 2008 were reviewed. Patients with echocardiographic examinations within 48 hours of the RHC were eligible for study inclusion. Additional inclusion criteria were a mean right atrial pressure and PASP listed in the RHC procedure report. As recommended by the recent Expert Consensus Document on Pulmonary Hypertension, PASP RHC was used as the reference standard. In an effort to mirror actual clinical practice, invasively determined variables were obtained directly from the cardiac catheterization procedure report generated at the time of clinical study by experienced interventional cardiologists.
The values for the echocardiographically estimated right atrial pressure and PASP ECHO were estimated at clinical interpretation by level III, board-certified echocardiographers. In brief, the tricuspid regurgitation velocity signal was recorded from multiple views (tricuspid inflow, parasternal short axis, and apical 4 chamber) with continuous-wave spectral Doppler. Using the highest obtainable maximum velocity from these Doppler profiles, the peak tricuspid regurgitation gradient was determined using the modified Bernoulli equation [4 × (tricuspid regurgitation velocity) 2 ]. The inferior vena cava (IVC) was imaged from the subcostal view with patients asked to rapidly inhale or “sniff” during imaging. The estimated right atrial pressure was determined from the inspiratory degree of IVC collapse as follows: no inspiratory collapse, 20 mm Hg; <50% inspiratory collapse, 15 mm Hg; >50% collapse, 10 mm Hg; and full collapse, 5 mm Hg. The estimated tricuspid regurgitation gradient and right atrial pressure were then summed to derive the PASP ECHO . If the IVC was not adequately visualized, the right atrial pressure was assumed to be 14 mm Hg, as suggested by Kircher et al. If the tricuspid regurgitation gradient was unavailable or deemed unreliable by the interpreting physician, the PASP ECHO was not reported. The PASP clinical categories were defined as normal (≤30 mm Hg), mildly elevated (31 to 45 mm Hg), moderately elevated (46 to 60 mm Hg), and severely elevated (>60 mm Hg). The institutional review board approved the study.
The data are reported as the median with the interquartile range, mean ± SD, and percentile value for nonparametric, parametric, and categorical variables, respectively. The mean difference and mean percentage of difference between modalities were calculated by taking the mean of the absolute value of the echocardiographically derived parameter subtracted from the RHC-derived parameter for each individual study pair. Independent Student’s t test was used to compare the mean values of independent continuous variables. The Pearson chi-square test was used to evaluate the categorical variables. Pearson’s correlation values are reported. Bland-Altman analysis was used to describe the agreement between studies, reported as the bias and 95% limits of agreement. To describe the effect of univariate sources of error, the cohort was dichotomized according to the various candidate sources of error, and odds ratios for PASP clinical category misclassification are reported according to the comparison of the 2 dichotomized groups. Multivariate regression analysis with forced entry was used to determine the overall contribution of the identified sources of error, reported as an r 2 value. Bland-Altman analysis was done using GraphPad Prism, version 5.01 (GraphPad Software, La Jolla, California). All other statistical analyses were performed using the Statistical Package for Social Sciences, version 17.0 (SPSS, Chicago, Illinois). Significance was defined as 2-tailed p <0.05.
Results
Overall, 792 RHC-echocardiogram pairs were identified. The PASP ECHO could not be estimated in 174 of these studies (22.0%). The inability to estimate the PASP ECHO was highly associated with mild or absent tricuspid regurgitation (odds ratio 9.1, p = 0.008). Only 1 patient with moderate or greater tricuspid regurgitation did not have the PASP ECHO reported. A total of 618 study pairs were available for analysis. Of these study pairs, 46.3% had been performed on the same day and 82.8% within 1 day. Of the patients with studies not performed on the same day, 30.1% had undergone echocardiography before RHC and 69.9% after RHC. The summary hemodynamic and echocardiographic data are listed in Table 1 .
| Variable | Value |
|---|---|
| Blood pressure (mm Hg) | |
| Systolic | 129.2 ± 22.2 |
| Diastolic | 80.3 ± 14.3 |
| Right heart catheterization-derived parameters | |
| Systolic pulmonary artery pressure (mm Hg) | 38.1 ± 13.4 |
| Diastolic pulmonary artery pressure (mm Hg) | 16.4 ± 7.8 |
| Mean pulmonary artery pressure (mm Hg) | 24.9 ± 9.2 |
| Tricuspid regurgitation gradient (mm Hg) | 29.2 ± 11.3 |
| Pulmonary capillary wedge pressure (mm Hg) | 15.9 ± 8.0 |
| Pulmonary vascular resistance (Wood units) | 1.6 (1. 0, 2.4) |
| Mean right atrial pressure (mm Hg) | 8.9 ± 6.5 |
| Cardiac output (L/min) | 5.6 ± 1.8 |
| Cardiac index (L/min/m 2 ) | 2.8 ± 0.8 |
| Pulmonary artery systolic pressure (mm Hg) | |
| <30 | 177 (28.6%) |
| 30–49.9 | 281 (45.5%) |
| 45–59.9 | 106 (17.2%) |
| >60 | 54 (8.7%) |
| Echocardiographically derived parameters | |
| Pulmonary artery systolic pressure (mm Hg) | 41.0 ± 11.8 |
| Mean right atrial pressure (mm Hg) | 11.6 ± 4.2 |
| Ejection fraction (%) | 62 (40, 70) |
| Moderate to severe tricuspid regurgitation | 160 (25.9%) |
| Tricuspid regurgitation gradient (mm Hg) | 29.3 ± 10.7 |
| Pulmonary artery systolic pressure (mm Hg) | |
| <30 | 85 (13.8%) |
| 30–49.9 | 332 (53.7%) |
| 45–59.9 | 150 (24.3%) |
| >60 | 51 (8.3%) |
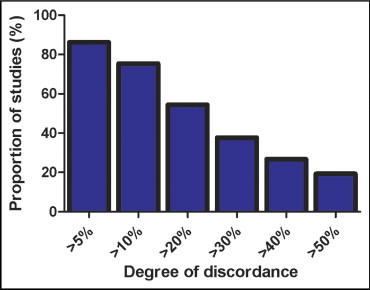
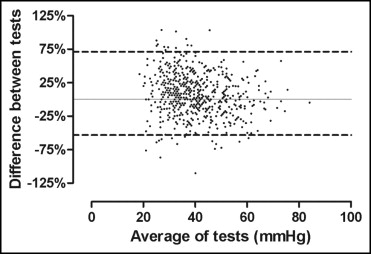
Despite a moderate strength correlation, the agreement between the 2 modalities was relatively poor ( Figure 1 and Table 2 ). Using each patient as their own reference, the mean difference between the PASP ECHO and PASP RHC was 10.0 ± 7.9 mm Hg, and mean percentage of difference was 30.2 ± 29.6%. The proportion of PASP ECHO estimates discordant with PASP RHC at different percentage discrepancy cutoffs is illustrated in Figure 2 and Table 3 . Echocardiography tended to overestimate the PASP, with 62.6% of values overestimated and 37.4% underestimated (p <0.001). The tendency to overestimate increased as the percentage discrepancy cutoff increased ( Table 3 ).
| Subanalysis Category | n | Mean Error | r | p Value | Discordant PASP Clinical Category | Odds Ratio ⁎ | p Value | Bias † | 95% Limits of Agreement † |
|---|---|---|---|---|---|---|---|---|---|
| Total cohort | 618 | 30.20% | 0.52 | <0.001 ‡ | 54.40% | — | — | 9.0% | −53.2% to 71.2% |
| Tricuspid regurgitation gradient | 618 | 30.20% | 0.55 | <0.001 ‡ | — | — | — | 1.1% | −70.5% to 72.1% |
| Estimated right atrial pressure | 428 | 26.30% | 0.57 | <0.001 ‡ | 51.60% | 0.7 | 0.04 ‡ | 4.5% | −56.3% to 65.3% |
| Same-day studies | 286 | 30.10% | 0.59 | <0.001 ‡ | 50.70% | 0.8 | 0.09 | 9.6% | −51.9% to 71.0% |
| Outpatients | 206 | 31.50% | 0.59 | <0.001 ‡ | 53.70% | 1.0 | 0.82 | 11.3% | −50.4% to 73.0% |
| Echocardiography after right heart catheterization | 432 | 30.50% | 0.53 | <0.001 ‡ | 53.00% | 1.2 | 0.30 | 9.6% | −53.9% to 73.1% |
| Body surface area ≤2 m 2 | 325 | 32.70% | 0.53 | <0.001 ‡ | 51.40% | 0.8 | 0.12 | 12.5% | −50.6% to 75.6% |
| Tricuspid regurgitation | |||||||||
| Moderate and severe | 160 | 28.60% | 0.59 | <0.001 ‡ | 55.00% | 0.9 | 0.58 | 10.9% | −46.6% to 68.4% |
| Moderate | 130 | 30.10% | 0.58 | <0.001 ‡ | 55.40% | 1.1 | 0.79 | 12.3% | −45.7% to 70.3% |
| Severe | 30 | 22.70% | 0.63 | <0.001 ‡ | 40.00% | 0.5 | 0.10 | 4.7% | −50.1% to 59.6% |
| Combined variables | 98 | 26.70% | 0.61 | <0.001 ‡ | 55.30% | 1.0 | 0.90 | 8.0% | −49.3% to 65.4% |
⁎ Odds of clinical category misclassification between subgroup and remainder of the cohort excluded from subgroup.
† Bias and 95% limits of agreement calculated with Bland-Altman method; r value represents Pearson correlation between invasively and noninvasively determined PASP within subgroup.
| Percentage of Discrepancy | PASP | Tricuspid Regurgitation Gradient | ||||
|---|---|---|---|---|---|---|
| Total With Discrepancy | Overestimation | Underestimation | Total With Discrepancy | Overestimation | Underestimation | |
| 5% | 533 (86.2%) | 335 (62.9%) | 198 (37.1%) | 540 (87.4%) | 284 (52.6%) | 256 (47.4%) |
| 10% | 466 (75.4%) | 303 (65.0%) | 163 (35.0%) | 464 (75.1%) | 243 (52.4%) | 221 (47.6%) |
| 20% | 336 (54.4%) | 241 (71.7%) | 95 (28.3%) | 335 (54.2%) | 188 (56.1%) | 147 (43.9%) |
| 30% | 233 (37.7%) | 184 (79.0%) | 49 (21.0%) | 232 (37.5%) | 147 (63.4%) | 85 (36.6%) |
| 40% | 165 (26.7%) | 141 (85.5%) | 24 (14.5%) | 158 (25.6%) | 109 (69.0%) | 49 (31.0%) |
| 50% | 119 (19.3%) | 111 (93.3%) | 8 (6.7%) | 102 (16.5%) | 79 (77.5%) | 23 (22.5%) |
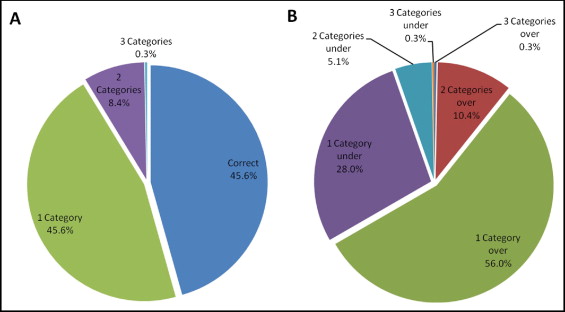
To evaluate the relevance of these discrepancies to clinical practice, the propensity for PASP ECHO to misclassify the PASP clinical categories was examined. More often than not, the patients were misclassified by at least one clinical category, and 8.7% were misclassified by ≥2 categories ( Figure 3 ). Although the misclassification of patients was significant both above and below the invasively determined PASP clinical category, the overall trend was misclassification to a higher rather than a lower PASP clinical category (p <0.001; Figure 3 ). The inability of echocardiography to correctly identify patients with a normal PASP was particularly evident, with a positive predictive value of 75.4% and a negative predictive value of 54.1%. Only 26.0% of patients with a normal PASP RHC were correctly classified as having a normal PASP ECHO . In this group, the mean PASP ECHO was 38.3 ± 6.3 mm Hg versus 24.18 ± 3.7 mm Hg for PASP RHC . Of these patients, 83.2% were classified as having a mildly elevated PASP and 16.0% as having a moderately elevated PASP. Increasing the value of an abnormal PASP ECHO to 40 mm Hg improved the positive predictive value to 85.5% but decreased the negative predictive value to 42.2%. Additionally, 45.9% of patients classified as having a normal PASP ECHO had an elevated PASP RHC . Given that the recommended hemodynamic definition for pulmonary artery hypertension uses the mean pulmonary artery pressure rather than the systolic pressure, we undertook an analysis using the invasively determined mean pulmonary artery pressure. Of the patients with a normal PASP ECHO , 23.8% had a mean pulmonary artery pressure of ≥25 mm Hg by RHC.