Increased physical activity (PA) is associated with improvement of cardiac risk factors and prevention of cardiovascular disease, yet many women remain sedentary. With rising Internet use, Web-based interventions provide an alternative to improve PA, but their effectiveness for change in PA and quality of life (QOL) in a real-world setting is unknown. Participants were United States women ≥18 years old who received 12 weekly PA modules and completed surveys on PA, QOL, and readiness for PA at registration (registration cohort, n = 3,796) or registration and 12 weeks (evaluation cohort, n = 892). QOL was assessed with a modified Short Form-36 with subscores for energy and well-being. Participants showed significant (p <0.001) favorable changes in PA (baseline, median 240 kcal/week, interquartile range 62 to 667; 12 weeks, 343 kcal/week, 131 to 828), stage of readiness for PA, and body mass index (baseline, 29.3 kg/m 2 , 24.9 to 34.7; 12 weeks, 28.9 kg/m 2 , 24.6 to 34.2). Significant improvements (p <0.0001) were also found in composite scores for energy and well-being. Compliance with PA guideline recommendations increased from 15.8% to 21.4%. Program weeks completed (p = 0.03), energy (p = 0.04), and well-being (p = 0.002) were significantly associated with achieving guideline compliance. In women reporting no PA at baseline (n = 88), program participation resulted in 54.6% achieving some PA and another 9.1% achieving total compliance with recommendations. In conclusion, in this national cohort of women, a 12-week Web-based intervention improved PA and QOL measurements, resulting in higher short-term PA guideline compliance and better QOL. Increasing use of this simple Web-based tool could improve PA and promote disease prevention.
In an effort to appeal to sedentary women, the American Heart Association (AHA) launched in 1999 the Choose to Move (CTM) program, a 12-week, print-based, self-directed lifestyle intervention emphasizing physical activity (PA) and designed specifically for women. A 2001 evaluation of 3,755 CTM participants using this print-based format found that a significantly larger proportion met PA guidelines at the end of the 12-week intervention compared to baseline. In response to the growing popularity of Web-based resources, the AHA debuted CTM online in 2001. This electronic program was free of charge and available nationwide. The aim of this study was to assess participants in the Web-based CTM program for changes in (1) PA levels, (2) measurements on quality of life (QOL); and (3) body mass index (BMI) from baseline.
Methods
All participants in the Web-based CTM program who enrolled consecutively from October 2006 through August 2007 were asked to take part in the study. Every participant received a request by e-mail to complete each of 2 study surveys, the first within 1 week of enrollment and the second 12 weeks later, because the Web-based program was designed as a 12-week intervention regardless of program completion. The surveys were identical and included questions on demographics, anthropometrics, PA behavior, and QOL. Of 15,064 participants who enrolled in CTM during the study period, 4,003 participants completed a survey at registration (registration cohort) including 1,063 participants who provided survey responses at registration and at 12 weeks (evaluation cohort; Figure 1 ) . Although no incentive was offered for completion of the survey at registration, an AHA publication, 365 Ways to Get Out the Fat: A Tip a Day to Trim the Fat Away , was offered to those who provided survey responses at 12 weeks.
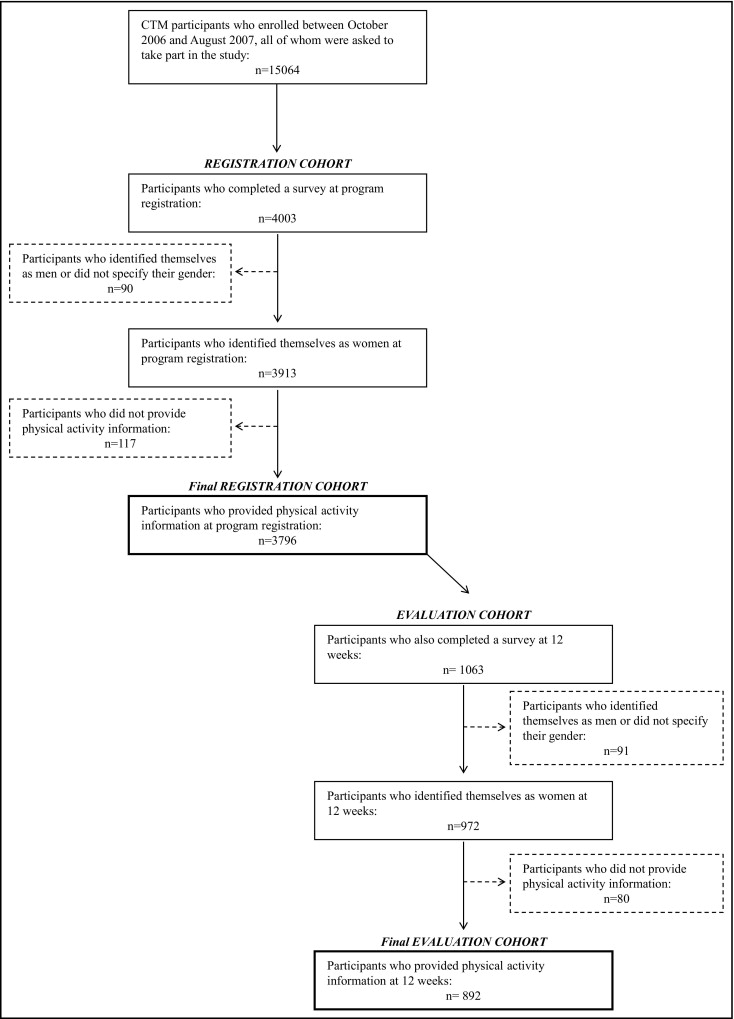
For this study we excluded participants who identified themselves as men (n = 59) or did not provide gender information (n = 58) at registration or at completion ( Figure 1 ). We also excluded participants who did not report PA data at registration (n = 117) or 12 weeks (n = 80) or who provided discordant gender information at registration and 12 weeks (n = 24). Thus, 3,796 women in the registration cohort and 892 women in the evaluation cohort remained for analysis. The study was approved by the institutional review board of Brigham and Women’s Hospital (Boston, Massachusetts).
The online CTM program, similar to its print-based counterpart and previous PA interventions in community, workplace, and clinical settings, was developed according to the Transtheoretical Stages of Change Model, which emphasizes the importance of individual readiness in successful behavior modification. Stages include precontemplation, contemplation, preparation, action, and maintenance and reflect increasing interest in meeting health behavior guideline recommendations. Completely sedentary participants may be considered precontemplators or contemplators based on their commitment to becoming active within 6 months. Preparation indicates some level of PA with progress toward meeting guidelines. Action and maintenance reflect achievement of guidelines within the previous 6 months and >6 months before the period of interest, respectively. CTM was designed primarily for women contemplating or preparing to engage in regular PA, but the program was accessible to all interested participants.
The Web-based CTM program directed participants to make incremental changes in PA and healthy eating behaviors during the 12-week intervention period. After online enrollment, participants gained access to 12 modules, 1 per week in the course of 12 consecutive weeks, accompanied by weekly e-mail reminders. Each module contained motivational strategies and interactive elements including self-assessment questionnaires and progress logs. Participants were encouraged to reach 30 minutes of PA daily by week 8 in accordance with PA guideline recommendations.
Basic demographic and anthropometric information on all participants was obtained at registration and 12 weeks. To assess PA levels, participants were asked to estimate the average time spent per week over the previous year (at registration) or the previous month (at 12 weeks) on each of 8 recreational activities: walking or hiking; jogging; running; bicycling; aerobic exercise, dance, or use of exercise machines; lower-intensity exercise including yoga, stretching, or toning; tennis, squash, or racquetball; and lap swimming. We also inquired about the number of flights of stairs climbed daily and average walking pace (do not walk regularly; <2 mph [easy casual pace]; 2.0 to 2.9 mph [normal average pace]; 3.0 to 3.9 mph [brisk pace]; or ≥4.0 mph [very brisk/striding pace]). PA questions and assessment measurements were drawn from a previously validated questionnaire used in healthy women in the Nurses’ Health Study and the Women’s Health Study. Each activity was assigned a metabolic equivalent (MET) score based on its energy cost. We estimated the energy expended on each activity and calculated the sum to estimate the total energy expended on PA (kilocalories [kcal] per week). We determined energy expenditure in kilocalories, which incorporate body weight, because of their interpretability by physicians and patients.
We evaluated readiness to engage in PA by asking participants to select from a series of 6 graded statements reflecting the Transtheoretical Stages of Change Model. We assessed QOL by asking participants to select from 6 graded responses to 10 questions on energy/fatigue, emotional well-being, and body image. With the exception of 1 question on body image satisfaction, all questions were based on the RAND 36-Item Health Survey. The response to each question was assigned a point value from 0 to 100, where 100 points was considered optimal. We determined energy/fatigue and emotional well-being composite scores by averaging the number of points assigned to individual responses associated with each composite measurement.
Statistical analyses were performed with STATA 8.2 (STATA Corp., College Station, Texas). We assessed change in PA as a continuous variable (kcal/week) and as change in category of energy expenditure (<200, 200 to 599, 600 to 1,499, and ≥1,500 kcal/week) as used previously in the Women’s Health Study, with the highest activity category corresponding to ≈5 hours of moderate-intensity activity per week. In addition, we classified participants according to their degree of participation in regular PA (none, 0 kcal/week; some, <1,000 kcal/week; and meets guidelines, ≥1,000 kcal/week) and standard BMI categories (obese ≥30.0 kg/m 2 , overweight 25.0 to 29.9 kg/m 2 , normal 18.5 to 24.9 kg/m 2 , underweight <18.5 kg/m 2 ).
Chi-square tests were used to compare proportions of evaluation cohort participants by categories. Wilcoxon matched-pairs signed ranks test were used to compare continuous variables by medians. Multivariate logistic regression analysis was performed to determine odds ratios and 95% confidence intervals for the association of demographic characteristics and QOL composite scales with achievement of PA guideline recommendations. Dr. Mora and Ms. Lieber had full access to the data and take responsibility for the integrity of the data. All authors have read and agreed to the report as written.
Results
Survey participants consisted predominantly of white women but included 15% ethnic and racial minorities ( Table 1 ). Although >1/2 of participants were 35 to 54 years old and had completed at least some college at the time of registration, a broad range of ages and educational backgrounds was represented. Most participants were overweight or obese.
| Characteristic | Registration Cohort | Evaluation Cohort |
|---|---|---|
| (n = 3,796) | (n = 892) | |
| Race | ||
| African-American | 260 (7.1%) | 65 (7.3%) |
| Asian | 42 (1.2%) | 15 (1.7%) |
| Hispanic | 132 (3.6%) | 29 (3.3%) |
| Native-American | 33 (0.9%) | 7 (0.8%) |
| Other | 52 (1.4%) | 17 (1.9%) |
| White | 3,113 (85.4%) | 757 (84.9%) |
| Age (years) | ||
| 18–24 | 144 (4.0%) | 22 (2.5%) |
| 25–34 | 495 (13.6%) | 125 (14.0%) |
| 35–44 | 906 (24.9%) | 217 (24.3%) |
| 45–54 | 1,205 (33.1%) | 304 (34.1%) |
| 55–64 | 736 (20.2%) | 187 (21.0%) |
| 65–74 | 141 (3.9%) | 33 (3.7%) |
| ≥75 | 14 (0.4%) | 4 (0.5%) |
| Educational level | ||
| Some high school | 42 (1.2%) | 9 (1.0%) |
| High school graduate | 401 (11.0%) | 87 (9.8%) |
| Some college | 1,175 (32.2%) | 264 (29.6%) |
| College graduate | 1,204 (33.0%) | 310 (34.8%) |
| Postgraduate studies | 806 (22.1%) | 217 (24.3%) |
| Geographic region | ||
| Midwest | 980 (27.4%) | 274 (31.3%) |
| Northeast | 631 (17.6%) | 145 (16.6%) |
| Southeast | 940 (26.3%) | 219 (25.0%) |
| Southwest | 388 (10.8%) | 85 (9.7%) |
| West | 575 (16.1%) | 138 (15.8%) |
| Physical activity (kcal/week) | ||
| <200 | 1,949 (51.3%) | 401 (45.0%) |
| 200–599 | 1,003 (26.4%) | 246 (27.6%) |
| 600–1,499 | 597 (15.7%) | 179 (20.1%) |
| ≥1,500 | 247 (6.5%) | 66 (7.4%) |
| Participation in regular physical activity ⁎ | ||
| None | 580 (15.3%) | 88 (9.9%) |
| Some | 2,754 (72.6%) | 662 (74.3%) |
| Meets guidelines | 461 (12.2%) | 141 (15.8%) |
| Body mass index (kg/m 2 ) | ||
| ≥30.0 | 1,614 (44.8%) | 413 (46.3%) |
| 25.0–29.9 | 1,097 (30.4%) | 247 (27.7%) |
| 18.5–24.9 | 844 (23.4%) | 214 (24.0%) |
| <18.5 | 50 (1.4%) | 18 (2.0%) |
| Quality of life † | ||
| Energy/fatigue | 50 (30–60) | 50 (35–60) |
| Emotional well-being | 68 (56–80) | 68 (56–80) |
| Body image | 20 (0–40) | 20 (0–40) |
⁎ Participation in regular physical activity was categorized as none (0 kcal/week), some (0 to 1,000 kcal/week), or meets guidelines (≥1,000 kcal/week).
† With the exception of body image, all measurements are based on the RAND 36-Item Health Survey and scored on a scale from 0 to 100, where higher values are optimal.
The evaluation cohort was similar to the registration cohort except that evaluation cohort participants reported higher levels of PA, body satisfaction, and readiness to engage in PA at baseline. Although the evaluation cohort included a larger proportion of active women than the registration cohort, most women were substantially below current PA guideline recommendations at time of registration. There was no statistically significant difference in BMI distribution between the 2 cohorts.
In evaluation cohort participants, the median number of weeks completed was 5 with an interquartile range (25th to 75th percentiles) of 3 to 11, and 24.7% completed all 12 weeks. The evaluation cohort showed significant improvements in PA and BMI at 12 weeks compared to baseline (p for trends <0.001; Table 2 ). Completely sedentary women made up only 6.0% of evaluation cohort participants at completion, decreased from 9.9% at registration, whereas women who met PA guideline recommendations increased from 15.8% at registration to 21.4% at 12 weeks. Of 88 evaluation cohort participants who reported no PA at registration, 9.1% met PA guideline recommendations at completion and an additional 54.6% engaged in some PA by the end of the intervention period.
| Characteristic | At Registration | At 12 Weeks | p Value |
|---|---|---|---|
| Physical activity (kcal/week) | |||
| Median (interquartile range) | 240 (62–667) | 343 (131–828) | <0.0001 |
| <200 | 401 (45.0%) | 302 (33.9%) | <0.0001 |
| 200–599 | 246 (27.6%) | 276 (30.9%) | |
| 600–1,499 | 179 (20.1%) | 203 (22.8%) | |
| ≥1,500 | 66 (7.4%) | 111 (12.4%) | |
| Participation in regular physical activity ⁎ | |||
| None | 88 (9.9%) | 53 (6.0%) | |
| Some | 662 (74.3%) | 647 (72.6%) | <0.0001 |
| Meets guidelines | 141 (15.8%) | 191 (21.4%) | |
| Body mass index (kg/m 2 ) ⁎ | |||
| Median (interquartile range) | 29.3 (24.9–34.7) | 28.9 (24.6–34.2) | <0.0001 |
| ≥30.0 | 410 (46.6%) | 386 (43.9%) | <0.0001 |
| 25.0–29.9 | 243 (27.6%) | 251 (28.5%) | |
| 18.5–24.9 | 213 (24.2%) | 236 (26.8%) | |
| <18.5 | 14 (1.6%) | 7 (0.8%) | |
⁎ Participation in regular physical activity and body mass index categorized as in Table 1 .
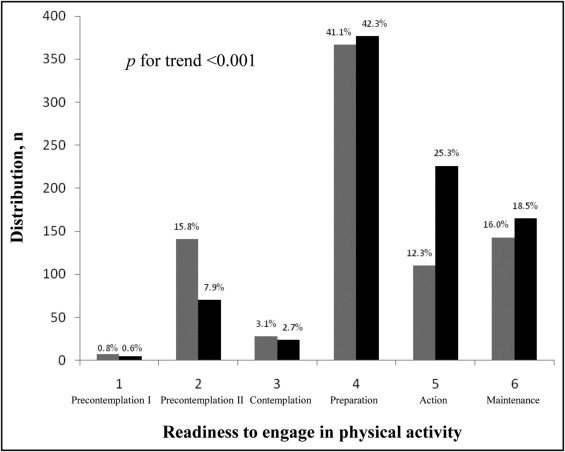
The distribution of evaluation cohort participants according to a 6-point scale of readiness to participate in PA is presented in Figure 2 . Favorable changes in readiness to engage in PA were observed in the evaluation cohort from registration to 12 weeks (p for trend <0.001), with a larger proportion of women in the action stage by program completion compared to baseline.