To determine which statin will better improve the apolipoprotein (Apo) profiles (ApoA-I levels, ApoB levels, and ApoB/A-I ratios), we performed a meta-analysis of randomized head-to-head trials of rosuvastatin versus atorvastatin therapy. MEDLINE, EMBASE, and the Cochrane Central Register of Controlled Trials were searched through December 2012 using Web-based search engines (PubMed and OVID). The search terms included “apolipoprotein,” “rosuvastatin,” “atorvastatin,” “randomized,” “randomly,” and “randomization.” Of 42 potentially relevant studies initially screened, 25 reports of randomized trials enrolling 14,283 patients were included. A pooled analysis for the percentage of changes in ApoA-I demonstrated a benefit of rosuvastatin versus atorvastatin in the comparison of all rosuvastatin/atorvastatin dose ratios (mean difference 2.97%, 3.39%, 5.77%, and 6.25%). For the percentage of changes in ApoB, a benefit was seen for rosuvastatin versus atorvastatin in the 1/1 (−6.06%) and 1/2 dose ratio (−1.80%). However, a benefit was seen for atorvastatin versus rosuvastatin in the 1/4 (2.38%) and 1/8 dose ratio (6.59%). The pooled analysis for the percentage of changes in the Apo B/A-I ratios demonstrated a benefit for rosuvastatin versus atorvastatin in the 1/1 (−7.22%) and 1/2 dose ratio (−3.51%), with no difference in the 1/4 dose ratio. In contrast, a benefit was seen for atorvastatin versus rosuvastatin in the 1/8 dose ratio (4.03%). In conclusion, rosuvastatin might increase Apo A-I levels at all dose ratios and decrease ApoB levels and ApoB/A-I ratios in the 1/1 and 1/2 dose ratio versus atorvastatin. Only higher dose atorvastatin appeared to be more effective for the reduction in ApoB levels (1/4 and 1/8 dose ratio) and Apo B/A-I ratios (1/8 dose ratio).
Apolipoprotein (Apo) A-I is 1 of 2 types of ApoA associated with high-density lipoprotein (HDL), of which ApoA-I is the major form. It stabilizes the structure of the lipoprotein, mediates reverse cholesterol transport, and has anti-inflammatory and antioxidant properties. ApoB is present as a single molecule in very-low-, intermediate-, and low-density lipoprotein (LDL), with >90% of all ApoB usually found in LDL. It stabilizes the structure of the lipoprotein and acts as a ligand for binding LDL particles at LDL receptors, allowing internalization of cholesterol. Moderately strong associations have been found between the risk of incident coronary heart disease and the baseline levels of ApoA-I and ApoB, and the ApoB/A-I ratio. Furthermore, on-treatment levels of ApoB with statins have been associated with the risk of future major cardiovascular events. High-intensity statins, rosuvastatin and atorvastatin, would be expected to influentially reduce the ApoB levels and, accordingly, attenuate the ApoB/A-I ratios. Rosuvastatin has been more efficacious for LDL reduction than the same dose of atorvastatin or a 2 times greater dose of atorvastatin. Despite differences in the potency of rosuvastatin and atorvastatin, the incremental effect of dose doubling has been comparable in decreasing ApoB. Rosuvastatin and atorvastatin raise the concentrations of both HDL and ApoA-I, and the percentage of increase in HDL will be paralleled by a comparable increase in ApoA-I for each of the statins. To determine which statin improves the Apo profiles better, we performed a meta-analysis of randomized head-to-head trials of rosuvastatin versus atorvastatin therapy.
Methods
All prospective, randomized head-to-head trials of rosuvastatin versus atorvastatin therapy enrolling unrestricted patients were identified using a 2-level search strategy. First, public domain databases, including MEDLINE, EMBASE, and the Cochrane Central Register of Controlled Trials, were searched through December 2012 using Web-based search engines (PubMed and OVID). Second, the relevant studies were identified through a manual search of secondary sources, including the references of the initially identified studies and a search of reviews and commentaries. The search terms included “apolipoprotein,” “rosuvastatin,” “atorvastatin,” “randomized,” “randomly,” and “randomization.”
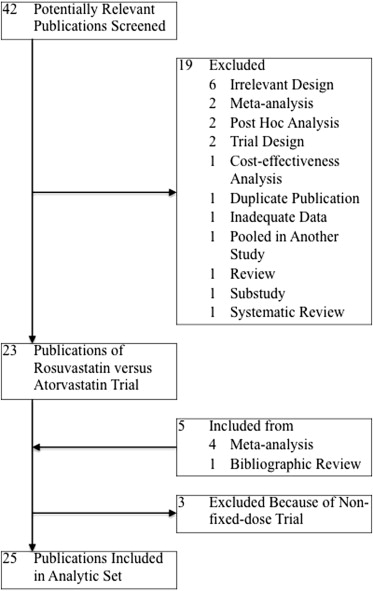
The studies considered for inclusion met the following criteria: the design was a prospective randomized controlled clinical trial; the study population was unrestricted patients; the patients had been randomly assigned to a fixed dose (including forced titration with a fixed dose ratio) of rosuvastatin versus atorvastatin therapy; and the outcomes included the ApoA-I levels, ApoB levels, and/or ApoB/A-I ratios. A Quality of Reporting of Meta-analyses flow diagram of the study selection process is illustrated in Figure 1 .
For each comparison, data regarding the percentage of changes from baseline to the final ApoA-I levels, ApoB levels, and ApoB/A-I ratios in the rosuvastatin and atorvastatin groups were used to generate the mean differences (MDs) and 95% confidence intervals (CIs). When standard deviations were unavailable and only baseline and final values had been reported, missing standard deviations were imputed, and changes from baseline to the final values were obtained, according to the Cochrane Handbook. We assumed a correlation coefficient of 0.5 between the baseline and final values and equal variances during the trial and between the rosuvastatin and atorvastatin groups. Using inverse variance-weighted averages of the MDs in both fixed- and random-effects models, comparison-specific estimates were separately combined according to the 1/1 (e.g., 10/10 mg/day), 1/2 (e.g., 10/20 mg/day), 1/4 (e.g., 10/40 mg/day), and 1/8 (e.g., 10/80 mg/day) rosuvastatin/atorvastatin dose ratio. Between-study heterogeneity was analyzed using standard chi-square tests. If no significant statistical heterogeneity was identified, the fixed-effect estimate was used preferentially as the summary measure. Sensitivity analyses were performed to assess the contribution of each estimate to the pooled estimate by excluding the individual estimates 1 at a time and recalculating the pooled MD estimates for the remaining estimates. All analyses were conducted using Review Manager, version 5.1 (Nordic Cochrane Center, Copenhagen, Denmark).
Results
As outlined in Figure 1 , our search identified 25 reports ( Supplemental References S1–S25 ) of prospective randomized controlled clinical trials of rosuvastatin versus atorvastatin therapy enrolling unrestricted patients. Our meta-analysis included data from 14,283 patients randomized to therapy with rosuvastatin or atorvastatin. The trial design and baseline Apo profiles for the patients enrolled in each trial are summarized in Table 1 . We excluded 3 trials ( Supplemental References S26–S28 ) because of nonfixed-dose comparisons.
| Trial | Inclusion Criteria | Intervention | Patients (n) | Mean Age (yrs) | Follow-Up (wk) | Baseline Apo ∗ | ||||||
|---|---|---|---|---|---|---|---|---|---|---|---|---|
| Morbidity | LDL (mg/dl) | TG (mg/dl) | Rosuvastatin (mg/day) | Atorvastatin (mg/day) | Rosuvastatin | Atorvastatin | ApoA-I (g/L) | ApoB (g/L) | ApoB/ApoA-I Ratio | |||
| Fixed-dose (including forced titration with fixed dose ratio) trials | ||||||||||||
| ANDROMEDA 2007 [S1] | T2DM | NR | ≤531 (6.0 mmol/L) | 10 (8 wk) → 20 | 10 (8 wk) → 20 | 227 | 229 | 61.5 | 16 | NR | NR | NR |
| ARIES 2006 [S2] | HC | 160–300 | <400 | 10 | 10 | 186 | 179 | 55.1 | 6 | 1.565 | 1.661 | 1.09 |
| 20 | 20 | 189 | 178 | |||||||||
| Blasetto 2003 † [S3], Rader 2003 † [S4] | HC | 160–250 | ≤400 | 5 | — | 390 | — | 59 | 12 | 1.50 | 1.78 | 1.2 |
| 10 | 10 | 389 | 393 | |||||||||
| CENTAURUS 2010 [S5] | Non–ST-segment elevation ACS | NR | NR | 20 | 80 | 369 | 384 | 59 | 12 | 1.37 | 1.29 | 0.98 |
| COMETS 2005 [S6] | Nondiabetic MS with high LDL and multiple risk factors, conferring 10-year CHD risk score >10% | ≥130 | NR | 10 (6 wk) → 20 | 10 (6 wk) → 20 | 164 | 155 | 57.7 | 12 | 1.506 | 1.618 | 1.11 |
| Placebo (6 wk) → 20 | 78 | |||||||||||
| CORALL 2005 [S7] | T2DM | ≥130 in statin-naive subjects or 116–193 (2.99–5.00 mmol/L) in subjects who had been taking a statin within previous 4 wk | <400 | 10 (6 wk) → 20 (6 wk) → 40 | 20 (6 wk) → 40 (6 wk) → 80 | 131 | 132 | 60 | 18 | 1.46 | 1.26 | 0.89 |
| ECLIPSE 2008 [S8] | HC and CHD, atherosclerosis, or 10-year CHD risk score >20% | 160–250 | <400 | 10 (6 wk) → 20 (6 wk) → 40 | 10 (6 wk) → 20 (6 wk) → 40 (6 wk) → 80 | 469 | 472 | 62.4 | 24 [18 ‡ ] | 1.67 | 1.76 | NR |
| Her 2010 [S9] | HC | >130 | <400 | 10 | 20 | 25 | 25 | 60 | 8 | 1.48 | 1.16 | 0.81 |
| IRIS 2007 [S10] | HC | CHD or CHD risk equivalent, ≥100; 2 risk factors and 10-yr CHD risk 10–20%, ≥130; or 0/1 risk factor, ≥160 | <500 | 10 | 10 | 183 | 180 | 55.9 | 6 | 1.44 | 1.50 | 1.1 |
| 20 | 20 | 171 | 175 | |||||||||
| MERCURY I 2005 [S11] | HC with CAD, atherosclerosis, T2DM, or 20% 10-yr risk of CAD | ≥115 | <400 | 10 | 10 | 521 | 240 | 62–63 | 16 | 1.544 | 1.550 | 1.04 |
| 20 | 299 | |||||||||||
| MERCURY II 2006 [S12] | High risk of CHD | 130–250 | <400 | — | 10 | — | 180 | 61.9 | 16 | 1.513 | 1.597 | 1.09 |
| 20 | 20 | 362 | 182 | |||||||||
| Olsson 2001 § [S13] | Moderate HC | 160–220 | <300 | 2.5 | — | 13 | — | 56 | 6 | 1.378 | 1.364 | 1.0 |
| 5 | — | 17 | — | |||||||||
| 10 | 10 | 16 | 13 | |||||||||
| 20 | — | 13 | — | |||||||||
| 40 | — | 34 | — | |||||||||
| 80 | 80 | 31 | 10 | |||||||||
| Olsson 2002 [S14] | Primary HC | 160–250 | ≤400 | 5 (12 wk) → 5/10 (8 wk) → 5/10/20 (8 wk) → 5/10/20/40 (8 wk) → 5/10/20/40/80 | 10 (12 wk) → 10/20 (8 wk) → 10/20/40 (8 wk) → 10/20/40/80 | 135 | 139 | 57.4 | 52 [12 ‡ ] | 1.556 | 1.775 | 1.18 |
| 10 (12 wk) → 10/20 (8 wk) → 10/20/40 (8 wk) → 10/20/40/80 | 132 | |||||||||||
| Park 2010 [S15] | Nondiabetic MS with DL | 130–220 | NR | 10 | 10 | 170 | 176 | 59.71 | 6 | 1.4185 | 1.1767 | NR |
| POLARIS 2007 [S16] | HC and CHD, atherosclerosis, or 10-yr Framingham CHD risk score >20% | 160–250 | <400 | 20 (2 wk) → 40 (6 wk) → 20/40 | 40 (2 wk) → 80 (6 wk) → 40/80 | 428 | 432 | 62.1 | 26 [8 ‡ ] | 1.551 | 1.763 | NR |
| PULSAR 2006 [S17] | HC and CHD, atherosclerosis, or CHD risk equivalent | 130–220 | <400 | 10 | 20 | 493 | 481 | 60.4 | 6 | 1.601 | 1.570 | 1.0 |
| RADAR 2005 [S18] | CVD and low HDL | NR; HDL <40 | ≤400 | 10 (6 wk) → 20 (6 wk) → 40 | 20 (6 wk) → 40 (6 wk) → 80 | 230 | 231 | 60.4 | 18 | 0.91 mmol/L | 1.06 mmol/L | 1.17 |
| Rosenson 2009 [S19] | DL and nondiabetic MS | 130–250 | NR | Placebo/10 (6 wk) → 20 | 10 (6 wk) → 20 | 166 | 91 | 58.4 | 12 | 1.49 | 1.61 | NR |
| Schneck 2003 [S20] | HC without active arterial disease within 3 mo of entry | 160–250 | <400 | 5 | — | 38 | — | 56.8 | 6 | 1.50 | 1.83 | 1.3 |
| 10 | 10 | 45 | 42 | |||||||||
| 20 | 20 | 37 | 38 | |||||||||
| 40 | 40 | 44 | 41 | |||||||||
| 80 | 80 | 42 | 40 | |||||||||
| Schwartz 2004 [S21] | HC and high risk of CHD | 160–250 | ≤400 | 5 (12 wk) → 5/20 (6 wk) → 5/20/80 | 10 (12 wk) → 10/40 (6 wk) → 10/40/80 | 127 | 127 | 62 | 24 [12 ‡ ] | 1.43 | 1.80 | 1.3 |
| 10 (12 wk) → 10/40 (6 wk) → 10/40/80 | 128 | |||||||||||
| STARSHIP 2006 [S22] | HC and medium or high risk of CHD | 130–300 | <400 | 10 | 10 | 174 | 161 | 57.9 | 6 | 1.52 | 1.56 | 1.05 |
| 20 | 20 | 167 | 161 | |||||||||
| Stein 2003 [S23] | HFH | 220–500 | ≤400 | 20 (6 wk) → 40 (6 wk) → 80 | 20 (6 wk) → 40 (6 wk) → 80 | 435 | 187 | 48 | 18 | 1.38 | 2.51 | 1.9 |
| STELLAR 2004 [S24] | HC | 160–250 | <400 | 10 | 10 | 153 | 153 | 57 | 6 | 1.52 | 1.71 | 1.2 |
| 20 | 20 | 154 | 148 | |||||||||
| 40 | 40 | 153 | 154 | |||||||||
| 80 | 163 | |||||||||||
| URANUS 2005 [S25] | T2DM and high LDL | ≥128 (3.3 mmol/L) | <531 (6.0 mmol/L) | 10 (4 wk) → 10/20 (4 wk) → 10/20/40 | 10 (4 wk) → 10/20 (4 wk) → 10/20/40 (4 wk) → 10/20/40/80 | 232 | 231 | 64.3 | 16 [4 ‡ ] | NR | NR | NR |
| Total | 7,661 | 6,622 | ||||||||||
| Excluded trials | ||||||||||||
| ATOROS 2006 [S26] | CVD free primary HL | >240 | <350 | 10 (6 wk) → 10/20 | 20 (6 wk) → 20/40 | 60 | 60 | 53.4 | 24 | 1.34 | 1.85 | NR |
| IN-PRACTICE 2010 [S27] | CVD, diabetes, or high risk of CVD | 77–162 | <328 | 5/10 | 40 | 258 | 259 | 64.1 | 6 | NR | NR | NR |
| Toyama 2011 ¶ [S28] | CAD | NR | NR | 2.5–20 | 10–40 | 14 | 14 | 68 | 20 | 1.130 | NR | NR |
Stay updated, free articles. Join our Telegram channel

Full access? Get Clinical Tree


