A 47-year-old man was referred because of an acute anterolateral ST-segment elevation myocardial infarction. Coronary angiography showed marked ectasia of the coronary arteries, with no obstructive lesions. Ventriculography strongly suggested severe left ventricular hypertrophy, later confirmed by cardiovascular magnetic resonance imaging. Complete clinical investigation showed that the patient also had multiple lentigines, ocular hypertelorism, and deafness. These associations led to the diagnosis of LEOPARD (Lentigines, Electrocardiographic anomalies, Ocular hypertelorism, Pulmonary stenosis, Anomalies of the genitalia, Retarded growth, and Deafness [sensorineural]) syndrome. Although uncommon, LEOPARD syndrome is important to recognize because it can be associated with serious adverse cardiac events, particularly in patients with severe left ventricular hypertrophy.
Case Description
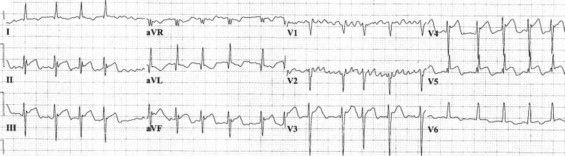
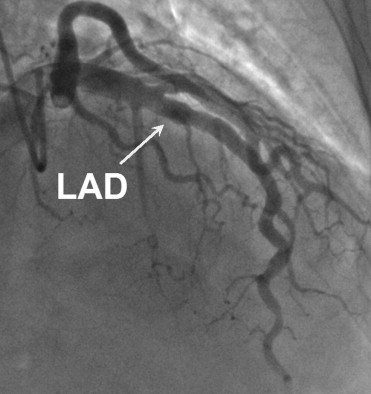
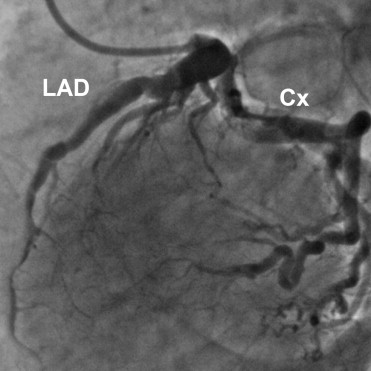
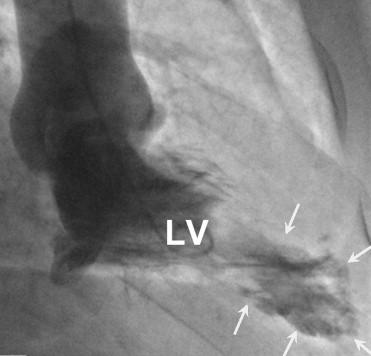
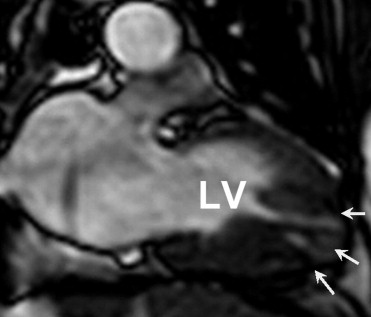
A 47-year-old man with typical chest pain at rest with an electrocardiogram showing ST-segment elevation in the anterolateral leads ( Figure 1 ) was referred with the diagnosis of an anterior wall myocardial infarction. Coronary angiography showed marked ectasia of the coronary arteries, with no obstructive lesions ( Figures 2 and 3 , Videos 1 and 2 ). Ventriculography strongly suggested severe left ventricular (LV) hypertrophy ( Figure 4 , Video 3 ). Troponin T was negative. Doppler echocardiography showed marked LV hypertrophy, with neither outflow tract obstruction nor valvular disease, and an LV ejection fraction of 55%. To better characterize this cardiomyopathy, the patient underwent cardiovascular magnetic resonance, confirming severe LV hypertrophy (interventricular septum 31 mm, posterior wall 18 mm, LV end-diastolic volume 92 ml, LV end-systolic volume 40 ml, LV mass index 169 g/m 2 ; Figure 5 , Videos 4 and 5 ). Moreover, delayed gadolinium enhancement imaging was consistent with fibrosis of the apical hypertrophied segments ( Figure 6 ).