The Implantable Cardioverter–Defibrillator
1 Medical University of South Carolina, Charleston, SC, USA
2 Cedars Sinai Medical Center, David Geffen School of Medicine at UCLA, Los Angeles, CA, USA
The implantable cardioverter–defibrillator (ICD) has undergone a remarkable transformation since it was first developed by Mirowski and colleagues1 and FDA approved for use in 1985. The early pulse generators were large, requiring thoracotomy for epicardial patch placement, and were implanted in the abdomen. This complex surgery resulted in postoperative hospitalization averaging approximately 1 week. The pulse generators had a longevity of less than 2 years and almost no diagnostic or pacing capabilities. Modern devices provide detailed information on the morphology and rates of arrhythmias, with stored electrograms (EGMs) available before, during, and after therapy. A variety of physiological parameters, including heart rate variability, activity level, transthoracic impedance, and atrial and ventricular rates, are catalogued independent of arrhythmias, and lead impedances and sensed EGM amplitudes (i.e. R waves and P waves) are measured automatically and stored in the memory. All of these data can be accessed remotely, allowing for early detection and analysis of problems with less frequent in-office interrogations needed. The downsizing of pulse generators, in combination with improvements of lead design and shock waveforms, allows the simplicity of defibrillator implantation to approach that of pacemakers, with outpatient placement now routine. Despite the marked reduction in size and increase in diagnostic capabilities, device longevity is now greater than 8 years. ICDs have the capabilities to treat multiple problems, not only life-threatening ventricular arrhythmias but also bradyarrhythmias, atrial arrhythmias with dual chamber devices, and congestive heart failure (CHF) with biventricular pacing. Most recently, subcutaneous lead systems were developed for ICDs without any transvenous components. In this chapter, the indications for use, mechanisms underlying defibrillation, design of ICD systems, as well as the practical applications of this therapy will be reviewed.
Indications and Supporting Evidence
ICD implantation was initially used for patients who had already experienced a life-threatening ventricular arrhythmia (i.e. secondary prevention). It was only later that these devices were validated for primary prevention among patients with no known history of sustained ventricular arrhythmia to prevent sudden cardiac death (SCD). A summary of the current indications for ICD therapy is given in Table 8.1.2,3
| Secondary prevention | |
| Class I | Patients with a history of sudden cardiac arrest (SCA), VF, hemodynamically unstable VT, or unexplained syncope with LV dysfunction and inducible VT |
| Primary prevention | |
| Class I | Patients with ischemic cardiomyopathy who are at least 40 days post-MI with an LVEF of ≤30–40%, NYHA functional class II or III, receiving optimal medical therapy, and have reasonable expectation of survival with a good functional status at >1 year Patients with non-ischemic cardiomyopathy, NYHA class II–III, LVEF ≤30–35%, receiving optimal medical therapy, and have reasonable expectation of survival with a good functional status at >1 year |
| Class IIa | Ischemic cardiomyopathy patients with NYHA functional class I, LVEF ≤30–35%, receiving optimal medical therapy, and have reasonable expectation of survival with a good functional status at >1 year ICD in combination with biventricular pacing in patients with NYHA functional class III or IV, receiving optimal medical therapy, in sinus rhythm with a QRS of >120 ms, and a reasonable survival expectation of >1 year Patients who are at high risk of SCA due to genetic disorders, such as long QT syndrome, Brugada syndrome, hypertrophic cardiomyopathy, and arrhythmogenic right ventricular cardiomyopathy (ARVC), and have reasonable expectation of survival with a good functional status at >1 year |
| Class IIb | Non-ischemic cardiomyopathy patients with NYHA functional class I, LVEF ≤30–35%, receiving optimal medical therapy, and have a reasonable expectation of survival with a good functional status at >1 year |
LV, left ventricular; LVEF, left ventricular ejection fraction; MI, myocardial infarction; NYHA, New York Heart Association; VF, ventricular fibrillation; VT, ventricular tachycardia.
Table 8.1 Summary of indications for ICD therapy
Secondary Prevention
The use of ICDs in patients who had survived an aborted cardiac arrest or an episode of sustained ventricular tachycardia (VT) that was refractory to antiarrhythmic drug therapy was the standard for more than a decade. The Antiarrhythmic Versus Implantable Defibrillator (AVID) study compared ICD implantation with antiarrhythmic drug use (primarily amiodarone) among patients with aborted cardiac arrest or poorly tolerated VT.4 Patients were randomized to initial therapy with an ICD or to a class III antiarrhythmic drugs. There was a significant reduction in mortality in the group randomized to ICD implantation. The benefit of the ICD was most marked among patients with a reduced left ventricular ejection fraction (LVEF) (<35%). In the Canadian Implantable Defibrillator Study (CIDS), 659 patients with VT, ventricular fibrillation (VF), or syncope were randomized to antiarrhythmic therapy with amiodarone or ICD implantation. A 20% reduction in mortality was observed in the ICD group, although this did not reach statistical significance. However, subsequent analyses have shown that an LVEF of less than 35%, age more than 70 years, and advanced CHF were characteristics of the patients who were most likely to benefit from ICD implantation.5 In the Cardiac Arrest Study Hamburg (CASH) study, 288 patients with a history of cardiac arrest were randomized to receive metoprolol, amiodarone, or propafenone, or to undergo ICD implantation. There was increased mortality in the group treated with propafenone, and a 28% decreased mortality among the patients who received ICDs.6 These studies established the benefit of ICD therapy as first-line treatment among patients with a history of life-threatening arrhythmias, particularly those with left ventricular dysfunction; thus, antiarrhythmic drugs have been relegated to adjunctive therapy to reduce arrhythmia recurrence rates.
Primary Prevention
The Multicenter Automatic Defibrillator Implantation Trial (MADIT) and Multicenter Unsustained Tachycardia Trial (MUSTT) were the first large studies of ICD use in primary prevention of SCD. These trials evaluated patients with coronary artery disease, left ventricular systolic dysfunction, non-sustained VT, and inducible sustained monomorphic VT. In the MADIT study, patients were randomized to receive either an ICD or “conventional” medical therapy, which was most commonly amiodarone.7 In the MUSTT study, patients were randomized to either no antiarrhythmic therapy or drug therapy guided by electrophysiology study. In 46% of the latter group, ICD implantation was performed because of the failure of antiarrhythmic drugs to suppress inducible arrhythmias.8 Despite these differences in study design, the results of the two trials were remarkably similar; ICD use decreased mortality by greater than 50% in these cohorts with ischemic cardiomyopathy.9
A further analysis of MUSTT indicated limited prognostic value of the electrophysiology study for risk stratification.10 Moreover, subsequent primary prevention studies simplified the identification of patients who will benefit from ICD placement, eliminating the need for electrophysiology testing. The MADIT II study was a prospective randomized trial of 1232 subjects with previous myocardial infarction (MI) and ejection fraction of 30% or less.11 Spontaneous non-sustained VT or electrophysiology testing were not required for enrollment in this trial. The ICD and control groups had similar clinical characteristics with a mean age of approximately 65 years, 67% with CHF [New York Heart Association (NYHA) class II–IV] and mean LVEF of 23%. During a mean follow-up of 20 months, the mortality rates were 14.2% in the ICD group and 19.8% in the control group.
The Sudden Cardiac Death in Heart Failure Trial (SCD HeFT) was the first large multicenter primary prevention study to eliminate the inclusion criteria of coronary artery disease. In this trial, 2521 subjects with CHF (NYHA class II and III) and left ventricular systolic dysfunction (ejection fraction ≤35%) were randomized, irrespective of etiology (i.e. ischemic or non-ischemic cardiomyopathies).12 ICD implantation, but not amiodarone, was shown to reduce all-cause mortality. Similar mortality reductions were observed among the subgroups with ischemic and non-ischemic cardiomyopathies. The Defibrillators in Non-Ischemic Cardiomyopathy Treatment Evaluation (DEFINITE) study randomized 458 subjects with dilated, non-ischemic cardiomyopathy and frequent ventricular ectopy to receive an ICD or optimal medical therapy. There was a strong trend toward a mortality reduction in the ICD cohort, and a significant reduction in the incidence of SCD.13
Other Indications
One cohort that is particularly difficult to manage is those patients with structural heart disease and a history of syncope. These patients have been excluded from most prospective, randomized studies because, on the one hand, they do not have documented arrhythmias to be included in secondary prevention studies, and, on the other hand, they cannot be classified as asymptomatic for inclusion in primary prevention trials. Present guidelines recommend ICD implantation in patients with dilated cardiomyopathy or structural heart disease and syncope of undefined cause.2,3 Another group of patients in whom ICD implantation may be indicated are those with hypertrophic cardiomyopathy who have at least one major risk factors for SCD.14 These risk factors include a history of VT (sustained or non-sustained detected by Holter monitor), recurrent syncope, a family history of sudden death, exercise-induced hypotension, and marked septal thickness (>30 mm). ICD use is also becoming more common among patients with primary electrical disease, such as the Brugada syndrome,15 arrhythmogenic right ventricular (RV) cardiomyopathy, and long QT syndrome, particularly among patients with a history of marked QT prolongation and cardiac arrest or syncope.16 There are several other systemic conditions, such as sarcoidosis and myotonic dystrophy, that are associated with increased incidence of sudden death. The use of ICDs in these populations is evolving as there is a paucity of controlled studies to guide clinical practice. Current indications of an ICD implantation are illustrated in a simplified flowchart in Figure 8.1.
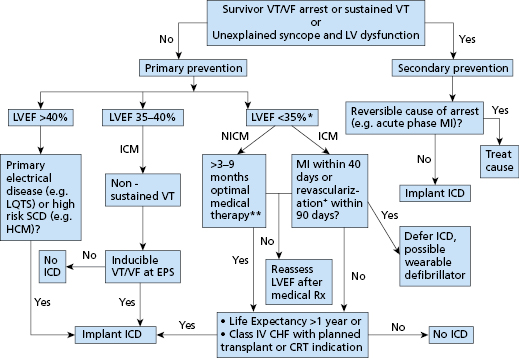
High-Risk Patients Who Do Not Benefit from ICDs
Not all high-risk groups benefit from ICD implantation, as shown by the Coronary Artery Bypass Graft (CABG) Patch, Defibrillator in Acute Myocardial Infarction Trial (DINAMIT), and Immediate Risk Stratification Improves Survival (IRIS) trials. In the CABG Patch trial, patients with ischemic cardiomyopathy and an abnormal signal-averaged electrocardiogram (SAECG) were randomized to receive an ICD or no antiarrhythmic treatment at the time of CABG surgery. No effect on mortality was observed with ICD use in this cohort.17 The DINAMIT study evaluated patients with acute MI, left ventricular systolic dysfunction, and reduced heart rate variability (HRV). No mortality benefit was observed with ICD implantation.18 The IRIS trial had a very similar design with similar outcomes.19 The reasons for the failure of these studies to show a benefit of ICD therapy are unclear. The use of non-invasive risk stratifiers, such as signal-averaged ECG or heart rate variability, may be insufficient to identify a high-risk cohort. Also, the competing mortality risks early post-MI may offset any benefit of ICD therapy. This was suggested by a subsequent analysis of DINAMIT showing that increased non-arrhythmic death offset the benefit of a reduction of arrhythmic death in the ICD arm.20 However, these studies have clearly demonstrated that clinical trials and not “common sense” need to guide the decision to implant devices. Table 8.2 summarizes the major ICD trials for primary prevention of SCD.
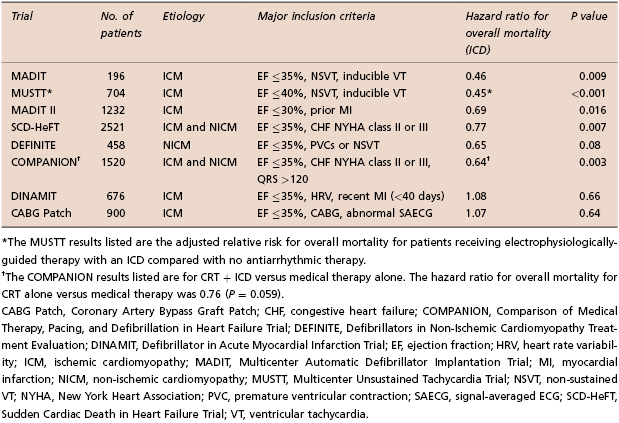
Table 8.2 Selected ICD trials for primary prevention of sudden cardiac death (SCD)5–11
One major challenge today is to develop better methods to risk stratify patients for SCD, allowing clinicians to implant devices only in those patients who will be likely to use them appropriately. The major trials for primary prevention mentioned above have shown that only approximately one-third of patients who receive ICDs for primary prevention will receive an appropriate shock for a ventricular tachyarrhythmia over 4–5 years. The results of retrospective analyses of clinical predictors of ICD shocks or mortality generally show that the incidence of shocks or mortality increases with the severity of heart failure, the lower the ejection fraction, QRS prolongation, atrial fibrillation, renal failure, and age. Clinical scores were developed to help identify subgroups of patients most likely and least likely to benefit from ICDs for primary prevention of SCD.21 In contrast to clinical factors, markers of arrhythmia vulnerability such as T wave alternans have been less useful for risk stratification of subjects in randomized trials.22
Finally, perhaps the most important dilemma with regard to prevention of SCD and prophylactic use of ICDs is the fact that most of the SCD victims do not meet current indications for ICD implantation. Population-based studies from both Maastricht, the Netherlands, and Oregon have shown that about one-half of SCD victims had an LVEF of greater than 50% prior to their event, and only 20–30% of these patients had severe left ventricular dysfunction that warranted ICD implantation according to current guidelines.23,24 In order to make an impact on the absolute number of sudden deaths per year, further studies are needed to identify those patients who are at high risk for SCD, but do not have advanced structural heart disease.
Fibrillation and Defibrillation
Effect of Shocks
An electrical stimulus interacts with cardiac cells via its resultant electrical field, which is proportional to the local rate of change of the applied voltage with respect to distance (spatial derivative). The cardiac response to the shock is determined by the passive and active (ion channel) properties of cell membranes, properties of electrical connections between cells, and possibly by direct effects on intracellular events such as calcium release.
The electrophysiological requirement for defibrillation may be contrasted with the requirement for pacing. Pacemakers deliver a stimulus through closely-spaced electrodes sufficient to depolarize local myocardium during diastole (phase 4 of the action potential) and initiate self-propagating depolarization. In contrast, initiation and termination of VF by shocks requires an electrophysiological effect throughout both ventricles during the plateau or repolarization phases of the action potential (phases 2 and 3, respectively). Shocks may have both direct effects related to the strength of the local electrical field and indirect effects related to the creation of virtual electrodes, secondary sources of electrical potential in tissue sites remote from the stimulating electrodes.25
Vulnerable Zone for Shock-Induced Ventricular Fibrillation and the Upper Limit of Vulnerability
In organized rhythm, the vulnerable period is that portion of the relative refractory period of the cardiac cycle during which shocks induce ventricular fibrillation (VF). Shocks in the vulnerable period induce VF only if their strength is in an intermediate range, at or above the VF threshold and less than a limiting shock strength referred to as the upper limit of vulnerability (ULV). Clinically, the ULV is the weakest shock strength at or above which VF is not induced when the shock is delivered in the most vulnerable interval. The combination of shock coupling intervals (relative to the R wave or pacing stimulus) and shock strengths that induce VF in a regular rhythm define the vulnerable zone. It is displayed as a bounded, homogeneous, spatiotemporal region in a two-dimensional display defined by time (coupling interval) on the abscissa and shock strength on the ordinate (Figure 8.2, left panel).26–29
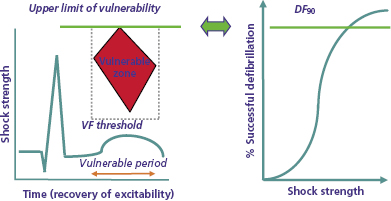
The leading hypothesis for the mechanism by which shocks induce VF is shock-induced formation of a “critical point’ around which re-entry occurs. Two types of critical points have been described. Winfree used topological principles to predict that shocks initiate VF through the spatiotemporal co-incidence of critical values of local electrical field strength and refractoriness forming a “critical point” around which unidirectional block and re-entry occur.27 Subsequently, Efimov et al. used optical mapping to identify “phase singularities” caused by shock-induced virtual electrodes that result in adjacent regions of depolarization and hyperpolarization, around which re-entry occurs.25 An alternative hypothesis postulates that shocks trigger VF by initiating delayed afterdepolarizations (DADs).30
Fibrillation
The dominant mechanism of VF is re-entry. The traditional theory of re-entry is based on slow conduction in relatively refractory myocardium and conduction block. It conceptualized VF as meandering wavefronts of activation following varying paths determined by changing locations of refractoriness and conduction block. Newer studies emphasize the importance of wavefront splitting (“wave break”) caused by dynamic properties of conduction and restitution, and generation of new wavefronts when the leading edge of one wavefront interacts with the trailing edge of another.31 Some studies have identified approximately repeatable activation fronts over a short period of time, which could be explained by either anchoring of a meandering wavefront or a stable “mother rotor” splitting into multiple daughter wavefronts.32 The distinction is potentially important, since the “mother rotor” hypothesis implies that successful electrical therapy need only terminate this source rotor. However, present evidence favors a model of VF involving independent wavefronts rather than a mother rotor, and defibrillation therapy focuses on this model.
ICD Pulse Generators
ICD pulse generators (Figure 8.3) include a clear plastic header, to which the leads are attached, and a titanium casing or “can” that houses the electronic components. These include the battery; “hybrid” circuit board; telemetry communication coil; and high-voltage components, including the transformer, capacitor, and output circuitry. Present transvenous ICDs package these components into a can with a volume in the range of 30–35 cm3.33
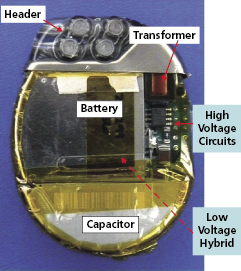
The hybrid board consists of electronic circuits and components embedded in a silicon wafer, including the microprocessor (“mini-computer”), which has two main functions: (1) it processes incoming electrical signals, either transmitted commands sent from the programmer and received by the telemetry circuitry or cardiac signals transmitted via the leads, after these signals are filtered and amplified; and (2) it stores device diagnostics and EGMs, which can be downloaded to the programmer or remote-monitoring base station.
We provide brief discussions of batteries, high-voltage capacitors, high-voltage circuitry, and defibrillation waveforms.
Batteries
At implant, the battery’s electrochemical potential represents the total energy available to the ICD over its service life for all monitoring, processing, and therapeutic functions. Unlike pacemaker batteries, ICD batteries must be able to deliver high current (up to 3 A) and high power (up to 10 W) for several seconds to charge the high-voltage capacitors; in addition, they must be able to deliver high current consistently over the battery’s service life. Like pacemaker batteries, performance over time must be predictable to provide an elective replacement indicator.
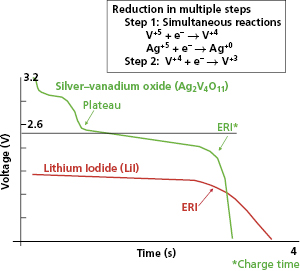
Most ICD batteries consist of lithium anodes and silver–vanadium oxide (Ag2V4O11) cathodes, often abbreviated as Li–SVO. This chemistry can deliver high current and has the advantages of using measured voltage as an indicator of battery status. Unlike the iodide cathode in lithium iodide batteries used in pacemakers, the SVO cathode is reduced in multiple steps (Figure 8.4). The first corresponds to the reduction reactions  and
and  . It results in a progressive decrease in cell open-circuit voltage from the initial value of about 3.2 V to about 2.6–2.7 V. Providing there is enough lithium anode, a second reduction of SVO occurs corresponding to the reaction
  . This results in a long voltage plateau between 2.6–2.7 V and about 2.4 V, referred to as “middle of life” (MOL). Note that the cell voltage during charging (loaded voltage) is significantly less than the open circuit voltage.34
The first Li–SVO batteries had excess lithium in comparison with SVO. Most of these cathode-limited batteries were subject to build up of a high-resistance film coating on the lithium anode. The large internal voltage drop across this film increases the battery’s internal resistance and transiently reduces its output (loaded) voltage (Figure 8.5). This problem is worst around the MOL plateau if the battery has not been pulsed recently by charging the high-voltage capacitor. High current pulses remove lithium from the film and make it thinner. All cathode-limited SVO cells exhibit substantial prolongation of charge time toward their elective replacement time.
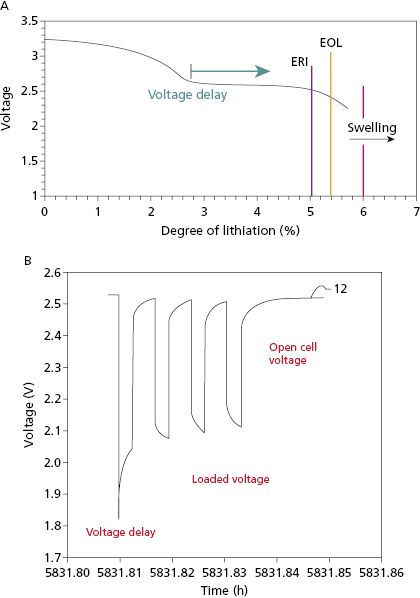
Anode-limited Li–SVO batteries have less lithium and more SVO. There is only sufficient lithium to reduce SVO once. There batteries reach elective replacement time before MOL voltage delay occurs so that charge times remain short throughout their service life, without the need for frequent pulsing of the battery. The trade-off is that these “charge–time optimized” batteries have slightly lower energy density than cathode-limited batteries. Another solution to the problem of voltage delay is to use a secondary battery to maintain the voltage on a cathode-limited Li–SVO battery when necessary. The secondary battery uses a lithium anode with a carbon monofluoride (CFx) cathode.
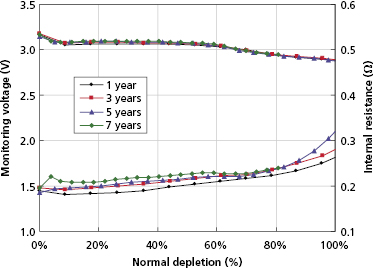
An alternative battery design uses a lithium anode with a manganese dioxide cathode (LiMnO2). This design is not subject to voltage delay and thus provides stable charge times up to elective replacement time without battery pulsing. Because the open cell voltage remains nearly constant until elective replacement time, it cannot be used to monitor battery status (Figure 8.6). Instead, elective replacement time is based on a measure of total charge delivered over the service life.
The High-Voltage Capacitor
A capacitor consists of two conductors, separated by an insulator (dielectric; Figure 8.7). Capacitors serve three functions: (1) store electrical charge on the surface of the conductors; (2) determine the duration required to deliver the defibrillation shock waveform; and (3) store electrical energy in the field between the two conductors.
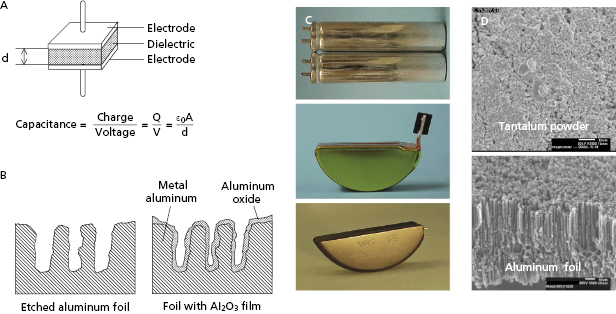
When a parallel plate capacitor (Figure 8.7) is charged, the conductor at higher potential receives a charge Q, and the conductor at lower potential receives an equal and opposite charge so the net charge on the capacitor is zero. Capacitance (C) is the capability to store charge as a function of voltage. It is defined as the ratio of the charge on either conductor to the potential difference (V) between them:

The right side of the equation indicates that capacitance is directly proportional to the surface area of each conductor (A) and inversely proportional to the distance (d) separating them. It is also directly proportional to the effectiveness of the dielectric in the space separating them, as measured by the dielectric constant (k). The final term in the equation (ε0 ) is a fundamental physical constant that defines the ability of a vacuum to store energy in an electric field, known as the electrical permittivity of free space. Thus, capacitance is maximized by a design in which conductors with large surface area are separated by thin but highly effective dielectric insulators.
The rate at which the capacitor is discharged determines the duration of the defibrillation waveform. When a capacitor charged to a voltage V is discharged, the voltage decays exponentially as a function of time:

where t is the time since the start of the discharge and τs is the shock system time constant, the time for voltage to decrease to 1 − e −1 (about 37% of the initial value). Since τs = RC (where R is the pathway resistance), voltage as a function of time is given by:

Voltage approaches zero asymptotically, slower for a large capacitance and high-resistance defibrillation pathway and faster for a small capacitance and low-resistance pathway.
The energy stored in a capacitor (Estd ) is given by:

This equation links stored energy—the key determinant of ICD size—to the voltage stored on the capacitor, which—except for minor voltage loss in the output circuit—is equal to the initial shock waveform voltage (Vi ). “Delivered energy (Edel ),” has no direct influence on either defibrillation or ICD design. It is calculated most simply by subtracting the final (residual) energy stored in the capacitor at the end of the waveform from the initial stored energy:

where Vf is the “final” or trailing edge voltage (Figure 8.8).
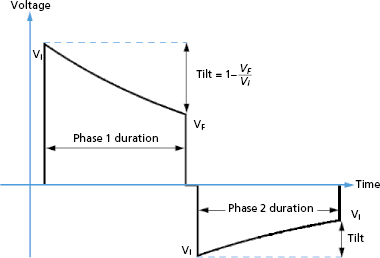
ICD capacitors have an energy density that ranges from 3 J/cm3 for aluminum capacitors to 5 J/cm3 for tantalum capacitors. Higher energy density reduces pulse generator size. For example, to store 40 J of energy requires minimum component volumes (without housing) of about 13 cm3 for aluminum capacitors and 8 cm3 for tantalum capacitors. In comparison, batteries have an energy density of over 3000 J/cm3, hundreds of times greater. However, capacitors need only to store energy for one shock, while batteries must store all the energy used by all ICD functions over their service life.
ICD high-voltage capacitors are electrolytic capacitors, most often using aluminum or tantalum anodes (positive electrodes) and electrolyte solutions for the cathode. The anodes are processed to achieve a large surface area, increasing capacitance. For aluminum capacitors, the anode starts as a thin foil that has been etched to create a large number of tunnels (Figure 8.7). Tantalum capacitors use an anode made from tantalum metal powder pressed into a porous pellet and heated until the metal particles bond to each other (sintered), but still remain porous. For either material, a dielectric oxide film is grown (formed) electrochemically on the surface of the anode. Although tantalum capacitors have higher energy density than aluminum capacitors, they are also denser and cannot be charged to as high a voltage. ICDs use either two aluminum or three to four tantalum capacitors in series to achieve leading edge shock voltages of 750–900 V.
If aluminum capacitors are not charged periodically, microscopic imperfections develop in the dielectric oxide film, and the dielectric begins to “leak,” permitting current to flow through these imperfections during capacitor charging. As a result, charging is less efficient and the charge time increases 20–50%. Note that mid-life voltage delay in Li–SVO batteries also results in increased charge times, and delays in excess of 50% usually are due to battery voltage delay. Deformation is less of an issue for tantalum capacitors than aluminum ones.35
When the capacitor is charged after prolonged disuse, the strong electrical field created by charging regrows the dielectric layer, sealing the leaks and restoring charge time. Regrowth is fastest where the dielectric is thinnest (at the leaks). The process by which charging the deformed capacitor to high voltage regrows the oxide dielectric layer is known as capacitor reformation. The rate at which the oxide layer regrows is proportional to field strength and duration,35 with a time constant measured in minutes. For efficient reformation, the capacitor is discharged through a high resistance to maintain its charge for several minutes. Thus, therapeutic or aborted shocks do not efficiently reform capacitors because they charge the capacitor for only a few seconds.
Each capacitor reformation consumes 0.5–1% of battery life, so capacitors should not be reformed more frequently than required. Typically, capacitors need reforming at about 6-month intervals. To maintain short charge times, ICDs automatically reform the capacitor, typically at programmable intervals. Unlike battery voltage delay, the rate of capacitor deformation is independent of the age of the ICD, and thus capacitors do not need to be reformed more frequently as the ICD ages. However, the same charging process may be used to reform capacitors and reverse battery voltage delay.
ICD Circuitry
The high-voltage charging circuit (Figure 8.9) converts the low-voltage output of the battery to the high-voltage output that charges the output capacitor for delivery of the shock. This circuit operates under daunting constraints: First, both the battery and shock are direct current (DC) elements, but the physics of transformers requires alternating current (AC), because only a changing electric field stores energy in the transformer’s magnetic field. Second, the voltage step-up is huge, over two orders of magnitude (from about 2 V in the loaded battery to over 800 V in the charged capacitor). Third, the circuit must be small, lightweight, and efficient. Fourth, it must not generate cross-talk in the ICD’s highly-sensitive sensing circuitry.5 The circuit should charge the capacitor as fast as possible so that a shock is not delayed after VF is detected. However, charging the high-voltage circuit places great current drain on the battery, which reduces the loaded battery voltage; voltages below about 1.5 V may result in failure of the ICD’s control circuitry and inability to deliver a shock. The last problem is addressed by a compromise that reduces current drain and increases charge time to maintain a minimum voltage for other ICD circuits.
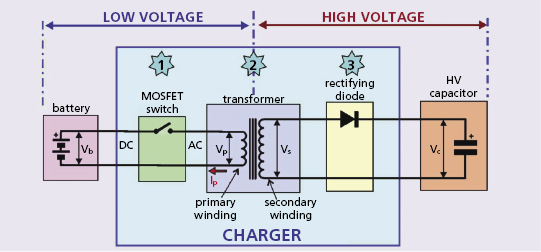
The ICD’s “DC-to-DC” or “fly back” transformer generates AC by rapidly opening and closing a switch (typically with a frequency 30–100 kHz) in the circuit between the battery and the transformer. This is referred to as “chopping” the battery’s output. The switch is kept open for about 10 μs, allowing charge to flow onto the primary winding and storing energy in the magnetic field of the transformer’s ferromagnetic core. The speed of switching is dictated by the maximum magnetic field strength of the transformer coil, composed of a high-frequency magnetic iron ceramic that saturates at about 0.3 T.
The efficiency of charging circuits is in the range of 50%, so that storing 40 J of energy on the capacitor drains the battery of 80 J. Consider the required current and power: a typical battery consists of two cells in parallel, each with an open cell voltage of about 3 V and loaded cell voltage of about 2 V, so the terminal voltage during charging is about 4 V. If current flows from the battery at an average of 2 A, the power output is 2 A × 4 V = 8 W in the primary circuit. In 10 s, this permits 80 J to flow into the transformer’s primary winding and 40 J to flow from the secondary winding into the capacitor.
The circuit through which the capacitor discharges the shock must tolerate both high voltages and high currents. For example, if an 800-V shock is delivered into a 40-Ω defibrillation pathway, the peak current is 20 A, in a range that trips household circuit breakers. Current flow in these circuits is regulated by switches that are both robust and respond rapidly during the shock. They are referred to as insulated gate bipolar transistors (IGBTs). These switches both reverse polarity after phase 1 of the biphasic waveform and truncate the waveform based on tilt or duration.
Because the risk of arcing or shorting increases non-linearly with voltage, high-voltage components in the can and header must be properly spaced and insulated from low-voltage components to prevent catastrophic electrical overstress failure due to high current flow in low resistance pathways. Some ICDs have operated these circuits near their tolerance level, and various forms of arcing from high-voltage circuits have been responsible for both isolated and systematic ICD failures.36
Lead abrasions in the pocket resulting in insulation defects between the active can electrode and high-voltage conductor of opposite polarity (to the right ventricular defibrillation coil) provide a particularly challenging problem. Consider an 800-V shock delivered into an insulation defect with an 8-Ω resistance. The resulting peak current is 100 A, more than enough to trip any household circuit breaker and cause catastrophic damage to the output circuit. To prevent such destructive peak currents, modern ICDs have a shorted high-output protection feature that aborts the shock if the peak current exceeds the performance rating of the output circuit. This prevents the shock from being delivered, but the assumption is that the shock would not reach the patient if the pathway resistance is too low.
ICD Leads
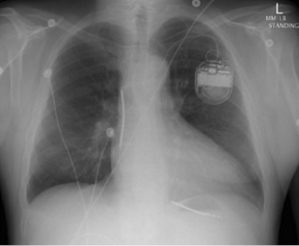
Transvenous leads are the “weak link” in the ICD system. They are the most common component to fail and have been the subject of much controversy over the past decade.37,38 Early ICD leads implanted before the mid 1990s had a co-axial design, similar to pacing leads. Typically, the tip conductor would be central with the ring conductor and then the defibrillation conductor more peripheral. Few remain in service. Modern ICD leads are multilumen, with conductors running in parallel through a single, flexible insulating lead body consisting of silicone, polyurethane, or fluoropolymers. The advantages of this design include greater space efficiency resulting in smaller leads, and greater resistance to compressive forces by including extra lumens within the lead body. Figure 8.10 illustrates a schematic and diagram of a modern ICD lead design. A radiograph of a single-lead system, including a dual-coil integrated defibrillation lead and an active left pectoral pulse generator, is shown in Figure 8.11. The sensing electrodes of defibrillation leads can either be “true bipolar” or integrated bipolar (Figure 8.10). For true bipolar sensing, dedicated small surface area electrodes are used as the cathode or anode, similar to a pacing lead. For integrated or extended bipolar sensing, the distal RV defibrillation coil serves as the anode for sensing. This allows the lead design to have one less electrode, but it may be prone to oversensing of remote signals such as diaphragmatic myopotentials, particularly in older generation systems.
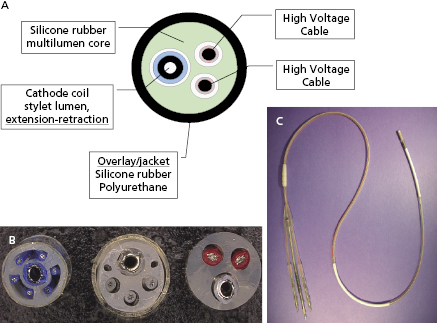
Lead insulation can have an important impact on long-term stability and function. Silicone is inert, biostable, and biocompatible, but has a high co-efficient of friction. It is soft, making it prone to damage during implantation, and can swell over time. Polyurethane is biocompatible, and has a high tensile strength, making small lead diameters possible, and a low co-efficient of friction, but is prone to environmental stress cracking and metal ion oxidation, which cause insulation breaches and lead failure. Previous reports highlighted the high failure rate of polyurethane leads,39 particularly those with a co-axial design, so they are avoided given the superiority of alternative insulators. Fluoropolymers [e.g. polytetrafluoroethylene (PTFE) and ethylene-tetrafluoroethylene] are the most biocompatible materials and have high tensile strength, allowing small lead size, but are stiff and susceptible to damage from traction when the lead migrates; they are prone to insulation micro-defects, and have a difficult manufacturing process. Contemporary lead systems have an insulating body made of silicone, in some instances supplemented by an outside polyurethane layer to reduce friction, abrasion, and scar formation (and not for insulation). Metal ion oxidation is avoided as polyurethane is not in direct contact with the conductors. The conductors are often insulated with an extra thin layer of fluoropolymer. Coating of leads with expanded PTFE or backfilling shocking coils with medical adhesive has been shown to reduce tissue ingrowth into the lead coils and thereby make future extraction easier, if necessary.40
Defibrillation Waveforms
The waveform of an electrical pulse is the temporal pattern of its amplitude, measured by voltage (or current). An ICD’s shock waveform interacts with cardiac electrical activity via its electric field, which is the instantaneous spatial derivative of shock voltage. The response of the heart to the shock field is mediated by the passive and active (ionic channel) properties of cell membranes, properties of electrical connections between cardiac cells, and possibly the direct intracellular electrical effect.
The waveform parameters that most directly influence defibrillation are voltage and duration. Voltage is a critical parameter because its spatial derivative defines the electrical field that interacts with the heart. Similarly, waveform duration is critical because the shock interacts with the heart for the duration of the waveform. Further, the heart’s response to a defibrillation shock occurs over a period that depends on time-dependent passive and active ion-channel processes of cardiac cell membranes, as well as time-dependent intracellular and tissue properties, collectively referred to as the time constant of cardiac tissue (τm , pronounced “tau” with the subscript “m” for cell membrane).41–44 Thus, the electrical measure of defibrillation that is most relevant physiologically is voltage (or voltage gradient) as a function of time.
Shock energy is the most often cited metric of shock strength and an ICD’s capacity to defibrillate, but it is not a direct measure of shock effectiveness. However, the maximum energy stored in an ICD’s output capacitor is a major determinant of the size of the battery and capacitor, and thus the overall size of the pulse generator. Since minimizing pulse generator size is an important clinical goal, designing ICDs that defibrillate with minimum stored energy is an important engineering goal.
Schuder & Stoeckle first reported that transthoracic defibrillation was more effective when the waveform discharge was stopped (truncated) rather than being allowed to decay indefinitely (untruncated),45 and most, but not all, studies of ICD waveforms support the benefit of truncation. A single capacitor can produce a biphasic waveform if the polarity of the output circuit is reversed after truncation, and this is the mechanism by which ICDs generate biphasic waveforms (Figure 8.8).
Truncation may be defined either by waveform duration or “tilt.” Tilt is defined by the expression:

where VF is the final (“trailing edge”) voltage and Vi is the initial (“leading edge”) voltage (Figure 8.8). Consider a capacitive discharge waveform that is truncated after one time constant (τs ) so that the final voltage is 37% of the leading edge voltage. This corresponds to a tilt of 63%. Historically, waveform truncation was first performed by tilt for engineering reasons. Commercial ICDs use either tilt or duration for truncation, depending on the manufacturer. Empirically, both approaches can produce efficient waveforms using the capacitors in current biphasic waveform ICDs with standard transvenous leads.46
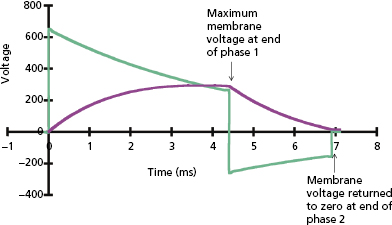
Currently, no comprehensive theory permits design of ICD waveforms from first principles. However, a passive resistor–capacitor (RC) network model,47 first developed in the 1930s and subsequently applied to modeling defibrillation waveforms, provides rough estimates that have been used clinically.48 The model has two principal assumptions: (1) the goal of a monophasic shock and the first phase of a biphasic shock is to maximize the voltage change in the cardiac cell membrane at the end of the shock for a given stored energy—thus, its optimal duration relates to the membrane’s time constant τm , and (2) the goal of the second phase is to discharge the membrane potential back to the zero potential, removing the charge deposited by the first phase,6 sometimes referred to as “charge balancing” or “charge burping”44,49 (Figure 8.12). It is remarkable that a model based on such a simplistic approximation can provide clinically useful guidance for optimizing defibrillation waveforms. One of its most important predictions relates to the strength–duration relationship for defibrillation.
The plot of defibrillation threshold (DFT; usually leading-edge voltage) as a function of waveform duration is known as the defibrillation strength–duration curve, analogous to the strength–duration curve for pacing. Since there is no true DFT, the plotted value may be considered as the shock strength required to achieve a given probability of defibrillation, such as 90%; but for simplicity we refer to it as the DFT. As shown in Figure 8.13, the effect on DFT of equivalent change in duration is much greater at short durations than long durations. The long-duration asymptote for DFT (the lowest value for an infinite pulse width) is referred to as the rheobase. The chronaxie is defined as the duration of a waveform that has a DFT of twice the rheobase amplitude. The chronaxie is close to the membrane time constant (τm ).
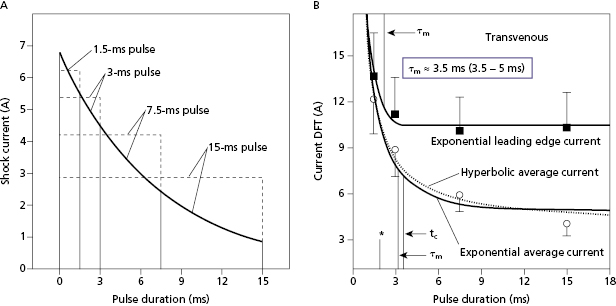
For square waves, the RC model predicts that the waveform duration that minimizes stored energy has a duration equal to the chronaxie. For capacitive-discharge defibrillation waveforms, the pulse duration for minimum energy is a “compromise” between the optimal duration for response of the cell membrane (chronaxie or τm ) and the optimal duration for the capacitor to deliver its charge (system time constant, τs = RC), shorter for small capacitors and low-resistance pathways and higher for large capacitors and high-resistance pathways.35
The physics of capacitive-discharge waveforms links the energy stored in the ICD’s capacitor to the voltage and duration of the delivered defibrillation waveform. Stored energy is proportional to capacitance and the square of voltage. Further, the time dependence of a capacitive-discharge exponential waveform is given by the system time constant τs
Stay updated, free articles. Join our Telegram channel

Full access? Get Clinical Tree


