Components of a Pacing and ICD System: Basic Concepts of Pacing
1 Medical College of Virginia/VCU School of Medicine, Richmond, VA, USA
2 Mayo Clinic School of Medicine, Rochester, MN, USA
3 Hospital of the University of Pennsylvania, Philadelphia, PA, USA
Introduction
Modern day pacemakers serve the primary function of either maintaining a minimum heart rate to avoid symptomatic or potentially life-threatening bradyarrhythmias or offering resynchronization between the left and right ventricles in the setting of heart failure. However, multiple advances in device design, programming, sensor technology, and materials science have afforded the ability to offer an ever-widening range of devices with a variety of specialized features. In this chapter, we focus on the basic principles underlying cardiac pacing and then touch on several aspects of lead, device, and algorithm design.
Electrophysiological Considerations
Electrical Excitability of the Cardiac Myocyte
Excitability of biological tissues such as nerve and muscle refers to their ability to respond to a specific stimulus.1,2 Myocytes at rest have a separation of charge across the cell membrane, resulting in an electrical transmembrane potential. This potential is created by differences largely in the concentration of sodium and potassium ions on the outside and inside of the cell (Figure 2.1). The phospholipid bilayer of myocardial cells is characterized by a high resistance to flow of ions through the cell membrane that may be overcome by the activation of a variety of transport pumps, including the Na+/K+-ATPase exchange pump and Na+/Ca2+ transport mechanisms. Both of these transporters cause net exchange of three positive charges out of the cell in exchange for two positive charges into the cell, resulting in net polarization of the cell membrane with the inside of the cell maintained at a net negative charge relative to the outside (i.e. a net negative transmembrane potential). Maintaining this net negative potential requires energy expenditure in the form of adenosine triphosphate (ATP).
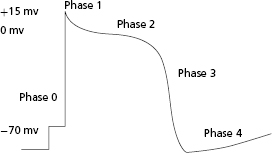
Excitable tissues have the ability not only to generate but subsequently to propagate a transmembrane action potential that depends on the opening and closing of a variety of membrane-based ion transporters. Once a threshold potential is reached, several transport mechanisms are activated, allowing for influx of sodium ions into the cell. This results in an initial upstroke of the action potential curve (phase 0). In addition to sodium channels, potassium, calcium, and chloride ion transporters are also activated for varying durations. At the end of phase 0, there is a short period where the transmembrane potential is positively charged. During phase 1, the membrane potential partially repolarizes with the activation of the transient outward potassium current (Ito). Phase 2 is the plateau phase of the action potential. During this time, the myocyte is refractory to further electrical stimulation; the net membrane voltage is approximately 0 mV as inward sodium and calcium currents are balanced by slow, rapid, and ultrarapid outward potassium currents. After the plateau phase (which can last up to several hundred milliseconds), the cardiac cell begins to repolarize as outward currents exceed inward currents, resulting in regeneration of the resting membrane potential (phase 3). During this phase, there is net negative polarization of the inside of the cell and another action potential may be induced if the myocyte is challenged by an electrical stimulus of sufficient strength. After complete repolarization of the membrane, the cell enters a diastolic period (phase 4) during which it is fully excitable. Different myocytes may exhibit variable action potential profiles (e.g. cells capable of spontaneous automaticity exhibit gradual upward drifts in transmembrane potential until threshold is reached) (Figure 2.1).
Propagation of Electrical Stimuli
The response of excitable membranes to electrical stimuli is an active process, requiring delivery of a stimulus of sufficient strength to initiate the process of cellular depolarization. Signals initiated in one region of the heart are subsequently propagated from cell to cell via low-resistance intercellular connections termed gap junctions. Thus, the action potential at the site of stimulation results in the depolarization of neighboring myocytes. Propagation of the action potential away from the site of electrical stimulation also depends on the cable properties of the myocardium, including the axis of myofiber orientation and the geometry of the connections between fibers.3 For example, a wavefront of depolarization will be conducted with a conduction velocity three to five times greater along the longitudinal axis of a myofiber than along the transverse axis. Such anisotropic conduction properties are further exaggerated in the presence of myocardial fibrosis, in which the intercellular collagen matrix is increased and there is decreased cell-to-cell communication. As the structure of cardiac tissue is affected by pathological conditions such as fibrosis or infarction, the physiological properties of conduction and excitability may be significantly altered. Thus, the location of pacing stimulus delivery may impact the strength of the stimulus required to achieve cardiac depolarization and the rapidity with which such a stimulus will achieve activation (e.g. pacing in an area of dense scar may require a longer time to ventricular activation than pacing in an area of healthy tissue).
Basic Concepts of Pacing
Cardiac myocytes may be “activated” by the delivery of an electrical pacing stimulus. This stimulus creates an electrical field that allows for the generation of a self-propagating wavefront of action potentials that may then advance from the stimulation site. However, if the stimulus is not of sufficient amplitude or duration, it may not initiate such a wavefront. The minimum amplitude and duration required to generate the self-propagating wavefront that results in cardiac activation is referred to as the threshold.
In order to provide for consistent myocardial stimulation, there needs to be a constant source of energy for pulse delivery, which is provided by the pulse generator, a conductor that will deliver the stimulus from the source, which is the lead itself, an electrode at the end of the conductor that delivers the pulse, and underlying myocardium that is excitable. Failure at any of these points (e.g. due to fracture in the lead or loss of contact between the electrode and the underlying myocardium) will result in failure of myocardial stimulation.
When considering pacemaker stimulation of the myocardium, several important concepts need to be understood that define the stability and the integrity of the circuit responsible for myocardial stimulation. Generally, when evaluating proper pacemaker function, these concepts are enveloped by parameters evaluating sensing, impedance, and threshold. Subtle considerations need to be understood within the concept of each parameter, and how they may individually be affected over time or in the context of changes in physiological variables.
Currently available pacing systems comprise a pulse generator and one or more pacemaker leads with lead tips positioned in the cardiac chamber of interest. While leadless pacemaker systems are under development and being tested in early clinical studies, these are not currently available for clinical use and will not be further discussed. The lead in the traditional pacemaker system serves as the conduit of electrical signals between the myocardium and pacemaker generator. Depending on the individual components and programming, pacing and sensing may be accomplished in unipolar or bipolar configuration.
Bipolar Versus Unipolar Sensing
Sensing of local electrograms (EGMs) is essential to the proper function of permanent pacemakers. Whether sensing takes place in a unipolar or bipolar system and despite the differences between the two, the principles of sensing remain the same. Two electrodes, a cathode and an anode, are required to complete the electrical circuit between the body and the pacemaker. In a bipolar system, both anode and cathode are located in the heart, whereas in a unipolar system only the cathode is located in the heart and the pacemaker generator can serve as the anode. Intracardiac electrical signals are produced by the movement of electrical current through the myocardium. An electrode that overlies a region of resting myocardium records from the outside of cardiac myocytes. As a wavefront of depolarization travels toward an endocardial electrode in contact with resting myocardium, the electrode becomes positively charged relative to the depolarized region. This is manifest in the intracardiac EGM as a positive deflection. As the wavefront of depolarization passes under the recording electrode, the outside of the cell suddenly becomes negatively charged relative to resting myocardium, and a brisk negative deflection is seen in the intracardiac EGM (Figure 2.2). The moment of myocardial activation at the site where the electrode is in contact with myocardium co-incides with the moment the negative deflection in the intracardiac EGM crosses the abscissa (bipolar EGM) or with the peak slope of the intrinsic negative deflection (unipolar EGM). The positive and negative deflections that precede and follow the intrinsic deflection represent activation in neighboring regions of myocardium relative to the recording electrode.
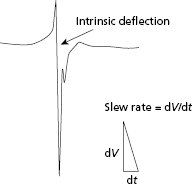
Sensing of the intracardiac EGM is determined by the signal amplitude, measured in peak-to-peak voltage, and the slope of the intrinsic deflection of the electrogram.4 This peak slope of the intrinsic deflection of the EGM is also termed the slew rate. In general, the higher the slew rate of an EGM, the higher the frequency content. This frequency content is critical to the ability of the sense amplifier to properly process the signal, with most sense amplifiers being most sensitive to signals at a range of 30–40 Hz. Components of the EGMs below or above this frequency may not be properly sensed. However, the slew rate and peak-to-peak voltage are not always directly proportional. Thus, slow and broad signals with a low slew rate may not be sensed, even if the peak-to-peak amplitude of the EGM is large.
EGM amplitude is also dependent on the direction of the activation front. A bipolar EGM can be constructed by subtracting the absolute unipolar voltage recorded at the cathode (versus ground) from the unipolar voltage recorded at the anode (versus ground). Because the bipolar configuration represents the signal at the cathode minus the signal at the anode, the net EGM may be considerably different from that of either unipolar EGM alone. For example, if an advancing wavefront of depolarization is perpendicular to the interelectrode axis of a bipolar lead, each electrode will be activated at exactly the same time, and the instantaneous difference in voltage will be minimal. In this situation, the bipolar EGM will be markedly attenuated when compared with either unipolar EGM. In contrast, a wavefront of depolarization traveling parallel to the electrode axis of a bipolar lead will activate one electrode before the other, and the resulting bipolar EGM may have significantly greater amplitude than either unipolar EGM alone. Because unipolar EGMs have a broader field of view, extending from the lead tip to the can (30–50 cm in unipolar systems versus 3–5 cm in bipolar systems), the EGM in unipolar leads is less likely to be affected by such subtleties of ventricular activation. These potential differences in sensing in a bipolar versus unipolar mode are important to consider when EGM amplitude is assessed.5 Change in the direction of local activation at a bipolar electrode (e.g. during a ventricular ectopic beat or new bundle branch block) may cause significant changes in sensing amplitude measurements. Differences in interelectrode distance between bipolar and unipolar leads have an important influence on sensing of “far-field” signals as well. Due to the much smaller field of view, bipolar electrodes tend to be minimally influenced by electrical signals that originate outside the heart, while unipolar leads may detect electrical signals that originate near the pulse generator pocket. Thus, unipolar sensing is more susceptible to interference from electrical signals originating in skeletal muscle (myopotentials), which can result in inappropriate inhibition of pacing (if sensed in the ventricular channel) or triggering of pacing output (if sensed in the atrial channel).6 Thus, bipolar sensing is less prone to oversensing myopotentials, far-field cardiac signals, or electromagnetic interference from environmental sources. Shielding of the device and signal processing in the pacemaker circuitry, such as rectification and filtering of lower or higher frequency components, also help to attenuate recording of unwanted signals. Such signal processing is not perfect as there is overlap in the frequency spectrum of other non-cardiac signals, such as skeletal myopotentials. The almost exclusive use of bipolar sensing in modern devices has helped to minimize the risk of sensing far-field or non-cardiac signals. Despite all these advances, oversensing still remains a problem and needs to be considered when programming devices or reviewing intracardiac EGMs.
Bipolar Versus Unipolar Stimulation
Modern lead design has largely eliminated any significant clinical difference between bipolar and unipolar stimulation, but some inherent differences remain. Historically, the unipolar threshold was lower than the bipolar threshold in the same system due to a markedly larger anode and resulting reduced impedance in the unipolar system. With the contemporary lead tip design, this difference is attenuated as impedance is mainly determined by the lead tip properties. The clinically important implication of unipolar pacing is that the pacemaker generator may cause pectoral muscle stimulation (muscle twitching) if implanted adjacent to the pectoral muscle. Because the distance between the cathode and anode is so much greater during unipolar pacing, the pacing stimulus on the surface electrocardiogram (ECG) is also much larger than during bipolar pacing. The increased size of the “pacer spike” may be visually helpful to determine proper pacemaker function when interpreting cardiac telemetry recordings or trans-telephonic ECG tracings during remote pacemaker monitoring. Conversely, the larger amplitude signal from unipolar pacing is far more likely to interfere with appropriate sensing of the cardiac rhythm by an implantable cardioverter–defibrillator (ICD) in the rare instance that a patient has a separate pacemaker and ICD implanted. Specifically, a sensed large-amplitude unipolar pacing stimulus will result in subsequent under-detection of low-amplitude intracardiac signals, such as those that occur during ventricular fibrillation. It is for this reason that the use of bipolar pacing is critical when a separate pacemaker is present in an ICD patient. Bipolar pacing leads are also necessary for some rate-adaptive sensors, such as the minute-ventilation sensor, as well as for some types of automatic threshold algorithms, where the ring electrode is used to sense myocardial capture.
Pacing Impedance
Impedance is defined as the overall opposition to flow of current across an electrical circuit. In direct current circuits, such as pacemaker generators that follow Ohm’s law [i.e. voltage (V) = current flow (I) × resistance across the circuit (R)], the impedance and resistance are equivalent. The impedance (R) can be used to determine the current flow in the setting of constant voltage delivery. Higher impedances are associated with lower current flows in the setting of a constant voltage. Thus, pacing impedance has significant influence on battery longevity. Namely, the lower the resistance/impedance, the greater the current flow, and vice versa. Thus, the longevity of generators with a fixed amount of charge will in part be determined by the pacing impedance.
The determinants of total pacing impedance include the resistance across the lead conductor, the resistance to current flow from the lead electrode to the myocardium, and the charge of opposite polarity in the myocardium that develops at the electrode–tissue interface in the context of the stimulus delivery (polarization). The sum of these three factors equals the total impedance. However, while higher total impedance is of value to reducing current flow and thereby increasing battery life, ideally the highest impedance occurs at the electrode–myocardial interface rather than in the lead. The reason for this is that a higher resistance to flow across the lead conductor will result in a voltage drop and resultant conversion of a portion of the pacing impulse into heat, which does not contribute to myocardial stimulation. However, a high electrode resistance will help increase overall impedance and consequently minimize current flow and maximize battery life. The electrode resistance is determined by the size of the electrode (with a smaller electrode increasing resistance). Such smaller electrodes may also beneficially impact stimulation thresholds.
Routine use of leads with low intrinsic resistance but small electrode size has allowed for the creation of smaller implantable devices with greater battery longevity. A practical limitation of minimizing electrode size is impairment of contact stability, resulting in a greater risk of microdislodgement.
The polarization component of pacing impedance is related to movement of ions in the myocardium toward the cathode. Namely, the cathode attracts positively charged ions and repels negatively charged ions when an electrical current is applied to the myocardium. Thus, the cathode becomes surrounded by layers of hydrated sodium and H3O+ ions, while a layer of Cl−, HPO4 2−, and OH− ions forms farther away. This movement of charged ions induces a current flow in the myocardium and essentially a functional capacitor develops, impeding further movement of charge. The capacitor effect of polarization increases over the course of stimulus application, peaking at the trailing edge of the stimulus and decaying exponentially after completion of stimulus delivery until the charged layers completely dissolve.
This polarization impedes movement of charge in the myocardium and increases the voltage requirement for stimulation. Polarization impedance directly relates to the duration of the stimulus and is minimized by using short pulse durations. In addition, polarization impedance is related to the surface area of the electrode, with a larger surface area allowing for minimization of the polarization effect. Given that a smaller surface area is desired for maximum electrode resistance, while a larger one is desired for minimum polarization effect, electrodes with small geometric radii but a complex, porous surface that increases the microscopic surface area may be used.7 In addition, various coatings (e.g. platinum or iridium oxide) may help minimize polarization.
The variable degree of polarization at different times in the period of stimulus delivery has an impact on measurement of impedance. When measured at the leading edge of the stimulus, there is minimal polarization, and thus the measured impedance reflects only the impedance of the lead conductor and electrode. However, measurements of impedance at the mid-point of the stimulus more accurately reflect total impedance because the polarization component will be at least partially factored in.
Sensing Impedance
The intracardiac EGM is transmitted by the pacing lead from its source in the myocardium to the sensing amplifier of the pulse generator. The voltage drop that occurs from the origin of the electrical signal in the heart to the generator depends on the source impedance, which, similar to pacing impedance, includes the resistance between the electrode and the myocardium, the resistance of the lead conductor, and the effect of polarization. Unlike with pacing impedance, however, minimizing the impedance is ideal, and thus the smaller electrode area desired for increasing pacing impedance may conversely result in diminished sensing. For this reason, the trade-off in electrode size, impedance, and sensing needs to be considered in the design of any lead. Sensing impedance changes as seen in lead integrity failure (insulation damage or conductor fracture) may result in sensing abnormalities.
Stimulation Threshold
Cardiac pacing involves the delivery of a polarizing electrical impulse from an electrode in contact with the myocardium, together with the generation of an electrical field of sufficient intensity to induce a propagating wave of cardiac action potentials. The stimulating pulse may be either anodal or cathodal in polarity, although the two types demonstrate different stimulation characteristics. The stimulation characteristics are related to the source of the stimulating pulse, with constant-voltage and constant-current generators exhibiting somewhat different stimulation properties. The minimum stimulus intensity and duration necessary to reliably initiate a propagated depolarizing wavefront from an electrode is defined as the stimulation threshold. The stimulation threshold is a fundamental concept that is crucial to programming and troubleshooting permanent pacemaker systems. Stimulation threshold may vary under different physiological conditions and over time. In this section, the factors that determine the stimulation threshold will be discussed.8,9
Strength–duration Relationship
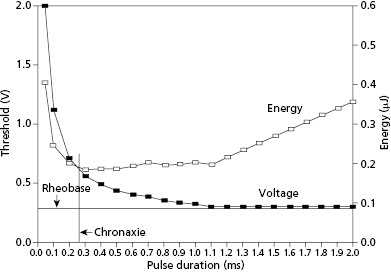
For a pacing stimulus to produce a wave of depolarization in a cardiac chamber (“capture”), the stimulus must exceed a critical amplitude (measured in volts or milliamperes) and must be applied for a sufficient duration. These factors of stimulus amplitude and duration interact so that the minimal amplitude that is required to capture the myocardium also depends on the duration of the stimulating pulse (pulse duration).10 The stimulus amplitude for endocardial stimulation has an exponential relation to the duration of the pulse, with a rapidly rising strength–duration curve at pulse durations of less than 0.25 ms and a relatively flat curve at pulse durations of greater than 1.0 ms, as shown in Figure 2.3. A small change in pulse duration is associated with a significant change in the threshold amplitude at short pulse durations, but only a small change at longer pulse durations. Because of the exponential relationship between stimulus amplitude and pulse duration, the entire strength–duration curve can be described relatively accurately by two points on the curve: rheobase and chronaxie. The rheobase of a strength–duration curve is defined as the lowest stimulus voltage that will electrically stimulate the myocardium at any pulse duration. For practical purposes, the rheobase voltage is usually determined as the threshold stimulus voltage at a pulse duration of 1.5–2.0 ms. The chronaxie is defined as the threshold pulse duration at a stimulus amplitude that is twice the rheobase voltage. Using the rheobase and chronaxie points, Lapicque, in 1909, described the following mathematical equation, which can be used to derive the strength–duration curve for constant-current stimulation:

where I is the threshold current at pulse duration t, Ir is the rheobase current, and tC is the chronaxie pulse duration. The relation of stimulus voltage, current, and pulse duration to stimulus energy is provided by the equation:

where E is the stimulus energy, V is the stimulus voltage, R is the total pacing impedance, and t is the pulse duration. The chronaxie pulse duration is important in the clinical application of pacing, as it approximates the point of minimum threshold energy on the strength–duration curve. With pulse durations greater than the chronaxie, there is relatively little reduction in the threshold voltage. Rather, the wider pulse duration results in the wasting of stimulation energy without providing a substantial increase in safety margin. At pulse durations less than the chronaxie, there is a steep increase in threshold voltage and stimulation energy. Note from the equation relating the stimulus energy to the pulse duration and stimulus voltage that doubling the pulse duration results in a two-fold increase in stimulation energy, whereas doubling the stimulus voltage results in a four-fold increase, which has practical implications for the effect of programming pacing output on battery longevity.
An appreciation of the threshold strength–duration relation is important for the proper programming of the stimulus amplitude and pulse duration. Modern pulse generators offer two main methods for evaluating the stimulation threshold: either automatic decrement of the stimulus voltage at a constant pulse duration, or automatic decrement of the pulse duration at a constant stimulus voltage. To provide an adequate margin of safety, when the stimulation threshold is determined by decrementing the stimulus amplitude, the stimulus voltage is usually programmed to approximately twice the threshold value. Similarly, for pulse generators that determine threshold by automatically decrementing the pulse duration, the pulse duration is usually programmed to at least three times the threshold value. However, determination of the programmed output also has to take into consideration whether the voltage and pulse width values are in the vicinity of the chronaxie or rheobase.
The threshold strength–duration curve is influenced by several factors, including the method of measurement, the nature of the electrode, the health of the tissue in contact with the electrode, the distance between the electrode and excitable myocardium, and how long the lead has been in place. Stimulation thresholds that are measured by decrementing the stimulus voltage until loss of capture are usually 0.1–0.2 V lower than when the stimulus intensity is gradually increased from sub-threshold until capture is achieved. This empiric observation, known as the Wedensky effect, must be considered when accurate measurements of the stimulation threshold are required.11 The Wedensky effect may be greater at narrow pulse durations, potentially reaching clinical significance. When the pacing rate is maintained as a constant during experimental conditions, the Wedensky effect is of marginal significance. This suggests that this clinical phenomenon is probably explained by the effects of a varying cardiac rate during the gain or loss of capture as the stimulus amplitude is increased or decreased, respectively.
Strength–interval Relationship
The stimulation threshold is influenced significantly by the coupling interval of electrical stimuli and the frequency of stimulation.12 The stimulus intensity required to capture the ventricle remains quite constant at long extra-stimulus coupling intervals, but rises exponentially at shorter intervals. The rise in stimulation threshold at short coupling intervals is related to impingement of the stimulus on the relative refractory period of the ventricular myocardium. An electrical stimulus applied during the repolarization phase of the cardiac action potential will result in a propagated action potential only if it is of sufficient intensity. However, during the plateau phase of the action potential, electrical stimuli of any intensity will not be able to generate an action potential as the absolute refractory period is encountered.
The strength–interval relationship is particularly relevant when considering cathodal versus anodal stimulation.13 Late diastolic stimulation thresholds are generally lower with cathodal than with anodal stimulation. However, at relatively short extra-stimulus coupling intervals, the anodal stimulation threshold may be less than the cathodal threshold. During the relative refractory period, the anodal threshold may actually decline (“dip”) before abruptly rising at shorter coupling intervals. With bipolar cardiac pacing, the stimulation threshold is generally determined by the cathode. However, with short extra-stimulus coupling intervals, the bipolar stimulation threshold may actually be determined by the anode. If the stimulus intensity exceeds both the cathodal and anodal thresholds, bipolar pacing may result in stimulation at both electrode–myocardial interfaces (both anodal and cathodal stimulation).
Polarization
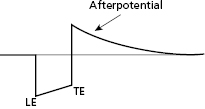
Following application of a polarizing pulse, an afterpotential of opposite charge may be induced in the myocardium at the interface with the stimulating electrode. This is due to an excess of positive charges that may surround the electrode after stimulation, which then exponentially decays to electrical neutrality (Figure 2.4). This positively charged afterpotential can be inappropriately sensed by the sensing circuit of the pulse generator with resulting inhibition or delay of the next pacing pulse. The amplitude of afterpotential is directly related to the amplitude and duration of the pacing stimulus, as well as the properties of the pacing electrode. Thus, afterpotentials are most likely to be sensed by particular leads, during conditions of maximum stimulus voltage and pulse duration, and when maximum sensitivity settings are programmed into the pulse generator. Inappropriate sensing of afterpotentials has been diminished by the use of blanking periods following the pacing stimulus. However, for dual chamber pacing systems, polarization artifact of sufficient amplitude in one chamber may be sensed by the sensing amplifier in the other chamber (cross-talk). Atrioventricular (AV) cross-talk as a result of pacing is a very rare clinical problem in the current era of predominantly bipolar pacing and sensing, along with the design of pacing electrodes that minimize the polarization phenomenon.
Anodal Stimulation
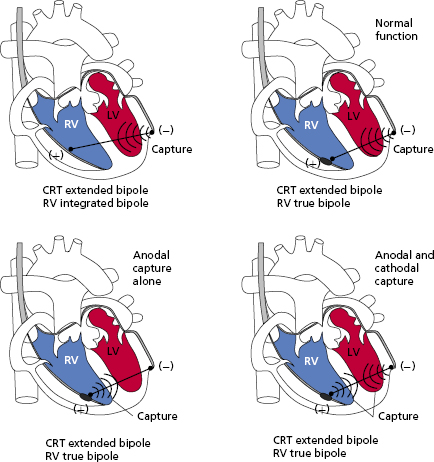
Ideally, myocardial stimulation occurs at the cathode. However, anodal stimulation is also possible in bipolar systems. Anodal stimulation is less likely because the anodal threshold is generally higher, the anode may not be in as direct contact with underlying myocardium, and it usually has a higher surface area than the cathode. However, if the programmed output or the pacing rate is high enough, it is possible to have both anodal and cathodal stimulation. Some animal studies have suggested that anodal stimulation may improve conduction velocity or mechanical performance. On the other hand, some data suggest increased pro-arrhythmia with anodal stimulation, but these findings are debated.
The implications of anodal stimulation may be most relevant in biventricular systems. Bipolar pacing from the left ventricular (LV) tip (cathode) to the right ventricular (RV) ring (anode) may cause simultaneous LV–RV pacing, resulting in an earlier activation of the RV due to anodal stimulation. In situations where an offset between the LV and RV is desired, this may prove deleterious (Figure 2.5).14,15
Electrode–myocardial Interface Maturation
The initial tissue reaction to the implantation of a permanent pacing lead involves acute injury to cell membranes. This damage is followed by the development of myocardial edema and coating of the electrode by platelets and fibrin. Infiltration of polymorphonuclear leukocytes and mononuclear cells then occurs, followed by acceleration of tissue injury around the electrode due to release of proteolytic enzymes and free oxygen radicals. The acute inflammatory response is followed by the accumulation of more macrophages and the influx of fibroblasts into the myocardium, which ultimately results in the creation of a fibrotic capsule around the distal electrode. Tissue fibrosis may improve lead stability at the electrode–myocardial interface, but at the same time several lead parameters may be negatively affected by an increased effective distal electrode size. Several advances in lead design, specifically in the development of steroid-eluting leads, have contributed to limiting the degree of fibrosis that occurs during the lead maturation process.
Current of Injury
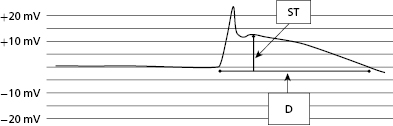
At the time of lead implantation, the intracardiac EGM will often demonstrate an injury current. This is due to the pressure exerted by the electrode on the underlying myocardium and may be seen with both active and passive leads. The lack of an injury current after lead implant may suggest poor contact between the distal electrode and endocardium, or scarring of the underlying myocardium. The manifestation of an injury current at the time of lead implantation is best appreciated as a change in the intracardiac EGM, characterized by widening of the EGM and pronounced “ST segment” elevation (Figure 2.6). Lead parameters, including sensing and threshold, may change over time after initial lead implant with reduction of the injury current. The injury current usually disappears within minutes to hours after initial implant. The effect of the injury current on acutely measured R waves may range from attenuation of the signal (especially in the case of active fixation leads) to slightly larger signals (as in the case of passive fixation leads). Ultimately, the value of the injury current lies in its ability to partially confirm adequate acute tissue–electrode contact.16
Time-dependent Changes in Sensing, Impedance, and Threshold
Sensing
With passive fixation leads, the amplitude of the intracardiac EGM typically declines abruptly within several days following implantation, followed by a gradual increase over 6–8 weeks back toward the initial value at the time of implant. The chronic amplitude of passive fixation electrodes has been shown to be approximately 85% of the acute value. However, modern corticosteroid-eluting leads have minimal deterioration of the EGM from implantation through regular follow-up assessments.
Active fixation leads may be associated with a different time course from passive fixation leads in the evolution of the sensed EGM. There may be more marked attenuation of the EGM amplitude immediately following lead positioning. Over the next 20–30 min, as the injury current dissipates, the EGM amplitude typically increases. It is likely that the trauma caused by extension of the screw helix into the myocardium is responsible for this evolution of the sensed intracardiac EGM.
In general, active and passive fixation leads are associated with similar chronic EGM amplitudes despite the differences in the initial time course of sensing changes.
Impedance
Pacing impedance usually falls over the first 1–2 weeks following implantation. The chronic pacing impedance then rises to a stable value that is, on average, approximately 15% higher than that at implant. An abrupt change in impedance early after implant may indicate lead migration or improper lead pin connection. Serial measurements of pacing impedance are extremely valuable for the assessment of lead integrity. Generally, low impedance measurements reflect a failure of conductor insulation, and high values often suggest conductor fracture or a loose set-screw at the connector. For clinical purposes, serial assessments of impedance should use a consistent method of measurement as these may influence the impedance value.
Stimulation Threshold
Myocardial stimulation thresholds may change dramatically between initial implantation and chronic values,17 and it is important to understand the time course and properties of lead maturation with different leads and implantation techniques.
In active fixation leads, there may be acute variability in the stimulation threshold. Immediately following deployment of the screw helix, an increased stimulation threshold may be seen for several minutes that may correlate with the presence of an injury current. Both the injury current and the higher threshold decrease over several minutes. Thus, the threshold seen at the end of the implant procedure with an active fixation lead may be less than that seen upon initial deployment of the lead. Such an acute change is not generally seen with passive fixation leads.
There are differences in the time course of stimulation threshold changes in non–steroid-eluting versus steroid-eluting leads. Non–steroid-eluting leads generally exhibit a higher threshold within the first 24 h after implant, rising over the ensuing week, and then gradually decreasing over the following several weeks before reaching a stable value by 6 weeks. Final threshold is usually higher than that seen at initial implant, but less than the peak threshold. Several factors may modify this time course of events, including the electrode size, shape, chemical composition, surface structure, and other patient-specific factors.
Steroid-eluting leads, which reflect the majority of leads used in current endocardial procedures, rarely exhibit such marked changes in threshold over time. The stimulation threshold is much more constant, and the threshold at implant may be more reflective of the chronic threshold seen weeks or months after the procedure.
The difference in the threshold maturation process between steroid-eluting and non–steroid eluting leads is thought to be due to the greater growth of inexcitable capsules of fibrous tissue surrounding the electrode in the latter.18 This fibrous capsule effectively increases the surface area of the electrode, thereby decreasing the intensity of the electrical field at the junction of the fibrous capsule and the normal, excitable myocardium. This will consequently result in a higher stimulation threshold. The use of steroid-eluting leads (e.g. by utilizing a reservoir of dexamethasone below the stimulating electrode that gradually elutes corticosteroid into the surrounding myocardium) attenuates early tissue reaction and formation of the fibrous capsule and, thus, allows for more stable stimulation thresholds over time.19 The utility of steroid-eluting leads in decreasing long-term threshold values has been demonstrated in active and passive endo- and screw-in epi-myocardial leads.
Automated Capture
The pacing output needs to be programmed to exceed the stimulation threshold by an adequate margin (termed the “safety margin”) to reduce the risk of loss of capture during fluctuations in pacing threshold. On the other hand, the current drain on the battery has to be optimized in order to maximize battery longevity. A commonly used compromise to achieve these goals is to set the pulse amplitude at two to three times that of the pacing threshold close to the chronaxie pulse duration. Risks, however, are that patients may experience rises in stimulation threshold over time that, in rare cases, may exceed the programmed output, or that a programmed output well in excess of the threshold may result in excessive early drain on the battery. Automatic capture algorithms in some devices allow the pacing threshold to be determined automatically and, in turn, automatically program the pacing output accordingly.
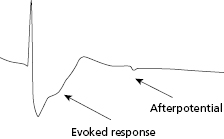
In current automatic capture algorithms, local myocardial capture is confirmed by detecting myocardial depolarization or “evoked response” following pacing. The key feature of automatic capture algorithms is the ability of the pacemaker to detect the presence or absence of an “evoked response,” which is the electrical event that results from myocardial capture after an output pulse. Modern devices and leads have improved the ability to identify these signals and differentiate them from polarization artifact (Figure 2.7). The more frequently the pacing threshold is measured, the lower the necessary margin of safety may be programmed because of the reduced chance for an undetected rise in threshold. If capture is assessed with every beat, then pacing output need only be marginally higher than threshold, and a back-up, higher output pulse may be delivered with any detected non-capture event.
The algorithms used for automated capture vary somewhat between manufacturers and it is important to understand the limitations with each approach. The AutoCaptureTM algorithm used in St. Jude pacemakers assures capture on a beat-to-beat basis. This algorithm first verifies that the evoked response can be differentiated from the polarization signal by delivering paired pulses, with the second pulse occurring in the absolute refractory period and thus causing only polarization artifact. Via this mechanism, the algorithm is able to set a reliable evoked response sensitivity. If there is insufficient difference between the evoked response signal and the polarization artifact, the algorithm may not function adequately because it runs the risk of oversensing polarization signal and under-estimating the threshold. In these cases, the automatic capture feature has to be turned off. After determination of the threshold, the pacemaker adjusts the output to stimulate at 0.3 V (for single chamber) or 0.25 V (for dual chamber) above the prevailing threshold. The algorithm works by reducing the pacing output in 0.25-V steps over consecutive pairs of beats until loss of capture occurs on two consecutive beats, with a 5-V back-up pulse delivered with each loss of capture event. The output is then increased in 0.125-V steps until two consecutive capture beats are seen, thereby defining capture threshold. The 0.25-V margin is then added to this threshold for subsequent pacing until loss of capture is seen or the next threshold test is performed. It is important to remember that capture confirmation occurs on a beat-to-beat basis. In several multicenter studies, the algorithm was found to be safe and effective and did not result in loss of capture, exit block, or other adverse events.20,21 However, the algorithm requires use of a bipolar pacing lead with low polarization properties. Furthermore, patients with this feature turned “on” may exhibit unusual pacing behavior on telemetry or ECG when the device is performing automatic threshold testing.
The Capture ControlTM algorithm used in Biotronik pacemakers similarly depends on the use of a bipolar lead with low polarization characteristics. The differences from the St. Jude Medical algorithm include the absence of a back-up safety pulse during loss of capture and an output increase in 2-V steps if there is persistent loss of capture. Then, after a programmable length of time, the output is decreased to the original value to see if capture can be obtained with a lower output.
Other manufacturers use algorithms that deliver back-up pulses on a beat-to-beat basis or provide automatic determination of pacing threshold at programmed intervals during the day. Boston Scientific pacemakers make use of a coupling capacitor to “absorb” polarization energy, allowing their beat-to-beat capture algorithm to be used with a wide range of pacing leads. The Ventricular Capture ManagementTM feature of Medtronic devices also works with a wide range of leads, but rather than looking for beat-to-beat capture, the algorithm performs a strength duration threshold test at programmable intervals (nominal is once per day). With this algorithm, the amplitude threshold is first determined at a fixed pulse duration (0.4 ms), and then the pulse amplitude is doubled and a pulse duration threshold is measured. The permanent ventricular stimulation amplitude is then automatically set using a pre-programmed amplitude safety margin (usually twice threshold, which is the nominal setting) or a programmable minimum amplitude (whichever is higher).
These automated capture algorithms may improve safety related to pacing by avoiding situations where loss of capture could occur due to a rise in the stimulation threshold, improve battery longevity by reducing the programmed safety margin in line with the stimulation threshold, or both.22 However, the differences between manufacturers’ algorithms should be understood before activating them, especially in a pacemaker-dependent patient. Furthermore, it is important to understand the differences in the types of leads with which each algorithm may work.
Automated Sensing
The amplitude of the atrial and ventricular EGM can vary with the cardiac rhythm, patient activity, medications, or changes at the electrode–myocardial interface. Atrial EGMs, for example, are generally smaller in atrial fibrillation than in sinus rhythm, whereas the ventricular EGM amplitude can decrease in the setting of infarction or fibrosis of the myocardium near the ventricular electrode. In pacemakers, traditionally a fixed sensitivity setting is used, and EGMs that surpass this cut-off are sensed, and those of smaller amplitude fail to be sensed. Because the most common cause of anomalous pacemaker behavior relates to problems with sensing, several manufacturers have introduced pacemakers that regularly determine the amplitude of P and R waves, and automatically reprogram the atrial and ventricular sensitivity settings to maintain an acceptable sensing safety margin.
The clinical utility of an autosensitivity algorithm is highlighted by the observation that programming a 100% sensing safety margin based on a single P wave measurement provides reliable atrial sensing in only 72% of patients with dual chamber pacemakers. One example of autosensing is the Medtronic Sensing AssuranceTM algorithm, which repeatedly measures the amplitude of P and R waves and classifies each as low, high, or adequate based on a non-programmable target safety margin. This feature reprograms the bipolar atrial sensitivity value so that the atrial EGM is maintained within a range that is 4.0–5.6 times the programmed sensitivity value, and the atrial unipolar lead and ventricular lead sensitivity value so that the target safety margin is 2.8–4.0 times the programmed sensitivity. Other manufacturers offer similar algorithms to ensure adequate sensitivity safety margin programming. In more recently introduced pacemaker platforms, sensing algorithms are similar to those used in ICDs with beat-to-beat variation in sensitivity or gain control.
Considerations of Time-dependent Changes in the Context of Device Programming
Proper programming of the stimulus amplitude of a permanent pacemaker requires an understanding of these potential time-dependent changes in stimulation threshold and sensing. For example, the safety margin that is chosen for a particular patient must be based on an expected severity of symptoms if loss of effective pacing occurs. For patients judged to be highly pacemaker dependent, a higher stimulation safety margin may be desired. As an example, a patient with complete AV block with an unreliable ventricular escape rhythm may be more likely to develop symptoms with loss of ventricular capture than a patient with intermittent sinus node dysfunction. On the other hand, the patient with AV block is likely to be less dependent on atrial than ventricular capture. Thus, a higher safety margin may be needed for ventricular than atrial pacing.
One of the downsides to programming an excessive safety margin is the impact on battery longevity. Programming stimulus intensity to greater than 2.8 V results in a marked increase in current drain from the battery. Generally, a three-fold safety margin may be employed at the time of initial implant, followed by reprogramming to a lower value at the 6–8-week follow-up visit. Determining the appropriate safety margin has to be considered in the context of the patient’s other metabolic and pharmacological history as the resulting confounders may alter stimulation threshold.
Sensing may improve after resolution of acute current of injury and further significant changes are unusual in the subacute settings. Local scar formation or dislodgement may alter sensing parameters and reprogramming may be necessary during follow-up. Depending on the clinical circumstances and sensed signal amplitude, sensitivity in pacemakers is usually programmed between ½ to 1/5 of the peak signal amplitude.
Impact of Clinical Variables on Pacing Threshold
Several clinical variables, including metabolic and pharmacological factors, may impact pacing parameters, in particular the stimulation threshold23 (Table 2.1). One example is the impact of faster pacing rates on pacing threshold. With increasing pacing rates, there is a shortening of the myocardial action potential, thus shortening the relative refractory period. In such situations, there may be a reduction in stimulation threshold. However, with very rapid pacing (rates above 250 bpm), stimulation may occur during the relative refractory period, thus necessitating higher stimulus output or duration. This is relevant to conditions under which antitachycardia pacing may be delivered (e.g. in defibrillators).
| Increase threshold | Decrease threshold | |
|---|---|---|
| Antiarrhythmic drugs | Class I Quinidine Procainamide Flecainide Propafenone | |
| Other drugs | β-blockers | Catecholamines Isoproterenol Corticosteroids |
| Metabolic conditions | Hyperkalemia Hyperglycemia Hypoxemia Hypercarbia Metabolic acidosis Metabolic alkalosis | |
| Activity/other conditions | Sleeping Eating Viral illness Vagal tone | Exercise Sympathetic tone |
Table 2.1 Pharmacological and metabolic effects on stimulation threshold
Other settings in which stimulation thresholds may change are myocardial infarction and endocardial ablation. Any condition that results in increased fibrosis or scarring close to the pacing lead may result in an increase in stimulation threshold or loss of capture.
Stimulation threshold shows a circadian variation, generally increasing during sleep and falling during waking hours. The changes in threshold likely reflect fluctuations in autonomic tone and circulating catecholamines. The stimulation threshold may also increase after eating, and during hyperglycemia, hypoxemia, hypercarbia, and metabolic acidosis or alkalosis. The stimulation threshold may increase during acute viral illnesses as well, especially in children. The concentration of serum electrolytes may also influence the stimulation threshold, as seen for example with a rise in the stimulation threshold in the setting of hyperkalemia.
Drugs may also influence the stimulation threshold. While medications like isoproterenol may decrease threshold, β-blocking drugs may increase threshold. Both oral and parenteral corticosteroids may produce a decrease in the stimulation threshold and alleviate the acute rise of threshold following implantation of an active fixation lead. Antiarrhythmic drugs also have prominent effects on stimulation threshold. Drugs that raise the stimulation threshold include the type I antiarrhythmic drugs quinidine, procainamide, flecainide, and propafenone. Virtually all antiarrhythmic drugs may influence the pacing threshold, though these changes are usually clinically important only at high serum concentrations of the drug.
Biventricular Pacing
In the early days of cardiac resynchronization therapy (CRT) pacing, implantable devices were not manufactured with separate pacing circuits for the RV and LV leads, and only unipolar leads were manufactured for LV pacing via a cardiac vein. In these older devices, the most common configuration involved electrically linking the tip electrodes of the RV and LV leads as a split cathode, and using either the RV ring electrode (if a bipolar RV lead was present) or the pulse generator as the common anode. Regardless of the configuration, the leads were linked to one another with a Y adaptor to achieve biventricular pacing. This configuration lent itself to multiple issues due to the leads essentially acting in parallel. Pacing output had to be programmed above the highest threshold of the two leads, resulting in increased current drain. It was also difficult to assess the parameters of individual leads and failure of a single lead could not be easily determined.
Modern CRT devices allow for separate pacing circuits for the RV and LV leads, and allow LV leads with unipolar, bipolar, and multipolar configurations. The ability to separately assess the RV and LV leads allows the clinician to program parameters separately, and simplifies lead assessment while simultaneously reducing current drain on the battery. Furthermore, separate programming of the LV and RV channels allows pacing with multiple LV configurations and with optional different timing between the two channels. Multiple LV configurations allow non-invasive programming options to avoid phrenic nerve capture or minimize current drain during LV pacing. For example, unipolar leads may be programmed as true unipolar (where the pacemaker generator is the anode; not available on all devices) or extended bipolar (where the RV ring electrode or the RV coil in the case of an ICD lead is programmed as the anode). Bipolar LV leads allow for the addition of several more pacing configurations beyond unipolar pacing from each electrode, including the ability to program true bipolar or an extended bipolar configuration with either the LV tip or LV ring as the cathode.
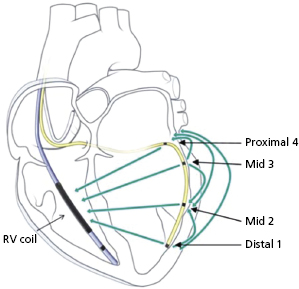
There have been recent advances in biventricular pacing beyond standard unipolar and bipolar configurations, though these require the use of unique leads and generators. One example is the quadripolar lead.24 This lead has four poles which can act together in multiple configurations to allow for bipolar pacing (Figure 2.8). The addition of several poles that can act as the cathode along the body of the lead allows the identification of areas more proximally along the cardiac venous system where phrenic capture may be avoided or where placing a bipolar lead may be difficult due to issues with stability. For example, the tip of a quadripolar lead may be fixed in a distal position in a cardiac vein for stability, but a more proximal electrode may be used for pacing if local threshold or phrenic nerve capture may be limiting in other positions. However, this lead is slightly larger than the smallest LV leads, limiting the ability to access particularly small veins. In addition, only one device manufacturer currently provides the lead and currently it cannot be used with generators made by other manufacturers.
In some patients, endovascular LV lead placement may not be possible due to limitations of the cardiac venous anatomy. In such cases, placement of an epicardial LV lead may be considered. Currently, this requires placement in the operating room using thoracotomy. However, work is ongoing on developing percutaneous approaches to epicardial LV lead placement.
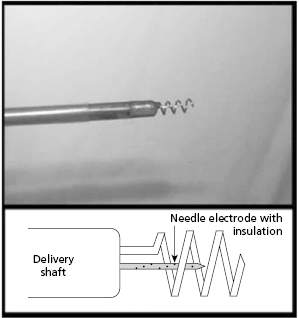
Additional research is exploring novel leads and pacing locations to achieve more physiological ventricular activation akin to biventricular pacing. One example is pacing via the AV septum that exists between the right atrium (RA) and LV.25 For example, an intramyocardial pacing lead in which the cathode (a coil) surrounds the anode, such that both can be actively fixed together into the AV septum, may allow for pacing akin to His or para-Hisian pacing without crossing the tricuspid valve or accessing the cardiac venous system25 (Figure 2.9).
Work has also been done on multisite pacing, or pacing from more than two sites. Limitations to this approach include the need for additional hardware. There is also a lack of sufficient clinical data to recommend routine clinical use of this modality at this time.
Stay updated, free articles. Join our Telegram channel

Full access? Get Clinical Tree


