Hemodynamics of Cardiac Pacing and Pacing Mode Selection
1 Case Western Reserve University, Cleveland, OH, USA
2 Cleveland Clinic, Cleveland, OH, USA
Introduction
Cardiac pacing in an individual patient can have either beneficial or detrimental effects on hemodynamic function and clinical outcomes. Appropriate selection of a cardiac rhythm management device for a given patient and optimal management of a patient with a permanent pacing device require proper understanding of the major factors that influence hemodynamic function. While early generations of cardiac pacemakers were sufficient technologically to prevent symptomatic bradycardia, the goal of cardiac pacing over the last few decades has been the attainment of “physiological” pacing. Many variables in pacing systems can affect cardiac hemodynamic function. The ideal pacemaker should maintain and optimize heart rate, atrioventricular (AV) synchrony, and ventricular activation to enable cardiac output to meet the metabolic needs of the patient, whether at rest or during exercise. The concept and definition of physiological pacing have evolved over time in concert with our understanding of pacing-related cardiovascular hemodynamics, as well as with technological sophistication.
In the current era, the goals of physiological pacing include maintaining heart rate, optimizing AV synchrony, minimizing right ventricular (RV) pacing to avoid ventricular desynchronization, using alternative RV pacing sites for improved hemodynamic performance, and selecting appropriate patients for cardiac resynchronization therapy (CRT). Optimization of hemodynamic function in the pacemaker patient is determined to a large extent by a complex interaction between device-related variables (e.g. pacing mode, pacing lead position, pacing rate, rate responsiveness, AV relationships, atrial and ventricular activation sequences, frequency of RV pacing, etc.) and the underlying patient substrate (e.g. atrial rhythm, chronotropic competence, AV and ventricular conduction, ventricular function, history of heart failure and/or myocardial infarction, etc.).1
Correction of Bradycardia
When a patient with AV block or sinus node disease experiences sudden bradycardia, the blood pressure and cardiac output fall, leading to reduced cerebral perfusion. The primary therapeutic goal of cardiac pacing is to correct symptomatic bradycardia in such conditions. It is the only effective treatment that can prevent death or syncope caused by ventricular asystole. Simply increasing the heart rate will result in improvement of the hemodynamic abnormalities, including normalization of systolic blood pressure.
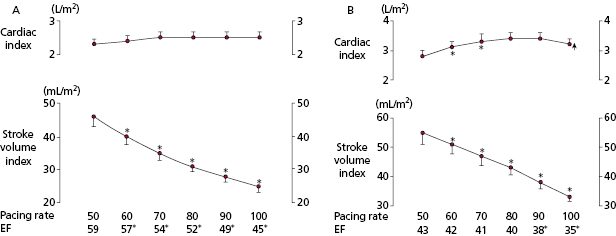
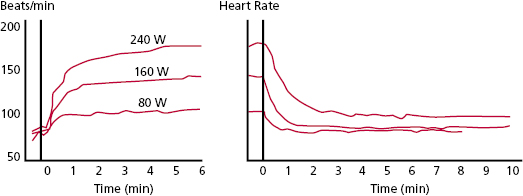
Early work on the ideal pacing rate indicated that a rate between 70 and 90 bpm results in maximal increase in cardiac output during ventricular pacing at rest (Figure 3.1).2,3 Further augmentation of heart rate via ventricular pacing resulted in either no additional increase or a decrease in cardiac output accompanied by an increase in peripheral vascular resistance and decrease in left ventricular ejection fraction (LVEF). Historically, when earliest generation single chamber ventricular pacemakers were manufactured with only one rate, 70 bpm was the rate usually chosen. However, it should be kept in mind that in an individual patient it is likely that different resting ventricular rates (either higher or lower) may be required to optimize hemodynamics at rest. In patients with systolic and/or diastolic dysfunction or hypertensive hypertrophic heart disease, higher heart rates may limit maximal cardiac output by shortening diastolic filling time, reducing left ventricular (LV) compliance, and increasing systemic vascular resistance (Figure 3.1). Increasing heart rate also augments cardiac oxygen consumption and if this occurs without an enhancement of cardiac output, then a lower pumping efficiency will occur at the higher rate.
Chronotropic Incompetence and Rate Modulation
In addition to maintaining resting heart rate in the physiological range, pacemaker therapy can allow the heart rate to rise during exercise. A variety of terms have been used to describe the capacity of a pacing system to respond to physiological need by increasing or decreasing pacing rate. The earliest term used to describe this physiological property of pacing systems was rate responsive. Significant objection to this term (for grammatical reasons) has led to the more acceptable use of the terms rate adaptive and rate modulating. However, all these terms are used interchangeably.
When the chronotropic function of the sinus node is impaired, the capability of a pacing system to provide rate adaptation depends on the presence of physiological sensors that monitor the need for heart rate modulation. Rate-adaptive pacing is available in almost all modern pulse generators. Rate-adaptive pacing sensors detect physical or physiological indices to mimic the rate response of the normal sinus node. A variety of sensors have been developed to modulate pacing rate according to metabolic demands and to correct chronotropic incompetence.4 Activity, accelerometer, minute-ventilation, and QT-interval sensors are commercially available. There is no single sensor that ideally mimics normal cardiac physiology and perfectly modulates heart rate according to metabolic demands. A detailed review of the technology of physiological sensors is given in Chapter 2.
Exercise Physiology
The importance of rate modulation in pacing systems is related directly and specifically to the importance of matching cardiac output with physiological need. The predominant need for rate modulation derives from physical activity or exertion. A rise in heart rate with greater workload improves exercise capacity. However, there are other physiological situations in which, normally, there are modulations of heart rate(e.g. during fever and emotional stress). These situations, however, have received less attention, especially in the context of pacing systems.
During exercise—or “work”—the body tissues increase their demand for oxygen.5 In addition, there is increased need for removal of metabolic by-products, such as CO2, from tissues. The body has a number of physiological mechanisms in place to provide for increased metabolic demands during exercise. Redistribution of blood flow to working tissues, increased ability of working tissues to extract oxygen from blood, and, most important, increased cardiac output are these mechanisms. Here, we focus on the last of these, the body’s ability to increase cardiac output with exercise, as this is what rate modulation provides.
The importance of cardiac output during work must be appreciated. A direct, relatively linear relationship exists between the amount of work accomplished and oxygen consumption. Maximal work capacity, therefore, is specifically related to maximum oxygen consumption. Further, consistent with the Fick principle:
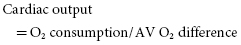
where AV means arterial–venous. Also:

By substitution in these equations:
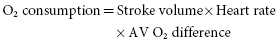
Because oxygen consumption is directly linearly proportional to work (Figure 3.2):
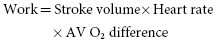
Increasing any of these variables will support an increased ability to do work, but the increase in heart rate is the most important determinant. Maximum work, in normal individuals, is accomplished by an increase in stroke volume to approximately 150% of the resting value, an increase in heart rate to approximately 300% of the resting value, and an increase in AV O2 difference to approximately 250% of the resting value. These changes allow an increase in work to over 10 times resting levels. In normal individuals, peak cardiac output can be increased to 300% of resting values simply by an increase in heart rate. During peak exercise, the stroke volume is increased to approximately 150% of the resting value. This increase in stroke volume is not linear and is achieved at approximately the halfway point between the rest and maximal exercise levels. The increased stroke volume is accomplished by an increase in venous return, ventricular filling, and contractility. It is ideal to optimize stroke volume, because this is a more energy efficient way of accomplishing cardiac output (milliliters of cardiac output/milliliters of O2 consumption) than by an increase in heart rate.
The normal heart rate response to exercise follows a triphasic response (Figure 3.2).6 Heart rate increases most rapidly within the first 10–15 s of maximum effort exercise and reaches 70% of total heart rate increase in this phase. A slower exponential rise in rate follows during the next 60–90 s. Finally, a slow linear increase or plateau phase results from sustained activity. Heart rate deceleration with cessation of exercise is generally slower than acceleration and follows a biphasic or triphasic response.
Chronotropic Incompetence
The inability to increase and maintain heart rate appropriately with exercise is called chronotropic incompetence.7 A number of criteria have been proposed to diagnose chronotropic incompetence, including the inability to increase heart rate with exercise to at least 70–85% of the maximum predicted heart rate (maximum predicted heart rate = 220 − age in years). This is a useful criterion for diagnosing chronotropic incompetence, but it cannot be used in individuals with limitations on their exercise function unrelated to cardiopulmonary status. Thus, the diagnosis of chronotropic incompetence is difficult if the patient cannot undergo formal exercise testing or perform a simple hall walk test. Further, there are patients with delayed chronotropic responses who could benefit from rate-adaptive pacing systems but might be missed by this criterion. More complicated formulas have been developed to allow determination of the presence of chronotropic incompetence by exercise testing with assessments made by stage. The Wilkoff chronotropic assessment exercise protocol (CAEP) is performed via treadmill testing and is often used for chronotropic competency evaluation.8 It uses gradual increases in both elevation and speed, and can be used for the evaluation of devices with a variety of sensor types.
Chronotropic incompetence is common among pacemaker patients. However, the frequency of chronotropic incompetence in part depends on the definition used and method of assessment. Among a cohort of pacemaker patients [42% AV block, 56% sinus node disease, and 59% atrial fibrillation (AF)], 51% were diagnosed as having chronotropic incompetence based on the Wilkoff chronotropic index.9 Among patients in whom sinoatrial disease is the primary indication for pacing, not all will manifest chronotropic incompetence during formal exercise testing. Some individuals with sinus node dysfunction may demonstrate normal chronotropic response to exercise, whereas others may have little or no ability to increase heart rate during exercise. Thus, the need for rate-adaptive pacing is unpredictable in sinoatrial disease. The overall pattern of chronotropic response in an individual is variable and may evolve over time. Some patients are able to achieve the appropriate heart rate for the level of exercise, but do so more slowly than is normal. Patients with any form of chronotropic incompetence are candidates for pacing systems with rate-modulation capabilities. It is also noted that making predictions regarding the future need for rate-adaptive pacing is unreliable at the time of implantation. This is usually not a clinical issue, because rate-adaptive pacing is available in almost all modern pacemaker generators and can be programmed “on” if needed after implantation.
Chronotropic incompetence may be provoked by disease, most commonly ischemic heart disease, valvular heart disease, and heart failure, or induced by drugs. In a study of pacemaker patients, significant predictors of chronotropic incompetence included the existence of coronary artery disease, presence of an acquired valvular heart disease, former cardiac surgery, and therapy with digitalis, β-blockers, or amiodarone.9 Chronotropic incompetence has important prognostic implications in patients with coronary artery disease. It predicts all-cause mortality independent of angiographic severity of coronary artery disease.10 The prevalence of chronotropic impairment in heart failure patients also is variably reported (25–70%), possibly due to a lack of a standardized definition and/or differing assessment methodologies.11 Chronotropic impairment impacts the physical function and quality of life of heart failure patients.
Advantages and Clinical Benefits of Rate Modulation
As is obvious from the foregoing discussion of exercise physiology, the ability of patients to increase heart rate with exercise is the primary means of meeting metabolic demands. Thus, exertional intolerance is inevitable if heart rate cannot be increased appropriately. The ability to increase rate is the most important determinant of cardiac output and exercise capacity, especially at higher levels of exertion. A positive linear correlation between improvement of exercise capacity and heart rate is observed. An inappropriate chronotropic response to exercise can decrease peak exercise oxygen uptake by as much as 15–20%.
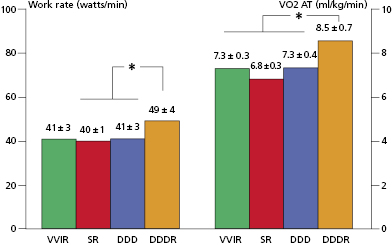
Quantification of the improvement in work capacity in pacemaker populations comparing non–rate-modulated with rate-modulated modes has shown the advantages of the rate-modulated systems. Rate-modulated pacing systems have been shown not only to improve the heart rate response with exercise, but also to increase work capacity. For every 40% increase in paced rate during rate-modulated pacing compared with non–rate-modulated pacing, there is a 10% increase in work capacity. Compared with VVI pacing, VVIR mode improves exercise duration and cardiac index in patients undergoing paired stress testing. These improvements are independent of patient age and ejection fraction. Even greater improvements in exercise hemodynamics are documented with DDDR pacing compared with either VVIR or DDD modes. Compared with VVIR, DDDR pacing has demonstrated improved exercise capacity, cardiac output, and cardiac metabolic indices, suggesting more efficient cardiac work. In patients with sick sinus syndrome, DDDR pacing provides greater maximal heart rates, longer exercise times, higher maximal oxygen uptake, and higher oxygen uptake at anaerobic threshold than DDD pacing (Figure 3.3). These benefits are attributed largely to the increased heart rate in the rate-adaptive mode.
Despite recognized theoretical benefits of rate modulation on exercise performance, it is realized that many pacemaker recipients are elderly and function at submaximal levels of exertion during virtually all their daily activities. Rarely does the typical pacemaker patient require improvement in maximal work capacity and few are expected to stress to their maximal heart rate, except for the young or extremely vigorous. References are available that provide normal ranges of heart rates in response to moderate exercise according to age, sex, and body surface area, which have relevance to rate-adaptive pacemaker programming. However, such rates are often inappropriate in some patients, such as those with coronary artery disease, valvular disease, or diastolic dysfunction. Optimization of heart rate by providing rate modulation at sub-maximal levels of exertion during activities of daily living most often is the therapeutic aim. This may require individualized pacemaker programming to suit the unique needs of each patient.
From an evidence-based perspective, it is notable that despite the physiological basis for rate-adaptive pacing and acute improvements in exercise hemodynamics with the use of this technology, it has not been clearly and consistently established that rate-adaptive pacing provides clinically relevant improvements in symptoms, quality of life or other relevant cardiovascular outcomes. In a small trial of patients with the tachy–brady syndrome, symptomatic improvement was demonstrated in patients programmed to the DDDR compared with the DDD mode.12 The improvement in symptoms in the DDDR group was mostly due to reduced palpitations related to fewer mode switching episodes. The Advanced Elements of Pacing Trial (ADEPT) studied 872 patients with at least mild chronotropic incompetence and found no significant improvements in quality of life in patients assigned to rate-modulated compared with fixed-rate pacemakers (DDDR vs. DDD).13,14 Furthermore, there were no differences in the composite end-point of death, non-fatal myocardial infarction, stroke, hospitalization for heart failure, or AF between the two groups. Interestingly, the DDDR group was significantly more likely to experience hospitalization for heart failure compared with the DDD group (7.3% vs. 3.5%). Thus, it should be concluded that the addition of rate modulation in conventional dual chamber devices, in spite of attempting to replicate the normal response to exercise, does not have a positive impact on quality of life or cardiovascular outcomes. It may be speculated that the increased frequency of RV pacing at higher heart rates during rate-modulated pacing, with the resultant forced ventricular dyssynchrony, may increase the risk of heart failure and negate the potential benefits of restoring chronotropic competence. The clinical utility and importance of rate modulation during biventricular pacing has not been well studied.
Although there are a variety of sensors that can be used for rate modulation in currently available pacemakers, there is little evidence to support a major clinical difference in outcomes between sensors and their combinations. Interestingly, when three of the most commonly utilized rate-adaptive sensors (accelerometer, piezoelectric, and blended sensors; see Chapter 2) were compared in DDDR-paced patients with sinus node dysfunction in the Mode Selection Trial (MOST), quality of life analyses demonstrated that patients with blended sensors had significantly worse physical function than did patients with the other two sensor systems.15 There were no significant differences, after adjustment for baseline differences, among the three sensors in clinical end-points after long-term follow-up, including no significant differences in the risk of death, heart failure hospitalization, AF, and the combined end-point of mortality and stroke.
Atrioventricular Synchrony
The introduction of dual chamber (AV sequential) pacing in 1962 was designed to avoid AV desynchronization imposed during ventricular-only pacing and improve hemodynamics.16 Enthusiasm for AV sequential (DDD) pacing and the importance of maintaining AV synchrony was so high in the 1980s that at that time many in the field believed that these pacemakers could permit the restoration of normal cardiac physiology.17 Furthermore, at one time, dual chamber [right atrial (RA) and RV] cardiac pacing was proposed as a possible therapy for heart failure. However, subsequent studies and randomized clinical trials of pacemaker therapy have provided important new insights into the hemodynamics of AV synchrony and pacing mode selection. The widespread recognition of the potential deleterious effects of frequent RV pacing along with the introduction of LV-based pacing and CRT have further complicated consideration of the hemodynamics of AV synchrony, optimal pacemaker mode selection, and dual chamber pacemaker programming.
The hemodynamic benefits of AV synchrony accrue from its ability to (1) maximize ventricular preload and therefore contractility; (2) close AV valves before ventricular systole, limiting AV valvular regurgitation; (3) maintain low mean atrial pressures, thus facilitating venous return; and (4) regulate autonomic and neurohumoral reflexes involving atrial pressure and volume.
Advantages
The loss of AV synchrony during ventricular pacing in the presence of sinus rhythm is associated most consistently with increases in atrial pressures, alterations in pulmonary and systemic venous flow patterns, and AV valvular regurgitation.18 Effects of AV desynchronization on systemic blood pressure and cardiac output are more variable between patients. Autonomic activation of the vagal inhibitory reflexes associated with atrial distension can result in an inappropriate decrease in peripheral vascular resistance. Rarely, VVI pacing with loss of appropriate AV synchrony can produce dramatic responses and disabling symptomatology with severe symptomatic hypotension, decreased cardiac output, and syncope.
Atrial Pressures
An increase in atrial pressures during ventricular pacing is probably the major mechanism by which symptoms are produced when AV synchrony is not maintained. Increases in atrial pressure during ventricular pacing (VVI) are related primarily to atrial contraction against closed AV valves during ventricular systole. During AV synchrony, atrial contraction augments ventricular end-diastolic filling pressure while maintaining a low mean atrial pressure throughout diastole. In the absence of AV synchrony, a higher mean atrial pressure is required to achieve the same degree of ventricular filling. By this mechanism, AV synchrony is associated with lower venous and left atrial (LA) pressures (Figure 3.4).
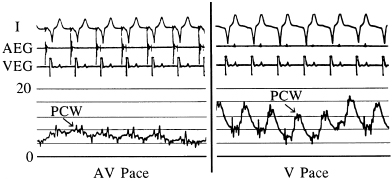
In Figure 3.4, the left panel shows recordings of the pulmonary capillary wedge pressure in one patient during AV-synchronous pacing [80 pulses per minute (ppm), AV interval 150 ms]. The right panel shows the pulmonary capillary wedge pressure during ventricular pacing (80 ppm) with intact ventriculoatrial (VA) conduction. A relatively normal pulmonary capillary wedge pressure tracing is produced during AV pacing with mean pressures between 4 and 8 mmHg and without significant phasic aberration. In contrast, during ventricular pacing, the mean pressures are elevated to between 8 and 12 mmHg with large A waves (or VA waves) that, at times, exceed 16 mmHg. This elevation in atrial pressures, and specifically the production of giant or “cannon” A waves, occurs because of LA contraction against a closed mitral valve; the increased pressure wave is present not only in the LA, but also in the pulmonary veins and pulmonary capillary wedge position. The same phenomenon occurs on the right side of the heart.
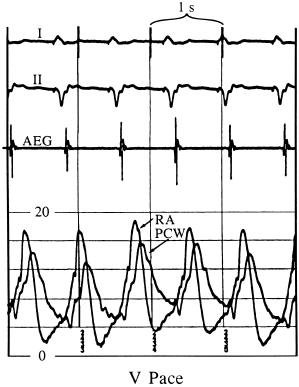
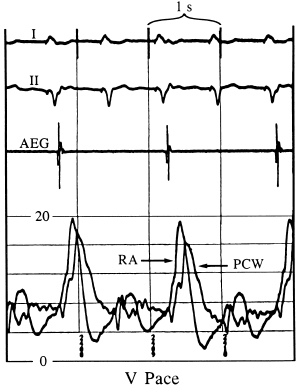
Figures 3.5 and 3.6 display simultaneous RA and pulmonary capillary wedge recordings during ventricular pacing (80 ppm) in which VA conduction is intact. In Figure 3.5, 1:1 VA conduction is present, while in Figure 3.6, there is 2:1 VA conduction. Intact VA conduction produces consistent elevations in pressure in the LA and RA due to contraction of the atria against closed AV valves. Even when VA conduction is not intact, because of unequal atrial and ventricular rates, there will be frequent periods when atrial contraction occurs during ventricular systole, during which the AV valves are closed; hence, the problems of elevated pressures in the atria and pulmonary veins occur. Some patients are actually more symptomatic when VA conduction is not intact, due to intermittency of these elevated pressures, thus preventing patients from establishing tolerance to this phenomenon.
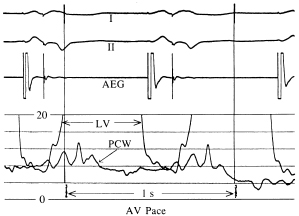
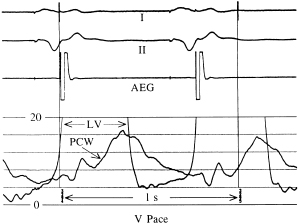
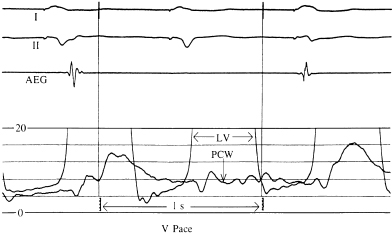
The relationship of the phasic changes in the pulmonary capillary wedge (and LA) pressures to LV pressures can be seen in Figures 3.7, 3.8, and 3.9. Figure 3.7 is a display of normal LV and pulmonary capillary wedge pressure recordings during AV pacing (80 ppm, AV interval of 150 ms). The appropriately timed A wave can be seen in both the LV and pulmonary capillary wedge pressure recordings. In contrast, as Figure 3.8 shows, during ventricular pacing (80 ppm) with a consistent 1:1 VA relationship, the loss of the A wave contribution to the upstroke of the LV pressure recording and the giant A wave, late in ventricular systole, can be seen consistently in the pulmonary capillary wedge pressure recording. Figure 3.9 displays this relationship when the atrial contraction is random in relation to ventricular contraction.
Pulmonary Venous Flow Patterns
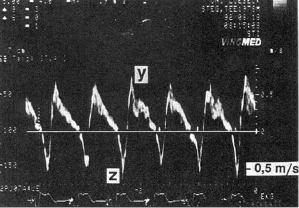
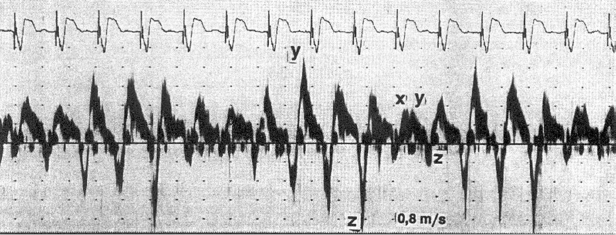
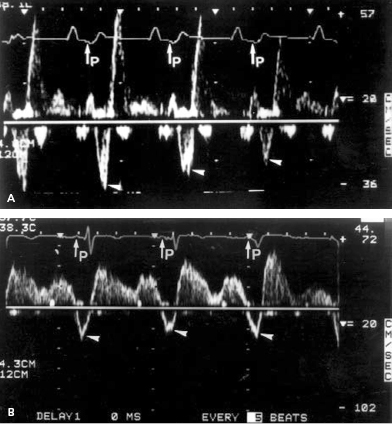
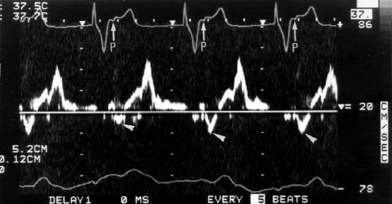
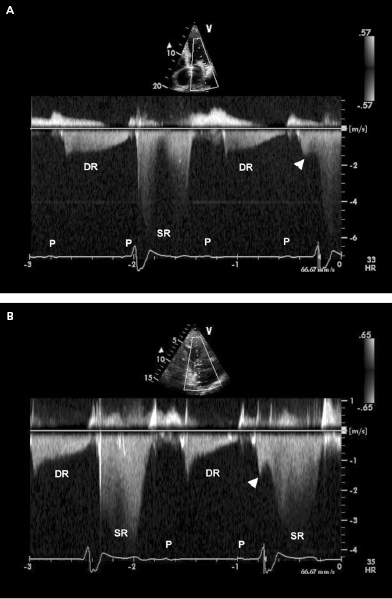
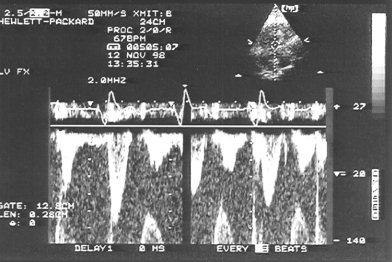
Doppler echocardiography can provide non-invasive insight into physiological, pacemaker-related changes in paced patients, including alterations in pulmonary vein flow and LA mechanical function (Figures 3.10 and 3.11). VA (retrograde) conduction produces a contraction of the atria against closed AV valves, which induces a reversal of blood flow from the LA toward the pulmonary veins. This can be recognized by retrograde flow into the pulmonary vein (z wave) on the pulsed-Doppler echocardiographic recording (Figure 3.10). Even when retrograde conduction during ventricular pacing is absent, atrial contraction may still occur shortly after ventricular activation by chance, resulting in intermittent regurgitation into the pulmonary veins (Figure 3.11). Inappropriately timed atrial reverse flow at the time of ventricular systole markedly decreases the systolic flow velocities of pulmonary veins and reverses flow into the pulmonary veins. A study using transesophageal Doppler echocardiography has demonstrated that atrial reverse flow into the pulmonary veins is a consistent finding in patients during VVI pacing when VA conduction is present. Furthermore, during ventricular pacing (VVI) with VA conduction, patients with clinical signs and symptoms of pacemaker syndrome (i.e. hypotension with dizziness, dyspnea, fatigue) have significantly higher atrial reverse flow velocities into their pulmonary veins than patients without pacemaker syndrome (Figures 3.12 and 3.13).
Atrioventricular Valvular Regurgitation
Effective and properly timed atrial and ventricular contraction is functionally important for complete mitral valve leaflet closure.19 Thus, it is not surprising that RV pacing (VVI) is associated with substantial worsening or production of significant mitral and/or tricuspid regurgitation in some patients due to the loss of AV synchrony or an inappropriately timed AV interval.20 In an experimental model in sheep, ventricular pacing was associated with delayed mitral valve leaflet closure and increased mitral valve regurgitant volume compared with baseline in sinus rhythm. In contrast, during AV pacing, mitral regurgitant volume and leaflet and annular dynamics were unchanged from baseline.
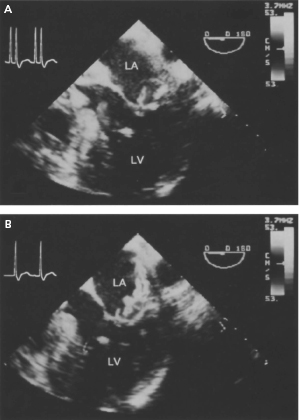
A number of case reports have described dramatic reductions in the severity of mitral regurgitation (MR) in patients with severe MR during ventricular pacing after upgrading to a dual chamber device (Figure 3.14). In one study, the majority of patients (67%) with signs and symptoms of pacemaker syndrome during ventricular pacing (VVI) with retrograde conduction had significant MR (≥moderate) documented. Strikingly, MR disappeared in these patients after reprogramming to DDD mode. Other investigators likewise have demonstrated that the extent of valve regurgitation may be an important factor in the genesis of subclinical pacemaker syndrome. Thus, RV pacing can cause AV valve regurgitation in some patients that may resolve with the resumption of AV synchrony using AAI pacing or AV pacing programming to DDD mode.
When atrial contraction is not followed by an adequately synchronized ventricular contraction, the AV pressure gradient reverses during atrial relaxation and diastolic ventricular pressures exceed those in the atria (VA pressure gradient).21 This results in diastolic AV valve regurgitation because the mitral and tricuspid valves are incompletely closed. The presence of diastolic MR highlights the importance of adequately timed AV synchrony for optimal diastolic filling of the ventricle. Diastolic mitral and tricuspid regurgitation is a common finding when AV synchrony is lost, such as during ventricular-only pacing (e.g. VVI) or in the presence of AV conduction abnormalities (Figure 3.15). Significant elevation of LV end-diastolic filling pressures will contribute to worsening of diastolic MR during AV dyssynchrony.
In most pacemaker patients, however, worsening of AV regurgitation appears to play a lesser role in elevating atrial pressure than does the contraction of the atria against closed AV valves during ventricular pacing. Furthermore, in the absence of ventricular dysfunction or structural heart disease, diastolic MR during AV desynchronization is usually a benign phenomenon without significant therapeutic clinical implications. Using transesophageal Doppler echocardiography, significant MR was found during VVI pacing with VA conduction in only 8% of a group of patients without clinical pacemaker syndrome.
Blood Pressure
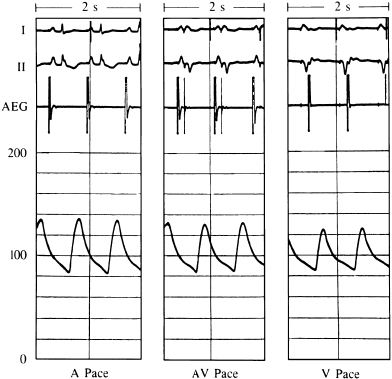
For grouped patient data, AV synchrony generally provides similar or slightly greater systolic and mean blood pressures than ventricular pacing. A typical example of the blood pressure comparison among atrial, AV, and ventricular pacing is shown in Figure 3.16. In this case, essentially no differences exist between the blood pressures when comparing atrial with AV pacing. The blood pressure during ventricular pacing is slightly lower than during either atrial or AV pacing.
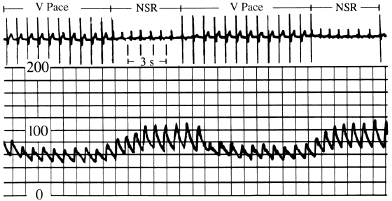
Although not the typical response, some individuals do have dramatic and symptomatic decreases in systemic blood pressure when ventricular pacing is instituted (Figure 3.17). Several mechanisms may be responsible for this phenomenon. Loss of LV preload volume from mistimed atrial contraction (loss of atrial “kick”) and activation of inhibitory cardiac reflexes (due also to inappropriately timed atrial contraction) have been the mechanisms most commonly implicated. This marked hypotension can produce dramatic symptoms, including syncope. In a clinical setting, if this problem is suspected but hypotension with symptoms cannot be reproduced in a supine position, an upright or semi-upright posture may unmask the problem, especially if it is related to a LV preload deficiency caused by loss of atrial contribution to ventricular filling. An important consideration in the hemodynamic response to ventricular pacing is VA conduction. VA conduction, the ability to conduct electrical impulses retrograde from the ventricles through the AV junction to the atria, can lead to atrial contraction during ventricular systole or, in cases of long VA conduction, early diastole. This can cause loss of the atrial contribution to ventricular filling as well as other hemodynamic problems. VA conduction has been found in as many as 90% of patients with sick sinus syndrome and in 15–35% of individuals with a variety of degrees of AV block. During ventricular pacing, even when VA conduction is not intact, if the ventricular pacing rate is unequal to the atrial rate, there will be periods of time when atrial contraction occurs during ventricular systole with the resulting disadvantageous hemodynamics.
Cardiac Output
Properly timed atrial contraction provides a significant increase in ventricular end-diastolic volume and is responsible for the so-called atrial kick (Figure 3.18). Studies have shown a wide range in the actual importance of the atrial contribution to ventricular filling depending on the patient population and study conditions. By increasing the end-diastolic volumes (right and left ventricles), the cardiac output is, in turn, increased. The average increase in cardiac output in a pacing population, if AV synchrony is maintained, is between 15% and 25% in comparison with non–AV-synchronized ventricular pacing. In a recent study in pediatric patients with congenital complete AV block and normal ventricular function, cardiac output was measured using a noninvasive method involving inert gas rebreathing and was shown to be 18% higher in synchronous AV pacing with optimized AV intervals than during VVIR pacing.22
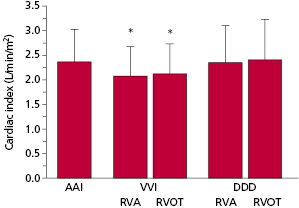
The hemodynamic benefits of AV-synchronized versus ventricular pacing also have been demonstrated for patients after myocardial infarction and cardiac surgery. Patients with reduced cardiac output—especially if such reduced function is due to relative volume depletion or only mild-to-moderately depressed LV function—frequently benefit significantly from maintenance of AV synchrony. In a group of patients with severe LV systolic dysfunction (mean LV ejection fraction, 0.21 ± 0.07) and New York Heart Association (NYHA) class II–IV heart failure, there were significant reductions in cardiac index (∼12%) with single chamber VVI pacing compared with pacing modes that maintained AV synchrony (AAI or DDD with ventricular pacing from the RV apex or outflow tract)23 (Figure 3.19).
There is a general perception that patients with abnormal cardiac function benefit most from maintenance of AV synchrony. This may be true, but the reasons are frequently not due to better cardiac output. In fact, if cardiac output were the only hemodynamic consideration, it is patients with very poor ventricular function (markedly increased end-diastolic volume and depressed ejection fraction) that benefit least from AV synchrony. This can be best understood by using the concept of ventricular function curves that compare stroke volume or cardiac output with LV end-diastolic volume or preload.
Figure 3.20 shows hypothetical ventricular function curves for a patient with normal ventricular function (curve 1), one with moderate LV dysfunction (curve 2), one with very poor LV function and a markedly dilated ventricle (curve 3), and one with hypertrophic cardiomyopathy (curve 4). These curves describe the performance of the LV in generating stroke volume (or cardiac output) in relation to the end-diastolic volume (or preload). In patients with normal LV function (curve 1), as end-diastolic volume increases, stroke volume (and cardiac output) increases until the flat or descending portion of the curve is reached. In patients with depressed LV function (curves 2 and 3), there is a lesser increase in stroke volume that depends on end-diastolic volume to the point that, in patients with poor LV function (curve 3), there is negligible improvement in stroke volume with further increases in end-diastolic volume. On the other hand, patients with hypertrophic or hypertensive cardiomyopathy tend to have small ventricles that are normal (i.e. normal systolic function) or hyperdynamic in function (curve 4). Small increases in end-diastolic volume can significantly increase stroke volume in this situation. As has been discussed, AV synchrony provides the atrial kick that increases end-diastolic volume. Point A on these curves represents the hypothetical stroke volume and end-diastolic volume during AV pacing. Point B represents stroke volume and end-diastolic volume during ventricular pacing (with associated loss of atrial kick). In the normal situation (curve 1), although end-diastolic volume is greater and hence stroke volume is greater during AV-synchronized pacing, the loss of AV synchrony during ventricular pacing does not drop the end-diastolic volume and the stroke volume significantly. This, however, might not be the case if the filling volume were otherwise reduced by volume depletion due to blood loss, diuresis, and so on. In these situations, even with normal LV function, the higher end-diastolic volumes and stroke volumes provided by properly timed atrial contraction might be important. With depressed LV function of a moderate degree (curve 2), although maintenance of AV synchrony provides for a greater end-diastolic volume, the stroke volume advantage is diminished. It is possible that, due to overall reduction in stroke volume (and cardiac output), even this modest increment in stroke volume would be of important benefit. In patients with more severely depressed LV function and extremely flat LV function curves (curve 3), end-diastolic volume can be augmented with maintenance of AV synchrony, but there is little advantage in stroke volume.
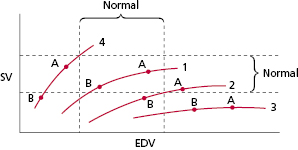
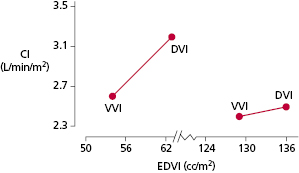
With regard to patients with hypertrophic cardiomyopathy or highly non-compliant ventricles (curve 4), maintenance of AV synchrony may be very important in enhancing stroke volume and cardiac output because of the relatively small end-diastolic volumes. This is because small increments in end-diastolic volume may substantially increase the stroke volume due to the steep slope of the curve. This relatively steep-sloped ventricular function curve is also characteristic of patients with ventricular diastolic dysfunction, a group for whom maintenance of AV synchrony also is very important. Figure 3.21 displays this concept in a group of patients studied using quantitative nuclear techniques.24 Although only data from the supine position at 80 ppm are shown (AV interval 150 ms during AV-synchronized pacing), the same situation hemodynamically was found to be present at a faster pacing rate (100 ppm) and in an upright posture.
The conceptual approach of ventricular function curves is useful for practical understanding of the benefits of AV synchrony. However, movement along single ventricular function curves probably is overly simplistic. A number of variables that can affect hemodynamic function, such as afterload, can be modulated by other factors that might cause shifting from one curve to another, as well as movement along a given curve. In this regard, systemic vascular resistance may be significantly higher during ventricular pacing. The increase in systemic vascular resistance is related mechanistically to an increase in neural reflexes. These autonomic responses to ventricular pacing include increased peripheral sympathetic nerve tone and circulating catecholamine levels supportive of blood pressure when cardiac output is diminished.
A hemodynamic variable that is usually not significantly affected in most individuals during AV versus ventricular pacing is ejection fraction. Although the components of ejection fraction—both end-diastolic volume and stroke volume—are significantly lower during ventricular pacing, ejection fraction is unaffected because both the numerator (stroke volume) and the denominator (end-diastolic volume) of the ejection fraction vary in the same proportion. Ejection fraction is a crude measurement of contractile performance, so it is not surprising that the presence or absence of AV synchrony, which primarily affects preload and cardiac output, has no effect on ejection fraction.
Autonomic Neural and Neurohormone Level Alterations
Single chamber RV pacing is associated with higher levels of sympathetic nerve activity, cardiac norepinephrine spill over, and plasma epinephrine and norepinephrine levels than AV synchronous pacing.25 Catecholamine levels increase most during VVI pacing with retrograde conduction. The enhanced sympathetic outflow appears to be mediated by the arterial and cardiopulmonary baroreflexes.
Plasma levels of natriuretic peptides, including atrial and brain natriuretic peptides (ANP and BNP, respectively), appear to reflect the presence of appropriate AV synchrony and the hemodynamic changes produced by different cardiac pacing modes. A number of studies have demonstrated that RV pacing without AV synchrony (VVI) is associated with higher levels of plasma ANP and BNP, when compared with pacing modes with AV synchrony (AAI or DDD).26 Increased natriuretic peptide levels develop within several minutes after AV synchrony is lost, both at rest and during exercise. These hormonal alterations persist over the long term, but return toward normal after AV synchrony is restored. The release of these hormones occurs in response to worsened cardiac hemodynamics, reflecting atrial distension, higher atrial pressures, and increased LV filling pressures with AV desynchronization. Low levels of natriuretic peptides might be used as a cardiac biomarker reflective of the presence of a physiological pacing mode.
Mortality and Cardiovascular Outcomes
At least five prospective randomized trials have compared AV synchronous pacing modes (AAI or DDD with or without rate response) with the ventricular-only pacing mode (VVI) on mortality and important cardiovascular outcomes in patients with bradycardia indications for permanent pacemaker implantation27–31 (Table 3.1). A meta-analysis has summarized the results of these five trials in over 7000 patients.32 The major conclusions of this systematic review of these important clinical trials in the field of cardiac pacing were that (1) atrial-based pacing does not reduce all-cause mortality, cardiovascular death, or heart failure; (2) atrial-based pacing does reduce the incidence of AF [hazard ratio (HR) 0.80; 95% confidence interval (CI) 0.72–0.89; P = 0.00003); (3) atrial-based pacing is associated with a reduction of borderline significance in stroke (HR 0.81; 95% CI 0.67–0.99; P = 0.035); and (4) no patient subgroups derived a special benefit from atrial-based pacing. Aside from these conclusions, there is evidence derived from the clinical trials that dual chamber devices modestly improve quality of life and are less likely to be associated with pacemaker syndrome.33 Thus, most clinicians believe that the clinical evidence is sufficient to justify routine use of pacing modes that provide AV synchrony. Consistent with this clinical practice, the 2012 HRS/ACCF Expert Consensus Statement on Pacemaker Device and Mode Selection give AV synchronous pacing modes a class I recommendation in patients with sinus node dysfunction (DDD or AAI) or AV conduction block (DDD).34
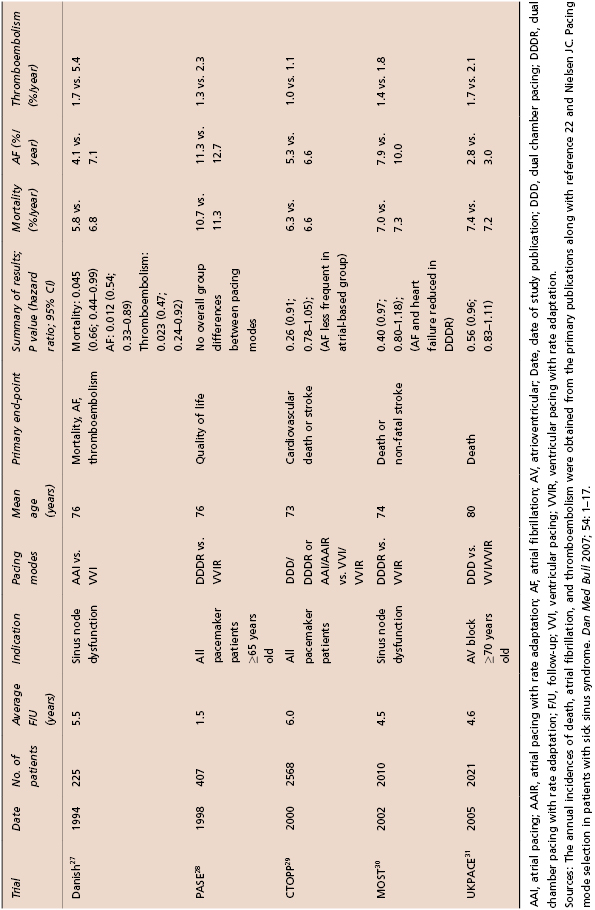
Table 3.1 Randomized controlled trials of pacemaker mode selection
Effects of Optimal Atrioventricular Interval Timing
The mere presence of a consistent AV relationship may not ensure the best possible hemodynamics or clinical outcomes in a patient with a cardiac pacemaker. The potential contribution of a correctly timed AV delay to cardiac output varies from 13% to 40%.35 Some have suggested that when the AV delay is selected empirically, it is programmed incorrectly in approximately two-thirds of patients.36 Some AV timing relationships clearly are detrimental such as during 1:1 VA conduction or with inappropriately short or long AV delays. An excessively short AV delay may limit active filling of the ventricle and promote systolic AV valvular regurgitation as ventricular contraction begins while the AV valves are open. An excessively long AV delay may result in loss of the booster pump function of the atria related to two factors: (1) inadequate diastolic filling of the ventricle because atrial contraction does not occur near the onset of LV systolic contraction but rather is superimposed on early passive filling; and (2) diastolic AV valvular regurgitation due to reopening of the valve before ventricular systole.
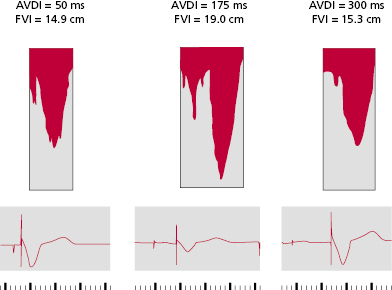
An optimally timed AV interval maximizes LV filling and stroke volume by the Frank–Starling mechanism. Atrial contraction should occur optimally just before the isovolumic contraction phase. This was well demonstrated in an acute experimental model in canines with complete AV block in which net LV chamber filling was measured with a mitral annular flow probe while the AV timing delay was varied.37] Increasing AV delay from 0 (simultaneous AV contraction) to a more physiological range (e.g. around 80–120 ms) enhanced net chamber filling. In the physiological range of AV intervals, atrial systole is completed and the mitral valve closes as LV pressure begins to rise. At long AV delays (e.g. >275 ms), net filling declines, and at very long delays (e.g. 320 ms), net filling actually falls below that observed at no AV delay. At long AV delays, atrial systole is superimposed with early rapid filling, mitral valve closure is dependent on LV pressure rise, which generates presystolic regurgitation, and net LV filling declines.
In patients at rest with normal ventricular function, the optimal range for the AV interval when the RA and ventricle are paced is on average between 150 and 200 ms (Figure 3.22). This interval however may vary considerably from patient to patient and from time to time in a specific patient (i.e. as short as 100 ms and up to 250 ms). For the reasons noted below, the optimal AV interval when the atrium is sensed will be 20–50 ms shorter than when the RA is paced.
Interindividual variation in the optimal AV interval depends on the degree of interatrial and interventricular conduction delays that occur in response to DDD pacing. In conventional right heart pacing systems, the activation sequence of the left-sided chambers may be quite different from the pacemaker programmed values in situations where marked interatrial and interventricular conduction delays develop in response to pacing or are present intrinsically. Optimal LV contraction should start immediately at the end of LA transport. However, delays introduced by sensing and pacing of right heart chambers may cause misalignment between electrical and mechanical events, especially of the left heart chambers. Optimal AV pacing may need to account for and correct for these delays introduced by pacing with an appropriately timed, AV pacing interval. Such a “physiological” AV interval compensates for pacing- and sensing-induced delays, and assures that LA transport is completed just before LV contraction starts.
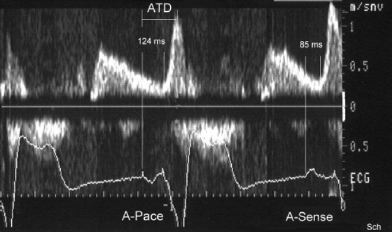
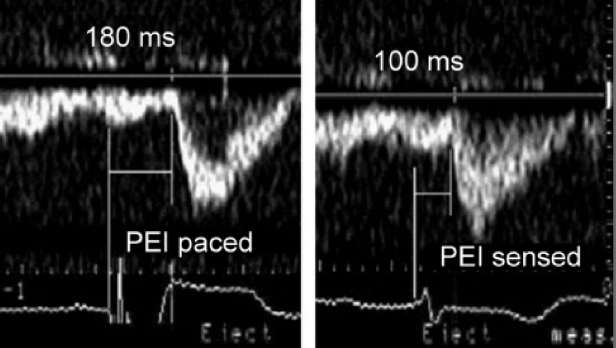
For example, RA pacing (especially from the RA appendage or lateral RA wall) prolongs the duration of the P wave and consequently the time from the P wave onset to the end of LA transport, or the atrial transport delay (ATD) (Figure 3.23). Likewise, RV pacing, especially when performed from the RV apex, alters the onset of LV systole and prolongs the interventricular delay (Figure 3.24). In addition to artificial pacing and sensing delays, in patients with underlying, high-grade, interatrial conduction delay in the presence of atrial disease, long AV intervals (250–350 ms) sometimes may be required to provide effective LA systole. Programming a short or “physiological” AV delay in such patients may result in a LA that is activated late, producing LA contraction against a closed mitral valve. In patients with interatrial delay or block, consideration may also be given to pacing from the RA septum (Bachmann’s bundle), coronary sinus, or biatrially to advance left electrical atrial activation.
Manipulation of the AV delay using dual chamber pacing devices as a primary therapeutic modality in patients with dilated cardiomyopathy was a focus in the field of cardiac pacing prior to the demonstration of the benefits of biventricular pacing in heart failure. Several small studies evaluated the impact of dual chamber pacing with optimal AV delay on hemodynamic and clinical parameters in patients with heart failure and significant MR.38–40 However, conflicting results were published in this regard. In an early study, Brecker et al. studied the effects of dual chamber pacing in patients with dilated cardiomyopathy and prolonged AV delay.41 Shortening the AV delay by institution of AV synchronous pacing with leads in the RA and RV apex reduced diastolic regurgitation and enhanced diastolic filling. In a randomized trial, 38 patients in sinus rhythm with heart failure were randomly assigned to optimal medical therapy or optimal medical therapy with dual chamber pacing.40
Stay updated, free articles. Join our Telegram channel

Full access? Get Clinical Tree


