Ventilation, Pulmonary Blood Flow, and Ventilation–Perfusion Relationships
This chapter and the two succeeding it together share responsibility for presenting the physiological basis of normal pulmonary gas exchange. Gas exchange occurs by an integrated series of gas transport steps between the environmental air we breathe and the Hb molecule of the red cells passing through the pulmonary capillaries. These transport steps are of two types—diffusive and convective, and a number of conceptually separate diffusive as well as convective processes interact to accomplish the gas exchange mission. This is true both for gases that are taken up from the environment into the blood (i.e., O2 and occasional toxic gases or volatile anesthetics) and for gases that are eliminated from the body (i.e., CO2 and volatile anesthetic agents).
This chapter deals principally with the convective processes and Chapter 16 with those involving diffusion. However, since the two types of process occur simultaneously they are closely linked.
BASIC OUTLINE OF THE GAS EXCHANGE PATHWAY
This section dwells on O2, being the gas of principal physiological interest. However, the pathway components are of course identical for all gases and furthermore do not depend on whether the gas is being taken up (O2) or eliminated (CO2). On the other hand, distinct quantitative differences in the uptake or elimination patterns of different gases exist, but those are readily explained by differences in their fundamental physical or chemical properties, and not by transport pathway differences.
To understand the gas transport pathway one must first appreciate the anatomy of the lungs, laid out in detail in Chapter 2. The salient functional features are presented in Figure 14-1.
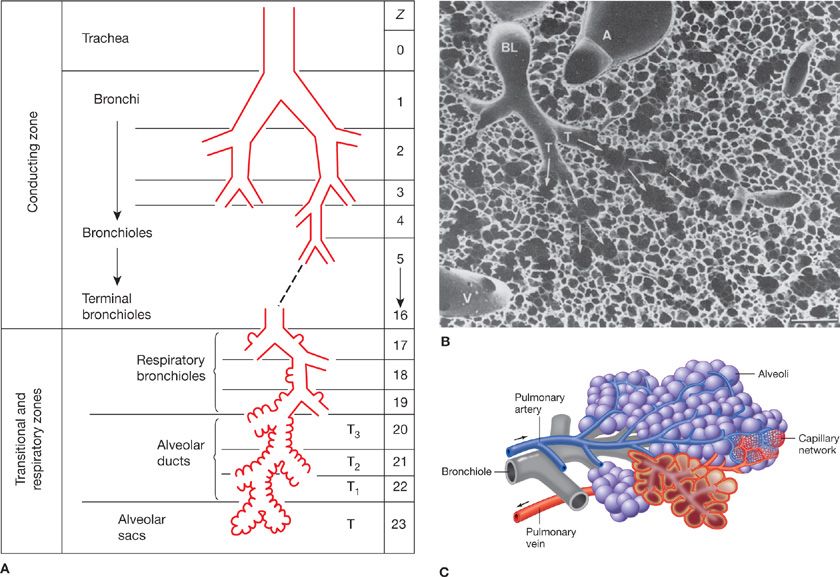
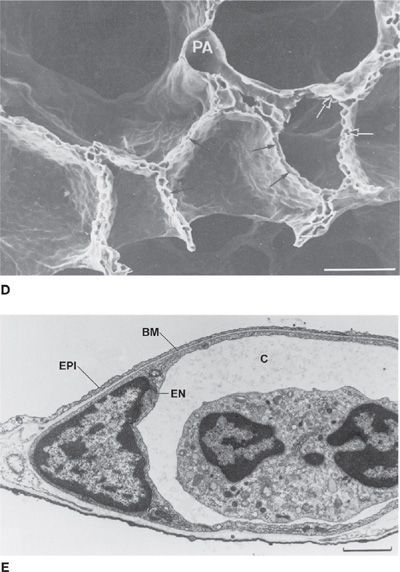
Figure 14-1 Principal anatomical features of the lung related to gas exchange. A shows the organization of branching airways, mirrored by a photograph of a lung slice showing terminal and respiratory bronchioles and the alveolar parenchyma (see also B) (A. Modified with permission from Weibel ER: Morphometry of the Human Lung. Heidelberg, Springer-Verlag; 1963). C shows how the capillaries are wrapped around alveoli and D is a scanning electron micrograph indicating the rich capillary networks in the alveolar walls (PA, pulmonary artery). E is a transmission electron micrograph showing the capillaries (C) and the three layers of the blood–gas barrier (EN, endothelium; BM, basement membrane; and EPI, epithelium). (B, D, and E. Reproduced with permission from Weibel ER. The Pathway for Oxygen. Cambridge, MA: Harvard University Press; 1984.)
The chest wall (rib cage and diaphragm) contains muscles that on contraction expand the volume of the chest cavity and thus reduce the hydrostatic pressure of the pleural space, expanding the lungs with air drawn in via the mouth and nose. Although there is but a single air passage in the neck (i.e., the trachea), this soon branches into right and left main bronchi. These also divide many times, essentially dichotomously. There are some 16 such orders of branching of these bronchi, resulting in a structure that resembles an inverted deciduous tree without its leaves in winter.1 With each successive branch the airways become shorter and narrower, but ever greater in number, usually doubling at each branching. Thus, although the cross-sectional area of any one airway becomes smaller with each branching, the greater number of airways more than makes up for loss of individual cross-sectional area such that the sum of cross-sectional areas of all airways of a given generation rises essentially exponentially with each branching (Fig. 14-2). The total volume of gas in these 16 conducting airway generations is called the anatomic or conducting airway dead space, and approximates 1 mL per pound of body weight. After these 16 or so successive branches, the tubular, purely conducting airways begin to show alveolar units in their wall (generations 17–19 or so) and these finally give way to fully alveolated structures (in succession: alveolar ducts, alveolar sacs, and alveoli). There are some 300 million alveoli, each about 300 μm in diameter. They are blind structures so that ventilation has to be accomplished by a tidal, in-and-out process (rather than a flow-through process as for pulmonary blood flow). The alveoli can be seen in Figure 14-1, from a different perspective. For gas exchange to occur, O2 must be moved from the mouth all the way to the alveoli—it is only within alveoli that gas exchange occurs.
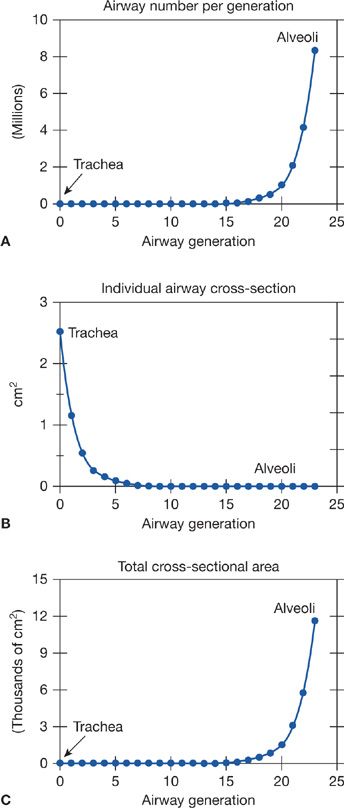
Figure 14-2 Relationship between number (A) and cross-sectional area (B) of the airways at a given generation. Note that total airway cross-sectional area (C) increases extremely rapidly beyond airway generation 15 or so, the beginning of the respiratory zone for gas exchange.
Each alveolus is densely covered in a capillary network, seen from various perspectives in Figure 14-1. This network is closely applied to the alveolar gas space as Figure 14-1 shows, with on average only about 1/2 μm of cellular and interstitial tissue between the blood inside the capillary and the alveolar gas outside.2 The capillary network is fed by the pulmonary arterial tree which branches alongside the airways in a very similar pattern as the airways. The capillaries then drain into venules that join to form larger and larger vessels, eventually becoming the pulmonary veins that drain oxygenated blood into the left atrium. This coalescence of venous vessels forms a similar branching tree to the pulmonary arteries and airways, but in reverse. The right ventricle is responsible for unidirectional pumping of blood through this vascular system.
The gas exchange pathway from the lips to the left atrium is therefore highly complex structurally, and understanding how gases pass along the pathway requires following the events an O2 molecule must participate in between the lips and the left atrium.
1. The first step is inspiration of air into the trachea via mouth and nose. Accomplished by inspiratory chest wall muscle contraction which reduces intrathoracic pressure, this step is convective (like water flowing from a region of high to low pressure along a garden hose). All the respired air must pass the trachea but at the first branch point some air goes to the right lung, the rest to the left. At each successive branch point, similar mass-conserving distribution of air must occur between the daughter branches of each parent pathway. Remembering that there are some 23 total branchings from the mouth to the 300 million alveoli, there is a very real risk of quite uneven distribution of that inspired air amongst those alveoli.3 The principal determinants of how air is distributed at branch points (i.e., between daughter branches) are the mechanical properties of the respiratory system: the compliance (elastic properties), the resistance, and the inertial properties. These concepts are more fully treated in Chapter 10.
2. During normal resting inspiration, flow is laminar in most of the airways. Thus inspired gas develops a parabolic profile due to higher molecular velocities in the center than periphery of the airway (Fig. 14-3). The parabolic “tongue” of inspired gas in Figure 14-3 moves down an airway, while around the tongue is gas remaining from the previous expiration. The tongue therefore has O2 at a concentration of 21% and essentially no CO2. The gas around the tongue, having undergone gas exchange during the preceding breath, has about 14% O2 and 5% CO2. Consequently, during forward motion of this tongue toward the alveoli, O2 will diffuse from the tongue to its surrounding gas while CO2 will diffuse in the opposite direction. This is called Taylor dispersion,4 and it reduces the forward transport of O2 produced by the onward convective movement of the tongue. This effect however is considered quite small and is generally not of significance to overall gas exchange.
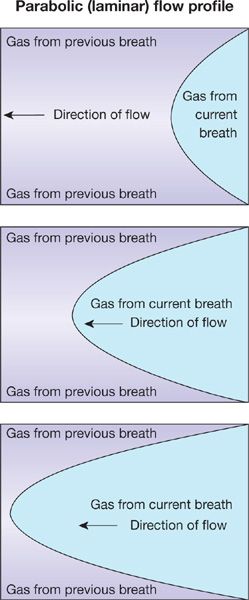
Figure 14-3 The parabolic profile of laminar flow. The three panels indicate sequential points in time during a single inspiration proceeding from right to left. Because the gas remaining from the previous breath has a low oxygen concentration and high CO2 concentration relative to that of the inspired gas in the current breath, there will be diffusive exchange between the parabolic tongue and the surrounding gas (Taylor dispersion).
Note that if inspiration occurs at high rates as in exercise, such laminar flow may not occur in the larger airways—it may be turbulent and then Taylor dispersion is essentially noncontributory, as the turbulent mixing evens gas concentrations across the airway lumen.
3. Figure 14-2 shows the exponential increase in airway cross-sectional surface area as one proceeds deeper and deeper into the lungs. The significance of this curve is that since the mass flow rate of inspired gas is the same at every generation (because the airways are simply a conducting system), the forward velocity of O2 molecules falls (since flow rate is the product of velocity and cross-sectional area). As it happens, by about generations 17 to 19, where the alveoli are just beginning to appear, this forward velocity has become so low that passage of O2 from here on out to the alveoli is heavily dependent on simple gaseous diffusion, not just on continuing convective flow.
4. If alveoli are not equally ventilated with gas (and equally perfused with blood), their alveolar O2 concentration will differ, as explained later in this chapter. Because adjacent alveoli are so physically close, there can be considerable diffusion of O2 between such alveoli when their O2 levels are different. This passive process tends to reduce concentration differences between these alveoli. However, although it can be detected experimentally, it is of probably minor clinical significance. Step 3 (and to some extent Step 4) are responsible for most of the alveolar gas mixing that must occur for gas exchange to take place—that is, the mixing of each breath of newly inspired gas with alveolar gas still present from prior breaths.
5. The heart acts as a massaging pump to further enhance gas mixing into the alveolar gas spaces. Alternate filling and emptying of the cardiac chambers respectively facilitates exhaling and inhaling of airway gas into those alveoli physically close to the heart,5 but has little effect on more distant alveoli. Although a well-known and easily demonstrated phenomenon, this so-called cardiogenic mixing is probably also of minimal physiological impact for gas exchange.
6. Once the dominant convective and diffusive gas transport steps have brought O2 from the lips to the alveolar gas spaces, O2 physically dissolves in the tissues separating alveolar gas from capillary blood, the blood–gas barrier (Fig. 14-1). O2 then moves by diffusion through the blood–gas barrier and into the plasma. Over 98% of these O2 molecules diffuse further, that is, into the red cell interior, and then bind rapidly to hemoglobin. The remaining 2% or so remain physically dissolved in the plasma and red cell water.
This transport process from alveolar gas to hemoglobin is accomplished passively by simple diffusion: No convective forces or active transport processes are involved. The diffusion process is discussed more fully in Chapter 16. In normal lungs at rest, this process is very rapid and causes no O2 transport limitation.
7. Finally, the red cells are transported convectively by cardiac pumping action out of the pulmonary capillaries and into the pulmonary veins and then to the left atrium, and left ventricle, finally reaching the various body tissues.
POTENTIAL DISRUPTIONS OF THE GAS TRANSPORT PATHWAY
If all the above elements of the transport pathway mentioned previously were functionally perfect, the partial pressure of O2 (and other gases) would be identical in the gas of all 300 million alveoli and equal to that in systemic arterial blood. The system comes close to perfection in health,6 but there is never complete equivalence of alveolar and arterial pressures, even in healthy young, normal people. Aging further leads to a progressive impairment of the pathway with arterial PO2 falling from 95 to 100 mm Hg at age 20 to 75 to 80 mm Hg at age 80 or thereabouts.7 However, alveolar PO2 tends to be invariant with age. Thus, the difference between alveolar and arterial PO2 steadily increases from about 5 to 10 mm Hg to about 20 to 25 mm Hg over this age range. Pulmonary diseases such as asthma, emphysema and bronchitis, fibrosis, pneumonia, and many others can greatly disrupt gas transport to the point of causing death from insufficient tissue O2 supply.
Consequently, it is essential to have a good understanding of the O2 transport pathway and what may affect it even in health, in order to appreciate the problems seen in pulmonary diseases.
A traditional view of how to consider abnormalities of the transport pathway has evolved over the years and is very useful as a framework for discussion. It is based upon the end result of gas exchange – the arterial PO2 – and there are different reasons why this variable can fall below normal values.
Four principal potential mechanisms of failure of the O2 transport pathway can lead to a reduced arterial PO2 (i.e., to arterial hypoxemia):
1. Hypoventilation
2. Diffusion limitation
3. Shunt
4. Ventilation–perfusion (![]() ) inequality.
) inequality.
These are the so-called “intrapulmonary” factors that directly cause hypoxemia. Modulating “extrapulmonary” factors are also important. These include changes in inspired O2 concentration, in total cardiac output, in overall metabolic rate, and in Hb concentration.
The four “intrapulmonary” factors are now defined and discussed.
 HYPOVENTILATION
Normal levels of ventilation produce a tightly regulated arterial PCO2 at 40 ± 2 mm Hg in normal subjects with several control systems in place to ensure this (for details, see Chapter 11). However, if overall ventilation is reduced for any reason, alveolar PCO2 (PACO2), and therefore arterial PCO2, must rise to maintain constant the elimination of metabolically produced CO2. Reciprocally, alveolar PO2 (PAO2), and hence arterial PO2, will fall (and by relatively similar amounts as PCO2 will rise). The alveolar gas equation8 quantitatively relates PAO2 and PACO2, and is used to calculate how much PAO2 will change for a change in PACO2:
![]()
PIO2 and FIO2 are inspired O2 partial pressure and fractional concentration, respectively, and R is the respiratory exchange ratio, normally 0.8.
Hypoventilation represents a failure of step 1 of the gas transport pathway (see above) and can occur for several reasons: (1) the control centers in the nervous system that regulate ventilation could malfunction due to trauma, diseases, drugs, or anesthetics; (2) there could be neuronal or neuromuscular dysfunction of the nerves supplying the chest wall muscles of respiration; (3) the chest wall muscles could be fatigued, damaged, or paralyzed; or (4) the airways or chest wall could be disrupted from trauma or other mechanical derangement such as compression, or in the case of airways, obstruction.
Conceptually this type of problem is usually thought of as a whole-lung issue, usually with obvious causes, and can be reversed by recognizing the cause and taking appropriate reparative and/or ventilatory supportive steps.
 DIFFUSION LIMITATION
Whereas diffusive transport plays a recognizable, if small, role within the airways and alveolar gas (see above), the concept of diffusive limitation affecting arterial PO2 is more usually associated with transport step 6 – diffusion of O2 from alveolar gas into the capillary and red cell.
This topic is specifically the focus of Chapter 16 and is not dealt with here. Indeed, the ensuing discussion of other factors sets aside diffusion limitation of O2 transport for the sake of simplicity and assumes that the diffusive exchange of O2 (and CO2) between alveolar gas and capillary blood proceeds to completion within a single red cell’s passage through the pulmonary microcirculation. This is reasonable under most conditions. Diffusion limitation in health is seen at sea level in some but not all athletes9 but only at or near maximal exercise. It is universally seen in normal subjects exercising at altitude.10,11
 SHUNT
SHUNT
A shunt is a blood pathway that does not allow any contact between alveolar gas and red cells, so that no gas exchange occurs in the affected region. Consequently, blood passes through a shunt maintaining a mixed venous blood composition. When this blood reaches pulmonary veins, the left atrium and eventually arterial blood, it mixes with other blood that has undergone alveolar gas exchange. The result is a fall in arterial PO2 and potentially an increase in arterial PCO2 (arterial PCO2 may not increase if the patient raises his or her level of ventilation, but hypoxemia will persist).
Classical pathophysiological scenarios giving rise to shunts are: (1) pulmonary edema, which fills alveoli with fluid, thereby abolishing their ventilation and any gas exchange; (2) alveolar filling with cellular and micro-organismal debris as in pneumonia, with the same result as in edema; (3) collapse of a region of lung due to pneumothorax, gas absorption distal to a fully obstructed airway, or to external compression; (4) rarely, the presence of abnormal arteriovenous vascular channels in the lungs, that can occur in, for example, hepatic cirrhosis; and (5) direct right-to-left vascular communications at the level of the heart or great (extrapulmonary) blood vessels.
 VENTILATION–PERFUSION (
 ) INEQUALITY
The exquisite and complex branching architecture of the airways and of the blood vessels makes the lungs very susceptible to the potential problem of nonuniform distribution of alveolar ventilation and of pulmonary blood flow. Whenever alveoli are ventilated at less than average rates, for example if their feeding airways become partially obstructed for any reason, the ratio of ventilation to blood flow (![]() ratio) will fall (assuming their blood flow does not fall similarly). In certain other conditions, lung regions may suffer a reduction in local blood flow rather than ventilation, so that the
ratio) will fall (assuming their blood flow does not fall similarly). In certain other conditions, lung regions may suffer a reduction in local blood flow rather than ventilation, so that the ![]() ratio rises above the average value in those areas.
ratio rises above the average value in those areas.
Whenever there is a range of ![]() ratios in a lung such that the
ratios in a lung such that the ![]() ratio is not identical everywhere, it is said that
ratio is not identical everywhere, it is said that ![]() inequality exists. The pathological cause of
inequality exists. The pathological cause of ![]() inequality does not matter in this definition, nor whether the problem originates in the airways or blood vessels. The principal concept is that, compared to a lung having the same total alveolar ventilation and blood flow, a lung that has
inequality does not matter in this definition, nor whether the problem originates in the airways or blood vessels. The principal concept is that, compared to a lung having the same total alveolar ventilation and blood flow, a lung that has ![]() inequality will exchange (all) gases in an inefficient manner.12 The result is hypoxemia and, potentially, hypercapnia (raised arterial PCO2). A large section of this chapter presents the physiological reasons for this effect of
inequality will exchange (all) gases in an inefficient manner.12 The result is hypoxemia and, potentially, hypercapnia (raised arterial PCO2). A large section of this chapter presents the physiological reasons for this effect of ![]() inequality.
inequality.
Understanding of ![]() inequality can be demanding, but no matter what its pathologic origins, the concepts are similar.
inequality can be demanding, but no matter what its pathologic origins, the concepts are similar. ![]() inequality can occur at many different scales. Not uncommonly, it can be manifest on a large scale as differences between the right and left lungs. Classical examples of this include unilateral atelectasis, pneumothorax, pulmonary embolus, or pneumonia. All these are relatively common phenomena that can lead to severe gas exchange disturbances. At the other end of the scale, there can be
inequality can occur at many different scales. Not uncommonly, it can be manifest on a large scale as differences between the right and left lungs. Classical examples of this include unilateral atelectasis, pneumothorax, pulmonary embolus, or pneumonia. All these are relatively common phenomena that can lead to severe gas exchange disturbances. At the other end of the scale, there can be ![]() ratio differences between essentially adjacent alveoli. However, research has shown that small groups of contiguous alveoli can maintain functional homogeneity of
ratio differences between essentially adjacent alveoli. However, research has shown that small groups of contiguous alveoli can maintain functional homogeneity of ![]() ratios via rapid gas diffusion rates, possibly augmented by collateral ventilation and/or blood flow.13 It is likely that all alveoli distal to individual respiratory (or perhaps terminal) bronchioles can retain functional homogeneity for gas exchange through these mechanisms.14
ratios via rapid gas diffusion rates, possibly augmented by collateral ventilation and/or blood flow.13 It is likely that all alveoli distal to individual respiratory (or perhaps terminal) bronchioles can retain functional homogeneity for gas exchange through these mechanisms.14
In between these two extremes of scale, vascular or airway obstruction at all levels will produce ![]() inequality that, depending on how widespread it is, causes hypoxemia and potentially hypercapnia.
inequality that, depending on how widespread it is, causes hypoxemia and potentially hypercapnia.
Even the young normal lung usually contains ![]() inequality, which explains the 5 to 10 mm Hg PO2 difference between alveolar gas and arterial blood generally observed in healthy young subjects.15 There are several mechanisms for the existence of such
inequality, which explains the 5 to 10 mm Hg PO2 difference between alveolar gas and arterial blood generally observed in healthy young subjects.15 There are several mechanisms for the existence of such ![]() inequality.
inequality.
Gravity-Based Inequality
Ventilation, and, even more so, blood flow are unevenly distributed in a manner systematically influenced by gravity.6,16 This is due respectively to the weight of the lungs and of the blood in the blood vessels. Thus, dependent lung regions receive far more blood flow than nondependent regions, a finding that is in concept independent of body position. It turns out that the gravitational gradient in blood flow considerably exceeds that of ventilation. As a result, the nondependent lung regions are of higher than average ![]() ratio, and the dependent regions are of lower than average
ratio, and the dependent regions are of lower than average ![]() ratio.6 Average
ratio.6 Average ![]() ratio is about 1.0, because total alveolar ventilation and blood flow are similar. At the apex of the upright human lung, the
ratio is about 1.0, because total alveolar ventilation and blood flow are similar. At the apex of the upright human lung, the ![]() ratio is about 3; at the base it is about 0.6, 5-fold lower. There is a smooth gradation between the two extremes as depicted in Figure 14-4. This large-scale apex-to-base gradient in
ratio is about 3; at the base it is about 0.6, 5-fold lower. There is a smooth gradation between the two extremes as depicted in Figure 14-4. This large-scale apex-to-base gradient in ![]() ratios does not produce more than about a 4 mm Hg drop in arterial PO2 (compared to expectations in the absence of this phenomenon), and thus a 4 mm Hg alveolar–arterial PO2 difference.6
ratios does not produce more than about a 4 mm Hg drop in arterial PO2 (compared to expectations in the absence of this phenomenon), and thus a 4 mm Hg alveolar–arterial PO2 difference.6
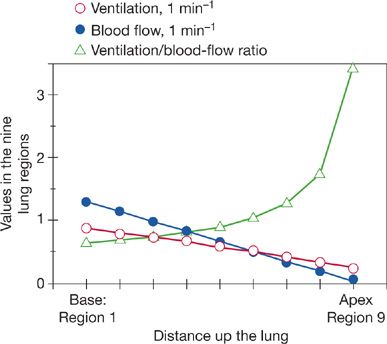
Figure 14-4 Topographical relationships between ventilation and blood flow as a function of distance up and down the upright lung (divided into nine contiguous regions). Although both ventilation and blood flow are higher at the base than at the apex, the ventilation–perfusion ratio (![]() A/
A/![]() ) rises exponentially from the bottom to the top of the lung. (Adapted with permission from West JB. Ventilation/blood flow and gas exchange, 5th ed. Chicago, IL. Blackwell Scientific Publications; 1990.)
) rises exponentially from the bottom to the top of the lung. (Adapted with permission from West JB. Ventilation/blood flow and gas exchange, 5th ed. Chicago, IL. Blackwell Scientific Publications; 1990.)
Fractally Based  Inequality
The branching airway and blood vessel structure of the lung constitutes a fractal system that is innately susceptible to ![]() inequality independent of gravity.17 A fractal system is one in which the geometric pattern (e.g., of airway branching) is repeated at ever smaller scales. In the case of the airway tree it means in essence that the division of an airway into two “daughter” branches is a repeating feature from the large to the small airways. With some 23 sequential orders of branching, very small random inequalities in gas or blood flow distribution repeated at each branch point of the system can rapidly escalate into very significant degrees of nonuniform ventilation or blood flow. To illustrate, consider a branching system of just 16 dichotomous sequences—at each of the 16 branch points, air is not precisely split 50/50 between each daughter pair. Rather, suppose a 49%/51% split—a nonuniform effect of trivial proportions at any one airway branch. The most poorly ventilated regions (receiving 49% of the split at every one of the 16 branchings) end up with only about half as much ventilation as the best ventilated regions that receive 51% of the split at each branch.
inequality independent of gravity.17 A fractal system is one in which the geometric pattern (e.g., of airway branching) is repeated at ever smaller scales. In the case of the airway tree it means in essence that the division of an airway into two “daughter” branches is a repeating feature from the large to the small airways. With some 23 sequential orders of branching, very small random inequalities in gas or blood flow distribution repeated at each branch point of the system can rapidly escalate into very significant degrees of nonuniform ventilation or blood flow. To illustrate, consider a branching system of just 16 dichotomous sequences—at each of the 16 branch points, air is not precisely split 50/50 between each daughter pair. Rather, suppose a 49%/51% split—a nonuniform effect of trivial proportions at any one airway branch. The most poorly ventilated regions (receiving 49% of the split at every one of the 16 branchings) end up with only about half as much ventilation as the best ventilated regions that receive 51% of the split at each branch.
Unless the fractal structure somehow distributes both ventilation and blood flow in a correlated manner to preserve ![]() ratios (even as
ratios (even as ![]() or
or ![]() individually vary), significant hypoxemia could result. Understanding the consequences of the fractal nature of the lung is a topic of much current interest. It appears that there must be correlation of
individually vary), significant hypoxemia could result. Understanding the consequences of the fractal nature of the lung is a topic of much current interest. It appears that there must be correlation of ![]() with
with ![]() since the large potential for fractally based hypoxemia is not generally realized.
since the large potential for fractally based hypoxemia is not generally realized.
Longitudinally Based Inequality
As airways and blood vessels progressively narrow with each branch point, resistance to gas and blood flow increases. Not all alveoli receive gas or blood from airways that have gone through the exact same number of branchings. Hence, some alveoli will be more and some will be less distant from the mouth. Such simple principles suggest the possibility of reduced ![]() and/or
and/or ![]() of those alveoli further from the mouth compared to more proximal alveoli, and therefore the chance of a central to peripheral, or longitudinal, gradient in ventilation and blood flow. Although not universally observed, there is a fair amount of evidence that such inequality exists,18 but its contribution to gas exchange is hard to establish. To the extent that similar physical principles apply to both gas and blood flow in the present context, one can theorize that more distant alveoli have both less ventilation and blood flow, so that again there is a natural tendency to preserve the
of those alveoli further from the mouth compared to more proximal alveoli, and therefore the chance of a central to peripheral, or longitudinal, gradient in ventilation and blood flow. Although not universally observed, there is a fair amount of evidence that such inequality exists,18 but its contribution to gas exchange is hard to establish. To the extent that similar physical principles apply to both gas and blood flow in the present context, one can theorize that more distant alveoli have both less ventilation and blood flow, so that again there is a natural tendency to preserve the ![]() ratio between central and peripheral regions.
ratio between central and peripheral regions.
Anatomically Based Inequality
Another potential reason for nonuniform gas or blood flow distribution is intrinsic anatomical differences between lung regions. Perhaps the best example is in the dog and horse where, independent of body position in relation to gravity, the dorsal regions of the lower lobes often can be shown to have an unduly high share of total pulmonary perfusion. This tendency, presumably based on the overall branching architectural differences between lobes or within lobes, becomes important in concept when patients are moved from one body position to another, in order to best understand consequent changes in gas exchange.19
Collateral Ventilation and Blood Flow
To this point, a picture has been painted of a branching architecture that has no lateral connections between either adjacent airways or blood vessels at any level of branching. Such lateral connections can exist at several airway levels from large airways down to alveoli.13,20 This is a species-dependent phenomenon, so that while the pig has little or no such collateral pathway structures, the dog has extensive collateral ventilatory channels. Humans are somewhere between these extremes.
Whatever the evolutionary pressure for collateral channel development, the ability to move gas around obstructions in airways by the use of collateral channels appears to be a useful property of human lungs. This is because total airway obstruction in the absence of collateral channels often leads to rapid alveolar gas absorption into the blood from the alveoli distal to the obstructed airway, and this in turn leads to atelectasis and therefore vascular shunts and hypoxemia. Remarkably, chronic human lung diseases typified by airway obstruction – chronic obstructive pulmonary disease (COPD), asthma – produce ![]() inequality due to presence of poorly ventilated areas, but only uncommonly lead to true shunts.21,22 The likely explanation for the paucity of shunts in COPD and asthma is the existence of collateral ventilation.
inequality due to presence of poorly ventilated areas, but only uncommonly lead to true shunts.21,22 The likely explanation for the paucity of shunts in COPD and asthma is the existence of collateral ventilation.
Collateral ventilation in man therefore appears to be a naturally occurring structural phenomenon that can to some extent counteract the gas exchange consequences of diseases.
Collateral perfusion must also occur in the alveolar capillary network. This is deduced simply from the richly interconnecting microvascular network that has the potential to allow blood to flow easily around microvascular obstructions into adjacent vessels. Just how much collateral blood flow potential exists at a larger scale is not clear, being difficult to study. However, well-documented connections occur between the bronchial and pulmonary circulations,23 creating a different kind of collateral circulatory network. The importance of this connection is evident when the pulmonary artery is either absent or embolized. Then, the bronchial circulation expands considerably and can support function of the affected lung regions long term.
Reactive Vasoconstriction and Bronchoconstriction
The distribution of ventilation or blood flow in the lung can be modified by vasoreactive or bronchoreactive functional changes that appear triggered by changes in alveolar gas composition. The most well-documented phenomenon is that of hypoxic pulmonary vasoconstriction.24,25 Here, in response to local alveolar hypoxia produced by locally reduced ventilation, local pulmonary arterial constriction reduces blood flow in the hypoxic region. Whether this system developed to counteract disease or to cope with intrauterine life and the abrupt transition to air-breathing is arguable, although most people favor the latter explanation.
Irrespective of the reasons, the effect of hypoxic vasoconstriction is to help return the local ratio of ventilation to blood flow towards normal. This automatic effect (mediated by O2-sensitive potassium channels in pulmonary arterial smooth muscle cells) is rarely able to fully restore ![]() ratios to normal, but even partial improvements in
ratios to normal, but even partial improvements in ![]() ratio facilitate gas exchange significantly. The negative aspect of hypoxic vasoconstriction is a rise in pulmonary vascular resistance. If this is substantial and protracted over time, pulmonary arterial hypertension can develop, eventually leading to right heart failure. However, factors other than hypoxic vasoconstriction are then also generally present – microvascular destruction and alveolar distortion – and these may be more important to heart failure than hypoxia per se. However, hypoxic vasoconstriction has provided a rationale for enriched O2 therapy in patients with chronic disease to reduce the severity, or to delay the progression, of pulmonary hypertension.
ratio facilitate gas exchange significantly. The negative aspect of hypoxic vasoconstriction is a rise in pulmonary vascular resistance. If this is substantial and protracted over time, pulmonary arterial hypertension can develop, eventually leading to right heart failure. However, factors other than hypoxic vasoconstriction are then also generally present – microvascular destruction and alveolar distortion – and these may be more important to heart failure than hypoxia per se. However, hypoxic vasoconstriction has provided a rationale for enriched O2 therapy in patients with chronic disease to reduce the severity, or to delay the progression, of pulmonary hypertension.
To a much less obvious extent, a counterpart to hypoxic vasoconstriction occurs in the airways: hypocapnic bronchoconstriction.26 Here, especially when pulmonary embolism occurs, the ![]() ratio in the embolized area rises due to loss of blood flow from vascular obstruction. This increase in
ratio in the embolized area rises due to loss of blood flow from vascular obstruction. This increase in ![]() ratio leads to a lower local PCO2 (see below), which causes bronchoconstriction in the local area. This reduces local ventilation and thus tends to normalize the local
ratio leads to a lower local PCO2 (see below), which causes bronchoconstriction in the local area. This reduces local ventilation and thus tends to normalize the local ![]() ratio. Radioactive tracer ventilation scans may show evidence of this as a modest reduction in the ventilation of embolized regions.
ratio. Radioactive tracer ventilation scans may show evidence of this as a modest reduction in the ventilation of embolized regions.
THE  RATIO AND GAS EXCHANGE
To this point, much space has been given to the concepts underlying the distribution of ventilation (![]() ), blood flow (
), blood flow (![]() ), and hence their ratio,
), and hence their ratio, ![]() . The reason for this lies in the importance of
. The reason for this lies in the importance of ![]() ratios to the basic function of the lung—to exchange O2 and CO2 between the blood and the air.
ratios to the basic function of the lung—to exchange O2 and CO2 between the blood and the air. ![]() inequality, no matter what its physiological basis or pathological cause, interferes with gas exchange and causes hypoxemia and sometimes hypercapnia.
inequality, no matter what its physiological basis or pathological cause, interferes with gas exchange and causes hypoxemia and sometimes hypercapnia.
The following section will explain the relationship of ![]() inequality to gas exchange. The subject is complex and must be considered at several “concentric” levels. To start, we will consider how the
inequality to gas exchange. The subject is complex and must be considered at several “concentric” levels. To start, we will consider how the ![]() ratio in a small local lung region controls local PO2, PCO2, and therefore how much O2 and CO2 are exchanged in that region. This isolated approach requires at first some key assumptions. Removing the restrictions of these assumptions is the next “concentric” step in understanding
ratio in a small local lung region controls local PO2, PCO2, and therefore how much O2 and CO2 are exchanged in that region. This isolated approach requires at first some key assumptions. Removing the restrictions of these assumptions is the next “concentric” step in understanding ![]() relationships. A final outer shell of modifying factors that can further affect gas exchange forms a third level of the analysis.
relationships. A final outer shell of modifying factors that can further affect gas exchange forms a third level of the analysis.
 THE
THE  RATIO OF A SMALL HOMOGENEOUS UNIT OF LUNG AND GAS EXCHANGE
How the ![]() ratio determines gas exchange is best explained by considering the flux of O2 from the environment into and out of the alveolus with each breath as well as from the alveolar gas into the capillary blood. Equations that describe these processes and follow the fundamental principle of mass conservation must be used. Original descriptions of these appeared more than 50 years ago.8,27–30 Figure 14-5 provides a model of the lung and specifies the total ventilation (
ratio determines gas exchange is best explained by considering the flux of O2 from the environment into and out of the alveolus with each breath as well as from the alveolar gas into the capillary blood. Equations that describe these processes and follow the fundamental principle of mass conservation must be used. Original descriptions of these appeared more than 50 years ago.8,27–30 Figure 14-5 provides a model of the lung and specifies the total ventilation (![]() ) and blood flow (
) and blood flow (![]() ) of this model together with the key locations of the relevant O2 levels. It can be used to consider a small homogeneous unit of lung.
) of this model together with the key locations of the relevant O2 levels. It can be used to consider a small homogeneous unit of lung.
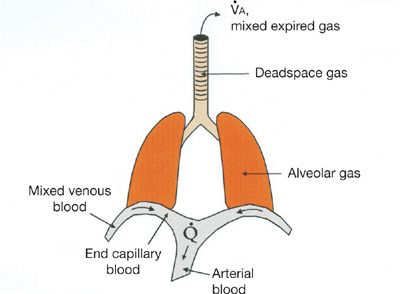
Figure 14-5 Conceptual model of the lungs indicating main sites in which oxygen and carbon dioxide partial pressures are different, together with the principal convective processes accomplishing gas exchange, ventilation (![]() ), and blood flow (
), and blood flow (![]() ).
).
Convention has long considered ventilation over a period of time as a constant in spite of the tidal nature of breathing. This is in fact a very reasonable approximation that has stood the test of time. Similarly, blood flow is considered constant, and this too has proved reasonable. If ![]() and
and ![]() are therefore considered as alveolar minute ventilation and blood flow of a small homogeneous unit respectively, the following simple mass conservation equations can be written for O2:
are therefore considered as alveolar minute ventilation and blood flow of a small homogeneous unit respectively, the following simple mass conservation equations can be written for O2:
![]()
and
![]()
In these equations, ![]() is amount of O2 transferred from the environment into the blood per unit time and, given the assumption of steady state conditions, this, when summed over all such units in the lungs, equals metabolic rate.
is amount of O2 transferred from the environment into the blood per unit time and, given the assumption of steady state conditions, this, when summed over all such units in the lungs, equals metabolic rate. ![]() and
and ![]() are, respectively, the inspired and expired volumes of gas respired per minute, less than the amount remaining in the conducting airways. As anticipated,
are, respectively, the inspired and expired volumes of gas respired per minute, less than the amount remaining in the conducting airways. As anticipated, ![]() and
and ![]() are close to being identical, otherwise the lungs would blow up or collapse in a short period of time. However,
are close to being identical, otherwise the lungs would blow up or collapse in a short period of time. However, ![]() does not generally equal
does not generally equal ![]() because slightly more O2 is consumed per minute than is CO2 produced (i.e., the respiratory quotient is in general not 1.0). Thus,
because slightly more O2 is consumed per minute than is CO2 produced (i.e., the respiratory quotient is in general not 1.0). Thus, ![]() . Mostly, the inequality of
. Mostly, the inequality of ![]() and
and ![]() can be ignored because the difference is only about 1%—if
can be ignored because the difference is only about 1%—if ![]() is 6 L/min and
is 6 L/min and ![]() is 300 mL/min with
is 300 mL/min with ![]() at 240 mL/min,
at 240 mL/min, ![]() = 5.94 L/min. Although this small difference is not ignored in research applications, it can be for the present purposes, so that
= 5.94 L/min. Although this small difference is not ignored in research applications, it can be for the present purposes, so that ![]() is replaced by
is replaced by ![]() in Equation (1), simplifying the analysis. In Equation (1), FIO2 and FAO2 are the fractional concentrations (F) of O2 in inspired (I) and exhaled alveolar (A) gas, respectively, from a small unit in Figure 14-5. In Equation (2), Cc′O2 and C
in Equation (1), simplifying the analysis. In Equation (1), FIO2 and FAO2 are the fractional concentrations (F) of O2 in inspired (I) and exhaled alveolar (A) gas, respectively, from a small unit in Figure 14-5. In Equation (2), Cc′O2 and C![]() O2 are the O2 concentrations (C) in the oxygenated end capillary blood leaving (c′) and the deoxygenated blood entering (
O2 are the O2 concentrations (C) in the oxygenated end capillary blood leaving (c′) and the deoxygenated blood entering (![]() ) the vasculature respectively. The abbreviation c′ stands for end capillary blood;
) the vasculature respectively. The abbreviation c′ stands for end capillary blood; ![]() for mixed venous (pulmonary arterial) blood.
for mixed venous (pulmonary arterial) blood.
Since Equations (1) and (2) both describe the same O2 flux rate (![]() ) they may be set equal to each other:
) they may be set equal to each other:
![]()
and rearranged so that:
![]()
It should further be noted that because diffusion equilibration of O2 transfer across the alveolar–capillary membrane is assumed to be complete, alveolar PO2 and end capillary PO2 are identical. Hence, the relationship between FAo2 and Cc′O2 is uniquely dictated by the O2-Hb dissociation curve such that knowing FAO2 allows us to determine directly Cc′O2 (or vice versa).
Equation (5) is very revealing and explains directly the role of the ![]() ratio in governing alveolar gas exchange. This equation states that for a given set of what may be called boundary conditions (i.e., composition of inspired gas and mixed venous blood, represented here by FIO2 and C
ratio in governing alveolar gas exchange. This equation states that for a given set of what may be called boundary conditions (i.e., composition of inspired gas and mixed venous blood, represented here by FIO2 and C![]() O2, respectively) and for a known O2–Hb dissociation curve, alveolar (and thus end capillary) PO2 is uniquely determined by the ratio of alveolar ventilation (
O2, respectively) and for a known O2–Hb dissociation curve, alveolar (and thus end capillary) PO2 is uniquely determined by the ratio of alveolar ventilation (![]() ) to blood flow (
) to blood flow (![]() ).
).
Under the given assumptions, summarized as (1) continuous and constant ventilation and blood flow; (2) steady state conditions; (3) diffusion equilibration of alveolar–capillary exchange; and (4) equality of inspired and expired ventilation, equations identical in construct to Equation (5) can be written for any gas being exchanged by the lung.
For CO2, this produces Equation (6):
![]()
The order of bracketed terms on the right is reversed to maintain positive numbers, since CO2 is being eliminated from the blood. Of course, FICO2 is essentially zero and thus drops out of the equation.
Unfortunately, neither Equation (5) nor (6) is amenable to simple quantitative solutions, because of the complexity of the O2 and CO2 dissociation curves. The equations are however readily explored by appropriate computerized numerical analyses.31–35 Using such programs, one can explore the relationship between ![]() ratio and alveolar PO2 and PCO2, and this is done in Figure 14-6. These relationships are important because they indicate what degrees of
ratio and alveolar PO2 and PCO2, and this is done in Figure 14-6. These relationships are important because they indicate what degrees of ![]() abnormality are required to affect gas exchange for both O2 and CO2. The four panels of Figure 14-6 show alveolar PO2 and PCO2 as well as end capillary O2 and CO2 concentrations. The latter better reflect total gas exchange as a function of
abnormality are required to affect gas exchange for both O2 and CO2. The four panels of Figure 14-6 show alveolar PO2 and PCO2 as well as end capillary O2 and CO2 concentrations. The latter better reflect total gas exchange as a function of ![]() ratio. Specific conditions for Figure 14-6 are that mixed venous blood PO2 is 40 mm Hg and PCO2 45 mm Hg, normal resting values. Also, inspired gas is room air, and [Hb] is 15 g/dL. In each panel, the three solid circles are positioned at the normal
ratio. Specific conditions for Figure 14-6 are that mixed venous blood PO2 is 40 mm Hg and PCO2 45 mm Hg, normal resting values. Also, inspired gas is room air, and [Hb] is 15 g/dL. In each panel, the three solid circles are positioned at the normal ![]() ratio (of about 1.0) and at
ratio (of about 1.0) and at ![]() ratios 10 times greater and less. All four relationships are highly non-linear. Focusing on the two lower panels, it is evident for O2 that a 10-fold reduction in
ratios 10 times greater and less. All four relationships are highly non-linear. Focusing on the two lower panels, it is evident for O2 that a 10-fold reduction in ![]() greatly reduces local O2 transport, whereas a 10-fold increase barely improves it. Furthermore, as
greatly reduces local O2 transport, whereas a 10-fold increase barely improves it. Furthermore, as ![]() falls even lower than 0.1, there is little further loss in O2 transport. There is however little protection against a fall in
falls even lower than 0.1, there is little further loss in O2 transport. There is however little protection against a fall in ![]() below 1.0, because the curve is very steep below a
below 1.0, because the curve is very steep below a ![]() of 1.0, as the lower left panel shows. For CO2, the curves are opposite in slope (PCO2 falls as
of 1.0, as the lower left panel shows. For CO2, the curves are opposite in slope (PCO2 falls as ![]() increases). However, unlike the case for O2, there is little difference between a
increases). However, unlike the case for O2, there is little difference between a ![]() of 1.0 and a 10-fold reduction, whereas an increase in
of 1.0 and a 10-fold reduction, whereas an increase in ![]() considerably reduces alveolar PCO2 and end capillary CO2 concentration. The reason for the differences between O2 and CO2 lies mainly in the slopes of their dissociation curves: that for CO2 is about 10-fold greater than that for O2. It has been shown that the higher the slope of the dissociation curve (or equivalently for an anesthetic gas, its solubility) the more it is sensitive to areas of high
considerably reduces alveolar PCO2 and end capillary CO2 concentration. The reason for the differences between O2 and CO2 lies mainly in the slopes of their dissociation curves: that for CO2 is about 10-fold greater than that for O2. It has been shown that the higher the slope of the dissociation curve (or equivalently for an anesthetic gas, its solubility) the more it is sensitive to areas of high ![]() . The lower the slope or solubility, the more the gas is affected by areas of low
. The lower the slope or solubility, the more the gas is affected by areas of low ![]() . Consequently, areas of low
. Consequently, areas of low ![]() predictably cause more reduction in arterial PO2 than increase in arterial PCO2. Although Figure 14-6 is true strictly only for the stated “boundary” conditions (i.e., mixed venous blood and inspired gas composition), the principles hold even for different such conditions, as shown in Figure 14-7 for O2. The left panels illustrate how changes in mixed venous PO2 alone will affect alveolar PO2 and end capillary [O2] via Equation (4). The right panels correspondingly show how change in inspired PO2 affects O2. Venous PO2 is selected at 30, 40, and 50 mm Hg, and inspired PO2 is chosen to be 120, 150, and 180 mm Hg. Changes in venous PO2 dramatically affect PO2 and [O2] in unventilated and poorly ventilated regions as well as regions approaching normal, but have no real effect on high
predictably cause more reduction in arterial PO2 than increase in arterial PCO2. Although Figure 14-6 is true strictly only for the stated “boundary” conditions (i.e., mixed venous blood and inspired gas composition), the principles hold even for different such conditions, as shown in Figure 14-7 for O2. The left panels illustrate how changes in mixed venous PO2 alone will affect alveolar PO2 and end capillary [O2] via Equation (4). The right panels correspondingly show how change in inspired PO2 affects O2. Venous PO2 is selected at 30, 40, and 50 mm Hg, and inspired PO2 is chosen to be 120, 150, and 180 mm Hg. Changes in venous PO2 dramatically affect PO2 and [O2] in unventilated and poorly ventilated regions as well as regions approaching normal, but have no real effect on high ![]() alveoli. Altering inspired PO2 (but not venous) has the converse effect if PO2 is examined (top right panel), but, due to the nonlinear shape of the O2–Hb dissociation curve, effects on [O2] are minimal in high
alveoli. Altering inspired PO2 (but not venous) has the converse effect if PO2 is examined (top right panel), but, due to the nonlinear shape of the O2–Hb dissociation curve, effects on [O2] are minimal in high ![]() areas, small in very low
areas, small in very low ![]() areas, and more significant between
areas, and more significant between ![]() ratios of 0.1 and 1.0 (bottom right panel). This figure shows how the inspired and mixed venous “boundary conditions” alter the magnitude (but not basic patterns) of alveolar gas exchange.
ratios of 0.1 and 1.0 (bottom right panel). This figure shows how the inspired and mixed venous “boundary conditions” alter the magnitude (but not basic patterns) of alveolar gas exchange.
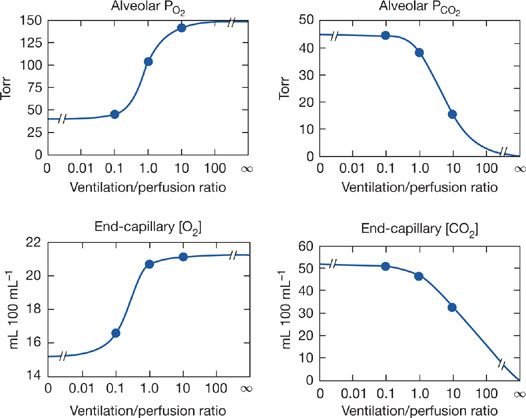
Figure 14-6 Calculated relationships between alveolar PO2 and PCO2 and the ventilation–perfusion ratio (top panels) and their corresponding end-capillary blood concentrations (lower panels). The three solid circles in each case represent values for ventilation–perfusion ratios of 0.1, 1.0, and 10. (See text for further details.)
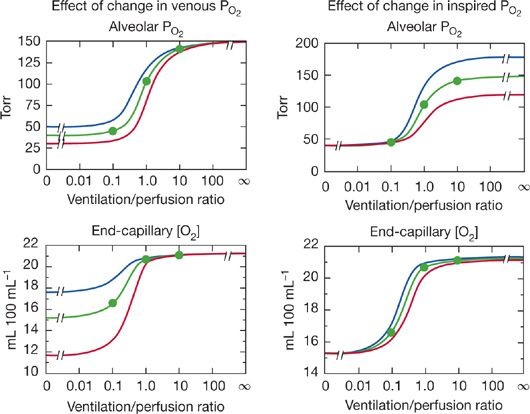
Figure 14-7 Effects of changes in mixed venous PO2 (left panels) or inspired PO2 (right panels) on alveolar PO2 and associated end-capillary oxygen concentrations. Note that changes in venous PO2 mostly affect values associated with low ventilation–perfusion ratios, whereas changes in inspired PO2 affect units throughout the ![]() range, especially those with medium to high
range, especially those with medium to high ![]() ratios.
ratios.
If one returns to the normal boundary conditions (P![]() O2 = 40 mm Hg, PIO2 = 150 mm Hg), one can explore the consequences of
O2 = 40 mm Hg, PIO2 = 150 mm Hg), one can explore the consequences of ![]() inequality on gas exchange. In reality, the complex structure of the lungs defies a simple analysis but conceptually even a two-compartment model is an invaluable aid to understanding this conceptually difficult area.
inequality on gas exchange. In reality, the complex structure of the lungs defies a simple analysis but conceptually even a two-compartment model is an invaluable aid to understanding this conceptually difficult area.
Figure 14-8 shows such a simple two-compartment model in three configurations: (1) each compartment equally ventilated and perfused such that there is no ![]() inequality; (2) the left compartment hypoventilated due to airway obstruction, causing
inequality; (2) the left compartment hypoventilated due to airway obstruction, causing ![]() inequality; and (3) the left compartment hypoperfused from vascular obstruction. Table 14-1 shows the corresponding O2 and CO2 calculations for each compartment. Specific assumptions common to all three models are (1) the mixed venous PO2 remains at 40 mm Hg; inspired PO2 is constant at 150 mm Hg; total alveolar ventilation summed over both compartments is constant as is total blood flow, both taken to be 6 L/min; [Hb] is constant at 15 g/dL. Further, airways obstruction reduces L-hand compartmental ventilation from 3.0 to 0.3 L/min, redistributing the balance to the R-hand compartment. Vascular obstruction is of the same order as the right panel of the figure shows. Note that for both obstructive models, one compartment has developed a
inequality; and (3) the left compartment hypoperfused from vascular obstruction. Table 14-1 shows the corresponding O2 and CO2 calculations for each compartment. Specific assumptions common to all three models are (1) the mixed venous PO2 remains at 40 mm Hg; inspired PO2 is constant at 150 mm Hg; total alveolar ventilation summed over both compartments is constant as is total blood flow, both taken to be 6 L/min; [Hb] is constant at 15 g/dL. Further, airways obstruction reduces L-hand compartmental ventilation from 3.0 to 0.3 L/min, redistributing the balance to the R-hand compartment. Vascular obstruction is of the same order as the right panel of the figure shows. Note that for both obstructive models, one compartment has developed a ![]() ratio less than average and the other a
ratio less than average and the other a ![]() ratio greater than average, irrespective of the location of the obstruction.
ratio greater than average, irrespective of the location of the obstruction.
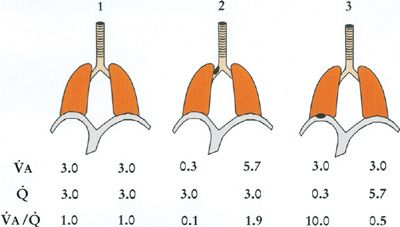
Figure 14-8 Three two-compartment models of ventilation–perfusion relationships. Model 1 represents an ideal lung without ventilation–perfusion mismatch. Model 2 represents a lung in which one compartment has a 90% reduction in its alveolar ventilation due to airway obstruction, and Model 3 is a lung in which one compartment has a 90% reduction in capillary blood flow due to vascular obstruction. Ventilation, blood flow, and ventilation–perfusion ratio of each compartment are indicated. Total ventilation and total blood flow remain the same among the three models. (See text for further details.)
Stay updated, free articles. Join our Telegram channel

Full access? Get Clinical Tree


