Diagnostic Procedures |
INTRODUCTION
This chapter is not intended to provide a comprehensive review of the entire scope of thoracic imaging; dedicated textbooks in radiology serve this purpose well. Moreover, the chapter does not provide a comprehensive guide to the interpretation of thoracic imaging studies. Rather, the focus is on what modern thoracic imaging can provide to empower clinicians to diagnose and manage common clinical scenarios in the second decade of the 21st century. The goal is to present a strategic approach to thoracic imaging, which starts with broad clinical categories of disease and addresses the following central clinical questions: What is the differential diagnosis and how can a specific diagnosis be confirmed? What is the prognosis and how can disease progression and therapeutic effectiveness best be monitored?
In each subsection, organized initially by imaging technique, and subsequently, by broad diagnostic categories, the authors aim to answer these questions by providing a practical, logical, and evidence-based approach that emphasizes which imaging tests to order and what to expect from each test. Oftentimes, imaging findings are either pathognomonic or highly characteristic of a diagnosis in the appropriate clinical context and, therefore, will suffice for clinical diagnosis and management. However, when this is not the case, tissue sampling or additional laboratory tests may be required for diagnostic confirmation; these scenarios are outlined and options discussed for tissue sampling, including image-guided percutaneous biopsy, bronchoscopy, and surgical biopsy. In addition, the ways in which modern functional and quantitative radiographic techniques may impact the field of thoracic imaging in the near future will be considered, and validated clinical applications differentiated from promising research applications that may evolve into useful clinical tools in the next several decades.
Finally, since radiology and, in particular, thoracic imaging, play such a major and central role in modern medicine, our ultimate goal is to enable the practicing pulmonologist to use imaging resources consistently, wisely, efficiently, and effectively.
SUMMARY OF TECHNIQUES: DIAGNOSTIC AND INTERVENTIONAL
The inception of the field of radiology dates back to 1895 with Wilhelm Röentgen’s serendipitous discovery of x-rays and subsequent production of the first radiograph. Within only a few years, radiology became established as a new medical field. Chest radiography, although one of the first clinical applications and currently over 100 years old, is still the most frequently performed imaging test worldwide and the cornerstone of initial imaging assessment of most patients with thoracic diseases. Nonetheless, over the last four decades we have witnessed an explosion of technical innovation and developments, with the introduction of ultrasound (US), computed tomography (CT), magnetic resonance imaging (MR), positron emission tomography (PET), and hybrid scanners (PET/CT and PET/MR), which have greatly expanded the ability of modern imaging to accurately diagnose even the smallest or earliest disease processes and revolutionized the practice of medicine.
More recently, the widespread impact that computers have made on the acquisition, distribution, visualization, and postacquisition processing of medical images have consolidated the central role of radiology. In the future, we hypothesize that major trends will include quantitative imaging, functional imaging, molecular diagnosis, and value assessment with regard to generating better patient outcomes. In the following sections we present current clinical applications, advantages, and disadvantages of each modality, as well as appropriateness criteria for ordering each test, according to the clinical scenario.
CHEST RADIOGRAPHY
Two basic types of chest radiographic examinations are available—bedside portable AP (anteroposterior) and the combination of PA (posteroanterior) and lateral projections. Supplementary views include oblique, lordotic, lateral decubitus, and expiratory radiographs. For most clinical scenarios, the evaluation should begin with a chest radiograph, as this study remains the most cost-effective imaging test for diagnosing a variety of common clinical conditions. Moreover, chest radiographs are universally available and can be obtained even in patients who cannot be moved to an advanced scanner (e.g., patients in the ICU setting). Nonetheless, in many clinical scenarios, additional advanced imaging will be required to clarify radiographic findings or obtain more accurate characterization of disease pattern and severity (Figs. 30-1–30-4).
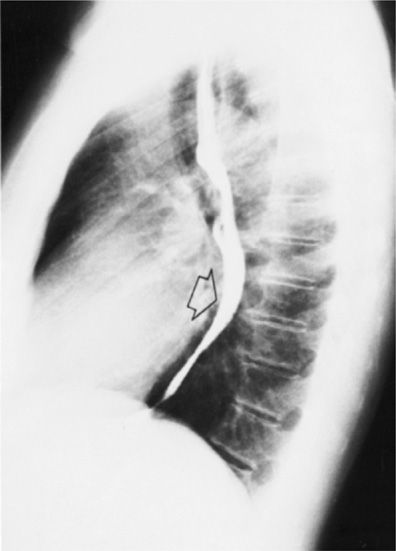
Figure 30-1 Lateral chest radiograph following barium contrast swallow. Not only is this technique very useful for evaluating the esophagus, it is also able to demonstrate left atrial enlargement, with consequent posterior displacement of the contrast column (arrow).
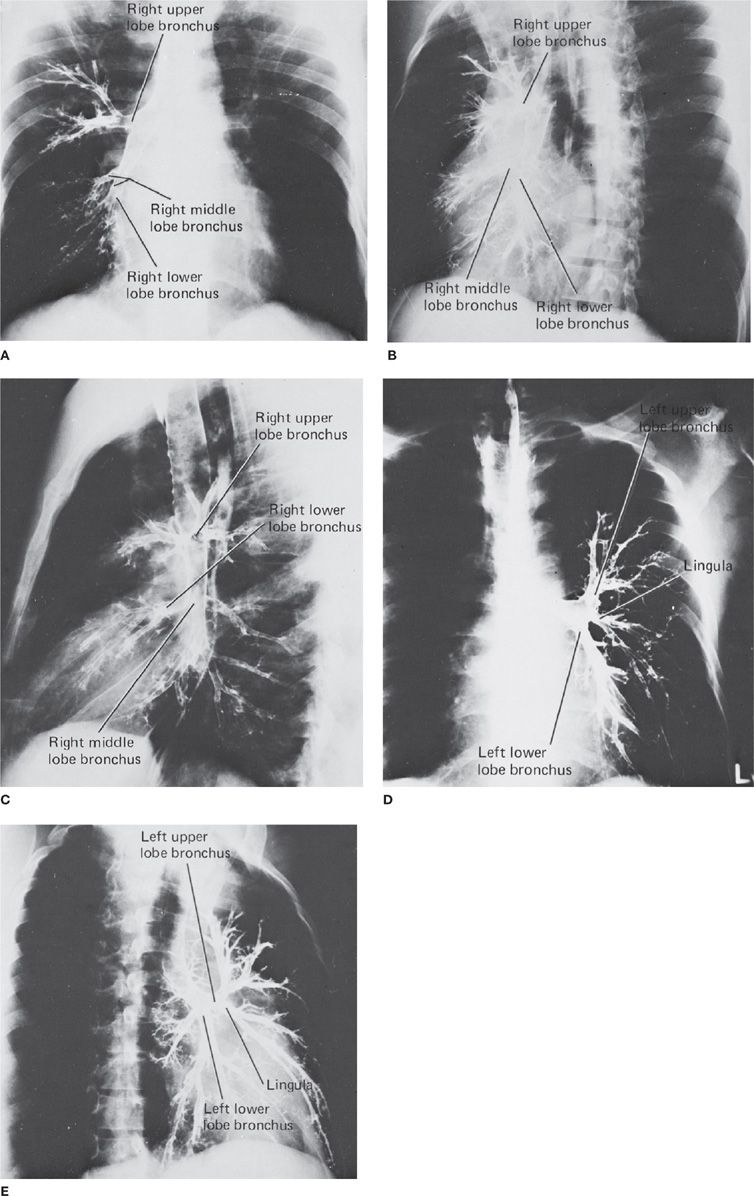
Figure 30-2 Normal bronchogram. The normal bronchial anatomy of the right lung is shown in the PA (A), oblique (B), and lateral (C) projections. The corresponding anatomy of the left lung is demonstrated in the PA (D) and oblique (E) projections; the latter also illustrates bronchiectasis. Although valuable to demonstrate bronchial anatomy and pathology, the bronchogram is an obsolete examination, having been replaced by CT and airway reconstruction techniques.
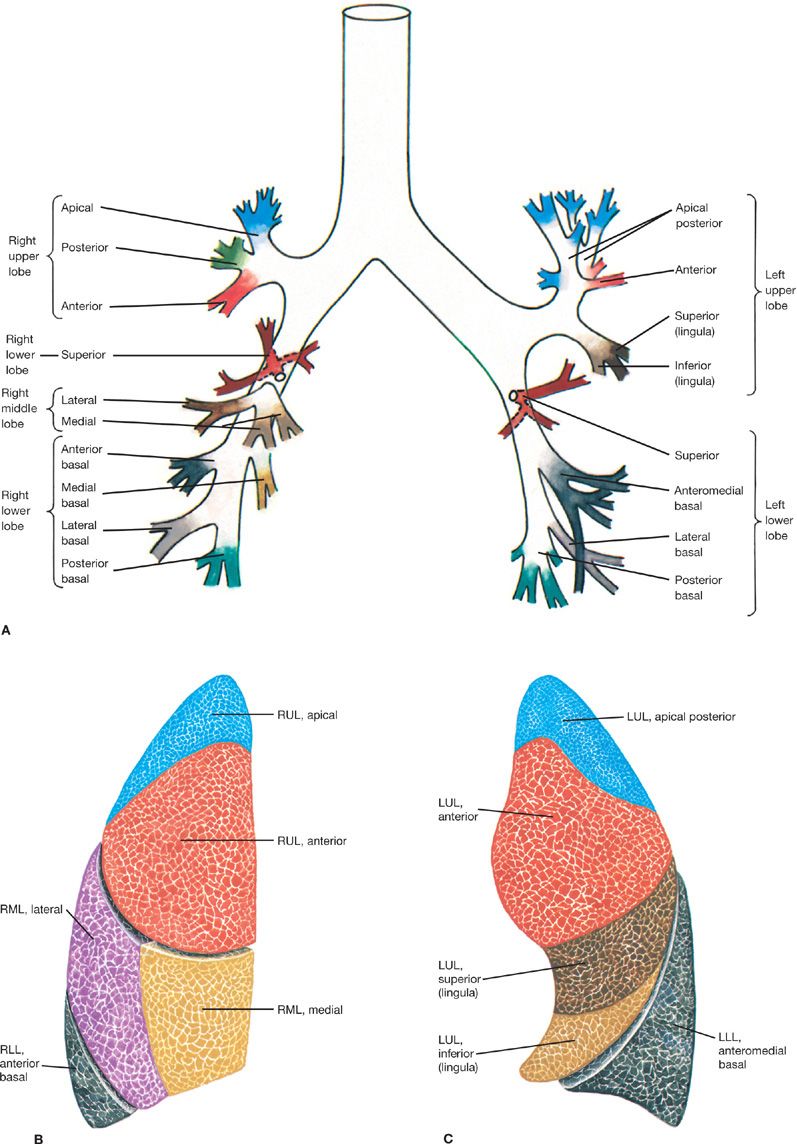
Figure 30-3 Topographic anatomy of the tracheobronchial tree and respective pulmonary subsegments. A. Tracheobronchial tree. B. Right lung segments. C. Left lung segments. Currently, CT is the best modality for accurate anatomical delineation of pulmonary airway segmentation. RUL, right upper lobe; RML, right middle lobe; RLL, right lower lobe; LUL, left upper lobe; LLL, left lower lobe.
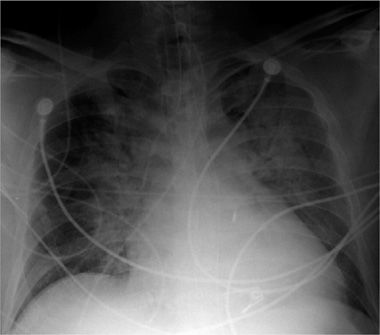
Figure 30-4 Portable AP (anteroposterior) projection chest radiograph, in a patient in the ICU, demonstrating multiple support tubes and lines and the typical configuration of cardiogenic pulmonary edema, with symmetrical bilateral consolidations with perihilar predominance.
Whereas the basic physical principles of radiography have not changed in over a century, the quality and clinical availability of chest radiographs have been greatly enhanced in recent decades due to the transition from analog to digital technology. Digital imaging provides better image contrast, reduces the number of suboptimal or nondiagnostic examinations, and permits more immediate examination availability using image transfer and display software.
Currently, two standards for digital radiography exist: computed radiography (CR) and digital radiography (DR), which differ in the process of imaging acquisition. CR utilizes a photostimulable phosphor cassette, just as does the film-screen analog technique; however, the latent image is read by a laser and converted from an analog to digital signal, rather than being transferred to film. DR bypasses this step and utilizes flat panel detectors that directly transform the x-ray signal to a digital image via integrated, thin-film, transistor readout systems. From a practical perspective, DR images are often sharper, with better spatial resolution and, consequently, better visualization of detail. In addition, DR streamlines workflow for routine images and offers the possibility of tailoring the radiation dose.
Most modern facilities use a combination of CR and DR units, due to cost considerations. The principal benefit of CR and DR technology is the ability to process the acquired images to emphasize specific anatomical areas (e.g., lung parenchyma, soft tissues, bones), thereby greatly reducing the need to repeat examinations due to over- or underpenetration by the x-ray beam.1 Digital methods to “remove” the ribs from the image are now available using either postprocessing bone-suppression software or dual-energy acquisition techniques. These approaches can provide an unobstructed view of the lungs for improved detection of nodules and other pulmonary findings. In addition, computer-aided diagnostic techniques may now assist the radiologist in the detection of subtle lung lesions.
The PA view obtained in the erect position is the standard radiographic examination and demonstrates the anatomy and most thoracic pathologic processes. In particular, the PA view allows evaluation of pulmonary masses and consolidation, diffuse lung disease, pleural effusion, pneumothorax, mediastinal abnormalities, and disorders of the rib cage and scapular girdle.
The lateral view provides additional information by better depicting the posterior diaphragms and posterior lung bases, retrocardiac left lung base, anterior mediastinum, and thoracic spine.
The AP view provides similar information to the PA view, but it is limited by lower spatial and contrast resolution and by magnification of the mediastinal structures. In addition, it is less sensitive for detection of small pneumothoraces and pleural effusions. The AP view is often performed in the supine position in bedridden patients, particularly those who are postoperative or in the ICU. AP portable chest radiographs can be very helpful in assessing the position of support lines, tubes, and medical devices. Medical devices can also be enhanced using newer digital image-processing algorithms.
Supplementary views are not routinely performed, unless there is a specific clinical question. In the past, lordotic views were obtained to better visualize the lung apices by displacing the clavicle and first rib shadows superiorly. However, their role has been largely replaced by CT. Expiratory views may be more sensitive in detecting small pneumothoraces, particularly in the setting of recent lung interventional procedures. Lateral decubitus views, although used less frequently than in the past, may be helpful in determining if a pleural opacity seen on standard views is a freely mobile effusion or a loculated effusion or pleural mass. When the patient is imaged with the pleural opacity on the dependent side, a freely mobile pleural effusion conforms to the most dependent region of the hemithorax and a sharp horizontal level demonstrated due to gravity. If a nondependent lucency is seen in the chest or abdomen, in conjunction with a sharp horizontal level delineating it from normal anatomical structures, the diagnosis of a small pneumothorax or pneumoperitoneum may be made. Finally, oblique views are helpful in determining if a questionable radiographic abnormality seen on the frontal view is real or artifactual, as well as in determining its location in the thorax. Performed properly, supplementary views can increase the diagnostic accuracy and clinical utility of chest radiography, sometimes obviating the need for chest CT with its attendant higher cost and radiation exposure.
Many radiographic techniques that were widely used in the past (e.g., laminography, bronchography, air contrast studies, and fluoroscopy) have been made obsolete by other techniques and are of historical interest only. The exception is focused fluoroscopy for evaluation of diaphragmatic motion (“sniff test”), in which the patient is imaged during quiet breathing, deep breathing, and forceful inspiration (“sniff”). A paralyzed hemidiaphragm moves paradoxically upward with forceful inspiration. Fluoroscopy in conjunction with barium swallow may also be used to assess esophageal diseases.
CHEST CT
CT is the current cornerstone of advanced thoracic imaging. It is a digital cross-sectional imaging technique that utilizes a rotating x-ray source around the patient, coupled to diametrically positioned sodium iodide detectors in a circular configuration. As the scanner gantry rotates, multiple projections are generated at different angles with different x-ray beam attenuations, depending on which part of the patient’s anatomy was traversed. Following scan acquisition, through a mathematical procedure (filtered back projection or, more recently, iterative reconstruction), the sum of projections is transformed into an image in which the relative density of each small volume of the patient’s anatomy (voxel) is proportional to its x-ray absorption coefficient, and normalized from a scale of –1000 to > +1000 HU (Hounsfield units, zero representing the absorption coefficient of water, –1000 of air). Because it eliminates the main drawback of radiographic techniques, that is, the projection of a three-dimensional (3D) structure into a two-dimensional image, CT allows very accurate localization of pathologic processes. Moreover, the superior contrast resolution of CT allows detailed evaluation of mediastinal and chest wall soft tissue attenuation structures, which are poorly assessed radiographically. CT is also superior to chest radiographs for detection of small pulmonary lesions, as well as for their characterization (Figs. 30-5 and 30-6).
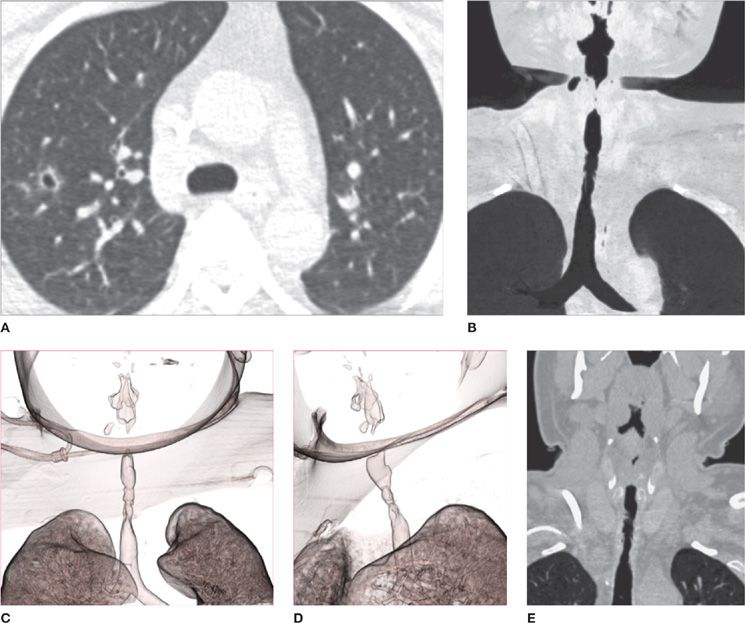
Figure 30-5 CT offers the best imaging evaluation of the pulmonary parenchyma and airways, and advanced postprocessing techniques can provide exquisite views of disease distribution and extension. Granulomatosis with polyangiitis (formerly known as Wegener granulomatosis) affecting the lung and airways. A. Cavitary nodule in the right upper lobe; (B) minimum intensity projection image demonstrating irregular, long segment narrowing of the upper and middle trachea; (C) and (D) two different projections of a 3D volume rendering airway reconstruction demonstrating the complex configuration of the stenotic tracheal segment; (E) coronal reformatted image depicting tracheal wall thickening associated with stenosis.
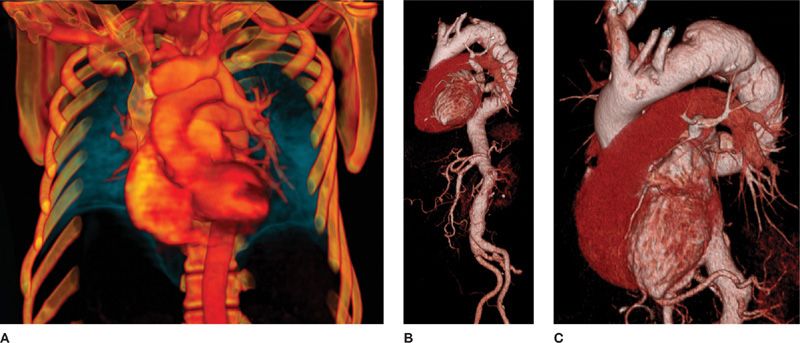
Figure 30-6 CT allows acquisition of isotropic volumetric images, in which advanced 3D postprocessing can be performed to demonstrate complex disease processes with a high level of detail. A. VR (volume rendering) reconstruction demonstrating partial anomalous pulmonary venous connection of the left upper lobe to the left brachiocephalic vein; (B) and (C) VR reconstructions at different degrees of rotation, demonstrating the complex configuration of a thoracic aortic aneurysm. These images are invaluable for treatment planning.
Early CT scanners had a single row of detectors and a single x-ray source, acquiring one axial image at a time before the scanner table was moved to acquire the next image. This process could take more than 30 minutes for a single thoracic CT examination. Most modern scanners have between 64 and 320 rows of detectors, one or two x-ray tubes, extremely fast and continuous gantry rotation, and simultaneous table translation, resulting in helical image acquisition and the ability to scan the entire chest in less than 1 second. Modern CT scanners are able to produce high-quality, submillimeter, isotropic resolution images that can be reconstructed in any arbitrary plane without loss of detail. Postprocessing techniques utilizing computational algorithms also allow 3D reconstructions, such as volume rendering and maximal intensity projection images, which can be utilized to demonstrate complex 3D vascular or airway anatomy and pathology.
An important concept is that of high-resolution CT (“HRCT”) of the thorax. Historically, when early CT scanners were limited to the acquisition of relatively thick axial slices (7 to 10 mm) in the thorax, the only way to adequately assess lung parenchymal detail was to acquire serial thin (1 mm) anatomic images utilizing an axial, rather than helical mode; this required noncontiguous (i.e., slices with an interslice gap, typically 20 mm wide), rather than contiguous, slices. These images were also reconstructed using a high spatial frequency algorithm, sharpening edges and allowing improved visualization of fine detail. The result was a set of higher spatial resolution, thin-section images that sampled the lung parenchyma and provided excellent insight into certain pulmonary disorders. This was termed “high-resolution CT” or “HRCT” of the chest, differentiating it from the “standard” chest CT scan, in which thicker sections were acquired through the entire chest in a contiguous helical mode (i.e., without interslice gaps). Generally, a choice had to be made as to which of these two types of scans to perform, since both studies could not be performed simultaneously. Standard CTs were ordered for a general assessment of larger pulmonary lesions, as well as mediastinal, bone, and chest wall pathology. High-resolution chest CTs were ordered to assess pulmonary parenchymal disease, such as bronchiectasis, interstitial diseases, and micronodular diseases.
With advances in CT technology, however, it is currently feasible to acquire volumetric, isotropic thin-section (1 mm) images throughout the entire thorax in a single breath-hold, and to reconstruct them in any arbitrary plane (typically axial, sagittal, and coronal) using soft tissue and high-resolution algorithms. Consequently, every chest CT is now effectively both a standard, as well as a high-resolution CT, combining the advantages of each in a single study. This simplifies the ordering process for clinicians. Currently, when ordering a chest CT, there are only two decisions that the clinician needs to make: (1) whether to include expiratory imaging; and (2) whether to perform the study with or without intravenous contrast (these are discussed in detail below).
The first important decision is whether to perform expiratory images, noting that normally, a chest CT is acquired in full inspiration. The reason to avoid performing expiratory images for every patient is to decrease medically unnecessary radiation exposure. Typically, an expiratory CT is ordered if there is a clinical concern for an obstructive lung disease (e.g., asthma, COPD, or small airway disease) or if there is a risk of developing bronchiolitis obliterans (e.g., related to lung or bone marrow transplantation) (Video 30-1A,B). Expiratory CT may also be ordered to assess for large airway diseases, such as tracheobronchomalacia. Expiratory CT is currently the best imaging test to demonstrate small airway air trapping and, therefore, it is a very useful tool to evaluate potential causes of a “mosaic attenuation pattern” on CT (as discussed in detail in the following sections addressing specific diseases).

Video 30-1 A. Axial cine images using lung window and inspiratory acquisition. This CT airway examination demonstrates bronchiectasis, mosaic attenuation, and faint peribronchial opacities, compatible with a diagnosis of bronchiolitis obliterans. Inspiratory acquisitions should ideally reflect the lung appearance at TLC (total lung capacity). B. Same patient as in Video 30.1A. Axial cine images on lung window/level, expiratory acquisition, in this CT airway examination, demonstrating same findings earlier, plus dynamic partial collapse of the trachea and central bronchi, compatible with tracheobronchomalacia superimposed on bronchiolitis obliterans. Note the value of expiratory imaging to establish the diagnosis of tracheobronchomalacia and to increase the conspicuity of the mosaic attenuation pattern reflecting small airway disease. Expiratory acquisitions should ideally reflect residual volume (RV). Access at www.fishmansonline.com
The second important decision is whether to perform the study with or without intravenous contrast administration. For the sake of decreasing medically unnecessary radiation exposure, there are very few indications for combined chest CT (i.e., with and without intravenous contrast); these are discussed below. The vast majority of chest CT is performed either with or without intravenous contrast. Generally, to assess the lung parenchyma and airways, no intravenous contrast is required. Assessment of bone lesions also usually does not benefit from intravenous contrast administration. On the other hand, vascular and cardiac assessment is greatly enhanced by intravenous contrast. Moreover, mediastinal and hilar pathology (including lymphadenopathy) and cervical and chest wall masses are more conspicuous and better evaluated using intravenous contrast. For certain thoracic neoplasms, the enhancement pattern adds information to their diagnostic characterization. Finally, assessment of pleural diseases also is enhanced using intravenous contrast administration.
It is important to emphasize that since iodinated CT intravenous contrast is excreted primarily by the kidneys, substantially impaired renal function may preclude intravenous contrast administration and may increase the risk of nephrotoxicity. Additional risks associated with intravenous contrast administration include local effects related to contrast extravasation at the injection site and anaphylactoid reactions, ranging from clinically insignificant symptoms to life-threatening airway or cardiovascular collapse; the latter is very rare with the low osmolar contrast material currently utilized.
When performing chest CT with intravenous contrast, it is important to inform the radiologist of the clinical indication. Broadly, three different basic protocols can be utilized: (1) standard contrast-enhanced CT; (2) CT angiography (CTA) for visualization of the aorta or coronary arteries; and (3) CTA for visualization of the pulmonary arteries (“pulmonary embolism [PE] protocol”).
For a standard contrast-enhanced CT, the injection rate and imaging acquisition relative to the contrast injection are tailored for maximum enhancement of parenchymal organs and soft tissues; consequently the images are acquired during the venous or equilibrium phase of contrast distribution. This is the standard approach for routine, contrast-enhanced chest CT.
CTA of the aorta and CTA of the coronary arteries are dedicated examinations that are tailored for maximum enhancement of these systemic vessels and are not covered further in this chapter. In particular, cardiac CTA is a thriving application that is usually performed in conjunction with ECG gating to compensate for cardiac motion. CTA of the pulmonary arteries is a well-established application and the current reference standard for the diagnosis of PE (Video 30-2A,B). With this CT technique, contrast injection and imaging acquisition are optimized for maximum enhancement of the pulmonary arteries. This requires a high rate of injection (4–6 mL/s, as opposed to 2 mL/s for regular contrast-enhanced CT) through a large-caliber peripheral IV access (ideally larger than 20G) and very fast volumetric imaging acquisition, usually using contrast bolus tracking to maximize the probability of scanning the patient at the peak of opacification of the pulmonary arteries. When optimally performed, this study allows confident diagnosis of PE in even small subsegmental vessels via direct visualization of vascular filling defects. It also allows accurate assessment of pulmonary vascular caliber and distribution to diagnose pulmonary hypertension, chronic thromboembolic disease, and vasculitides.

Video 30-2 A. Axial cine images using soft tissue window, demonstrating a massive saddle embolus straddling the bifurcation of the main pulmonary artery. Note that the clot extends to the bilateral lower lobes; oligemia of the right lower lobe is demonstrated. Also note right ventricular enlargement and leftward deviation of the interventricular septum, findings compatible with right ventricular strain. B. Same patient as in Video 30.2A. Full-color, coronal, 3D VR (volume rendering) thick slab cine (anterior to posterior), emphasizing cardiovascular structures. This type of reconstruction provides exquisite detail of vascular anatomy and extent of massive pulmonary embolism. Access at www.fishmansonline.com
CTA of the pulmonary arteries has supplanted conventional pulmonary angiography (except for therapeutic applications) and largely supplanted ventilation–perfusion scanning, although the latter still has an important role in specific clinical settings, such as pregnancy, young patients with normal chest radiographs, or in patients with renal insufficiency. This advanced CTA technique not only allows the diagnosis of PE and possible complications, such as pulmonary infarcts, but also accurately reflects the overall clot burden and signs of right ventricular strain, both important prognostic indicators.2
An additional, specific advanced application of CT in the chest is the evaluation of the airways. The imaging protocol for CT of the airways utilizes thin-section (1 mm), volumetric, isotropic images, both in full inspiration and end expiration. The images are acquired from the base of the tongue to the basilar segmental bronchi to include the entire tracheobronchial tree and larynx. Postprocessing 3D techniques are routinely utilized—that is, volume rendering, minimal intensity projections, and virtual bronchoscopy (Video 30-3A,B). The result is accurate depiction of global, regional, and local large airway disorders, including tracheobronchomalacia, airway stenoses, infiltrative and obstructive neoplasms, and inflammatory conditions.

Video 30-3 Full-color, coronal 3D VR (volume rendering) with 360 degrees of rotation about the long axis of the trachea, emphasizing central airways. A. Lower magnification with vertical and horizontal axis for spatial orientation. B. Higher magnification without axis. The images demonstrate an irregular, long region of segmental stenosis involving the upper trachea. The patient also presented with multiple pulmonary nodules, at least one of which was cavitary. A diagnosis of granulomatosis with polyangiitis or GPA (previously known as Wegener granulomatosis) was established on tracheal biopsy. Access at www.fishmansonline.com
An important consideration recently receiving much attention is the issue of medical radiation exposure in CT. CT, as any imaging modality that utilizes x-rays, exposes the patient to ionizing radiation, which is a known carcinogen due to stochastic effects and which, at very high doses, can have deterministic detrimental effects. To understand the true magnitude of the risks associated with radiation exposure related to diagnostic chest CT, it is critical to have a basic understanding of the ways in which radiation dose is measured, as well as how to quantitatively estimate risk based on best available evidence.
Ionizing radiation dose equivalent (which takes into account energy absorbed (J/kg) and the biologic effects of the specific type of radiation) is measured in Sieverts (Sv). Every human is exposed to approximately 3 mSv/yr of background radiation from natural and man-made sources. In contrast, a chest radiograph delivers 0.1 to 0.2 mSv, whereas a chest CT performed using standard protocols delivers between 5 to 20 mSv. Deterministic effects are extremely rare below 2000 mSv of acute exposure. Although it is difficult to quantify the magnitude of stochastic effects, the International Commission of Radiological Protection (ICRP) estimates the risk coefficient (additional cancers due to radiation exposure) as 0.00005 per mSv of exposure (i.e., ∼5% per 1000 mSv). In summary, CT delivers a low, but nonnegligible, radiation dose that is unlikely to cause detrimental biologic effects if used in a prudent and medically justifiable manner.
Notwithstanding the relative small risks, radiologists, engineers, and physicists have made substantial strides to develop reconstruction algorithms and protocol optimization techniques that decrease the radiation dose of thoracic CT to the lowest attainable level and that allows diagnostic-quality images. Among the recent dose-reduction methods that have become widely available are iterative reconstruction techniques, combined with tube current and voltage modulation. The combined effects can generate markedly reduced radiation dose, down to sub-mSv (<1 mSv) levels. This is particularly useful for low-dose screening CT, which is discussed in detail later (see Lung Cancer Evaluation).3,4
Finally, CT has a major role for guidance of thoracic interventional procedures, which is described in detail below.
CHEST MR
MR is another advanced cross-sectional technique utilized in thoracic imaging. The physics behind MR is complex and beyond the scope of this chapter. Fundamentally, MR uses a very strong static magnetic field (main field) generated by superconducting coils in combination with a radiofrequency radiation pulse sequence and variable magnetic field (gradients) to cause oscillation of hydrogen proton nuclear spins. The result is generation of a radiofrequency signal, which is detected and measured. The signal can be also spatially localized to generate an image that can be obtained in any arbitrary plane. Image contrast with MR depends on the physical properties of the tissue being imaged, as well as on the specific pulse sequence utilized (Fig. 30-7).
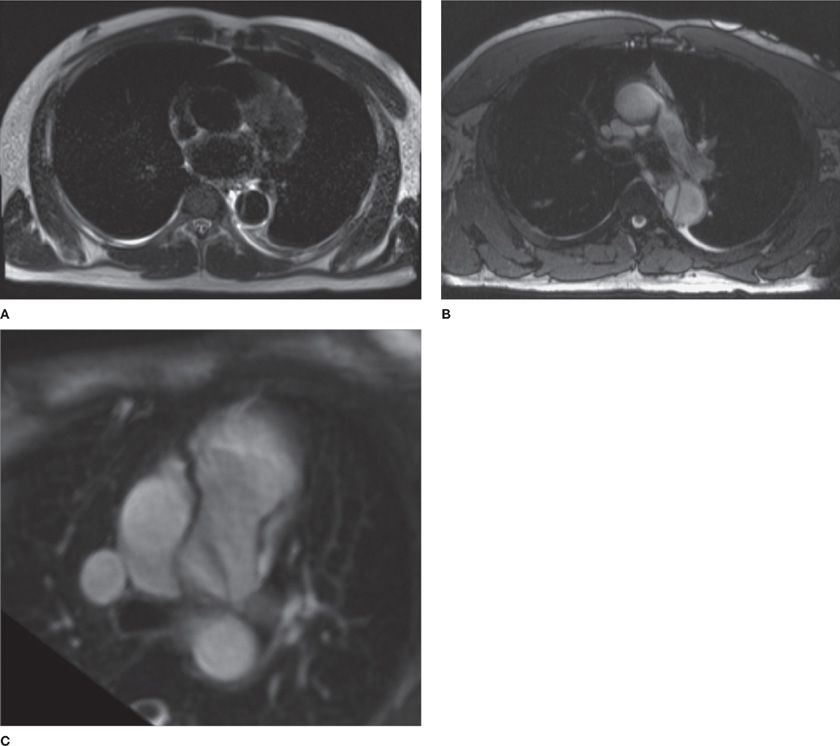
Figure 30-7 MR offers lower spatial resolution than CT; however, it allows better contrast resolution and tissue characterization through utilization of varied pulse sequences that emphasize specific aspects of tissue composition. For example, (A) and (B) demonstrate a dissection of the descending thoracic aorta. A. The blood pool appears black and this is, therefore, termed a “black blood” sequence (typically, spin echo sequence). In contrast (B) demonstrates the blood pool to be bright and is, therefore, termed a “bright blood” sequence (typically, steady-state free precession gradient echo sequence). C. Different patient with a patent ductus arteriosus (PDA), which causes a linear flow artifact (dark band from the aorta to the left PA).
MR has advantages and disadvantages with respect to CT. The main advantage of MR is the lack of ionizing radiation. CT utilizes high-energy x-rays, whereas MR utilizes low-energy radiofrequency radiation which has minimal biologic effects and no ionization potential. MR also has better contrast resolution than CT and is exquisitely sensitive in the detection of water and fat. MR thus provides a greater degree of soft tissue characterization than is possible with CT. Examples of this greater resolution of soft tissue densities include identification of proteinaceous fluid in bronchogenic cysts, which can appear solid on CT, and the presence of fat in confirming thymic hyperplasia as a cause for an anterior mediastinal mass, thereby enabling differentiation from lymphoma. Another advantage of MR over CT is that iodinated contrast material is not used, obviating the potential problem of CT contrast allergy. In the past, MR also had the advantage of intrinsic multiplanar imaging, but modern multidetector-based CT now demonstrates similar capability.
The disadvantages of MR include longer examination time, greater susceptibility to artifacts, lower spatial resolution, and generally very low signal-to-noise ratio in the lung parenchyma, making it unsuitable for optimal pulmonary parenchymal evaluation. However, it should be noted that recently developed fast-proton MR sequences appear promising for the evaluation of patients who need to undergo multiple serial imaging studies and in whom cumulative radiation exposure is of particular concern, such as in young patients with cystic fibrosis.
From a clinical perspective, MR is not the first-line advanced modality for assessment of pulmonary diseases, but it is a very valuable technique for evaluation of the heart and great vessels, for tissue characterization of mediastinal and chest wall masses, and for dynamic assessment of thoracic wall and diaphragmatic motion. Current applications of MR, in addition to those mentioned earlier, include evaluation of the brachial plexus, local staging of superior sulcus tumors, evaluation of neurogenic tumors and lesions involving the thoracic spine, and cardiac or paracardiac masses.5,6
Recently considerable interest has arisen in the use of hyperpolarized gases, including helium-3 and xenon-129, for MR imaging of the lungs. Hyperpolarized gas MR can provide detailed images of pulmonary ventilation, as well as information on lung microstructure, beyond the resolution of CT. The latter includes measurements of alveolar size and alveolar–capillary membrane thickness. Nonetheless, to date, hyperpolarized gas MR remains investigational.
PET, PET/CT, AND PET/MR
PET is a nuclear medicine emission tomographic technique (see Chapter 32), in which an intravenously administered radionuclide that decays via positron emission (most often 18F coupled to deoxyglucose [FDG]), generates an annihilation event (when a positron collides with an electron and two antiparallel 511-keV photons are simultaneously generated). The event is registered by coincidence detectors, allowing localization of the origin inside the body. Because FDG is very similar to glucose in biodistribution and pharmacokinetics, it effectively concentrates in tissues that have a high metabolic rate and therefore increased glucose uptake—namely, the brain, heart (in the nonfasting state), and many neoplasms; in addition, FDG is concentrated where it is metabolized and excreted: the liver, kidneys, and urinary collecting system. FDG-PET images essentially map the biodistribution of glucose in the body. CT and MR may be performed almost simultaneously with PET in dedicated hybrid scanners (PET/CT and, more recently, PET/MR). The higher spatial resolution of these modalities is helpful for localization of the abnormal PET signals in fused imaging analysis (Fig. 30-8).
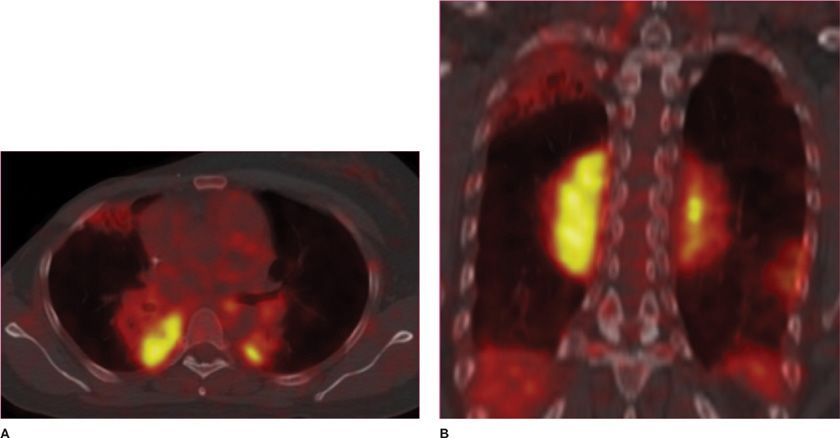
Figure 30-8 Fusion images combining CT and PET data in a patient with multifocal MALT pulmonary lymphoma. (A) Axial and (B) coronal images demonstrate that the areas of consolidation in the posterior medial lungs also demonstrate high FDG uptake, thus appearing bright yellow in this color scheme, a typical feature of metabolically active lymphomas.
It is a common misconception that PET/CT is specific for cancer diagnosis. In reality, it is not. Many normal tissues and inflammatory or infectious processes have a high metabolic rate and high glucose uptake and, therefore, are also bright on PET images. Moreover, many cancers are not highly metabolically active or are not FDG avid, and these may not be detectable by PET imaging. A typical example in the chest is an indolent adenocarcinoma in situ (AIS), formerly called bronchioloalveolar cell carcinoma (BAC).
The strength of PET/CT relies on its ability to accurately stage malignancy if the primary neoplasm is FDG avid. In this context, it is superior to CT or MR because it may demonstrate small metastases in normal-sized structures, particularly lymph nodes, which would not be detectable by CT or MR. PET/CT is, therefore, routinely employed for staging of malignancies such as lung cancer, lymphoma, head and neck carcinoma, and esophageal carcinoma.7
ULTRASOUND
US has a more limited application to thoracic imaging. The primary reason is that both the thoracic cage and the lungs act as reflecting interfaces that block penetration of the US mechanical wave. However, US has been shown to be useful for specific applications, such as detection of pneumothorax or pneumonia, as well as in evaluation of pleural effusions and chest wall pathology. In addition, it is useful in guiding imaging interventions. Thoracic US is discussed in detail in Chapter 31.
IMAGE-GUIDED INTERVENTIONS
Image-guided interventions have dramatically changed the diagnosis of thoracic diseases that require tissue sampling for pathologic confirmation. They have also impacted the treatment of many benign and malignant diseases. Increasingly, image-guided biopsy procedures are being performed for tumor genotyping to guide more targeted, personalized therapies. Half a century ago, surgical procedures were necessary to obtain tissue from the lungs, mediastinum, or chest wall. Surgical biopsies may require hospitalization, are costlier, and carry small, but measurable rates of morbidity and mortality. Currently, most diagnostic procedures can be performed percutaneously or via bronchoscopy in a minimally invasive fashion. Bronchoscopy and endobronchial interventions are described in Chapters 35 and 36 (Fig. 30-9).
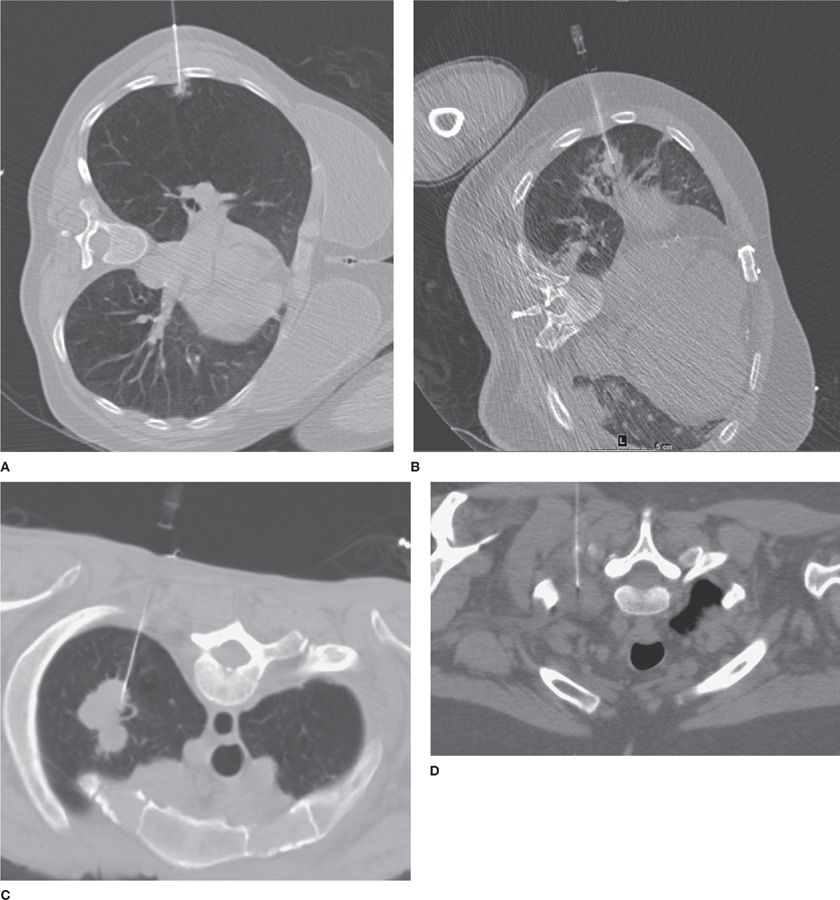
Figure 30-9 CT offers accurate, near–real-time localization of lesions for image-guided percutaneous small-needle biopsy. A. CT-guided biopsy of a small (0.8 cm) RUL spiculated nodule, a biopsy-proved adenocarcinoma; (B) CT-guided biopsy of a larger (1.8 × 2.2 cm) RML nodule, biopsy-proved small cell carcinoma; (C) CT-guided biopsy of a lobulated LUL mass (3.0 × 4.2 cm), biopsy-proved adenocarcinoma; (D) CT-guided biopsy of a soft tissue mass in the left superior sulcus, biopsy-proved malignant neurogenic neoplasm.
Percutaneous transthoracic biopsies (PTBs) may be performed via a variety of imaging guidance systems, most commonly CT, but also fluoroscopy or US (Videos 30-4 and 30-5A,B). Different needle types, lengths, and calibers may be chosen according to the clinical question and lesion characteristics. As a general rule, superficial chest wall lesions can be accessed via US or CT; pleural, pulmonary, and anterior mediastinal lesions are accessed via CT; central hilar lesions and deep mediastinal masses are not accessible via PTB.

Video 30-4 4D cine using custom window. The images are acquired sequentially at the same level and used for guidance in performing a transthoracic fine-needle aspiration (TTNA). The needle was advanced to perfectly engage a small RUL nodule (9 × 7 mm). Final diagnosis was primary adenocarcinoma. Access at www.fishmansonline.com

Video 30-5 4D cine using custom window. A. Lung window. B. Reversed lung window. The images are acquired sequentially at the same level and used for guidance in performing a transthoracic fine-needle aspiration (TTNA). The needle was advanced to perfectly engage a 14- × 13-mm LUL nodule. Final diagnosis was metastasis from RCC (renal cell carcinoma). Access at www.fishmansonline.com
There are two basic types of PTB: fine-needle aspiration (FNA) and automated core needle biopsies (CNBs). In FNA, a small-caliber needle (25–22G) is inserted through the chest wall into the lesion via CT guidance. The tip of the needle is positioned inside the lesion. Negative pressure (suction) is applied via a syringe, and fluid or clusters of cells are aspirated. The material obtained via FNA is processed using cytopathology techniques, and specific stains and molecular tests can be performed.
In contradistinction, CNB uses a larger coaxial system in which a 19G introducer (outer core) hollow needle is advanced to the pleura or close to the edge of the lesion, followed by introduction of a 20G automated inner core biopsy needle, which is advanced to the lesion. An automated mechanism is then activated, rapidly moving the needle forward and filling the needle trough, or shallow receptacle, with cylindrical “cores” of tissue. The outer sheath instantly moves forward to cut the tissue and keep it in the trough. This process is repeated several times as multiple tissue cores are obtained. The material obtained via CNB is processed using surgical pathology techniques. Both FNA and CNB provide material for microbiology studies, including stains and cultures.
From a diagnostic perspective, FNA is almost equally accurate to CNB for diagnosis of malignant diseases, although CNB is superior for diagnosis of benign diseases. FNA sensitivity for diagnosis of lung cancer is 80% to 95%, and the rate is higher if onsite cytopathology is available and the procedure is approved and performed by experienced radiologists. Limitations of FNA include diagnosis of indolent or low-grade malignancies (for which more tissue or histoarchitecture is required for confident pathologic diagnosis) and inflammatory or infectious diseases—scenarios in which CNB is superior. The advantage of FNA over CNB is a lower complication rate and the capacity to engage and sample very small lesions that would otherwise be inaccessible.
Lesion location, lesion size, and patient body habitus are major determinants utilized by the radiologist in deciding the optimal biopsy technique. All other factors being equal, large pulmonary masses (>3 cm), pleural masses, chest wall masses, and large anterior mediastinal masses are best sampled via CNB. On the other hand, small pulmonary nodules (as small as 0.8 cm), pulmonary nodules in highly mobile regions (posterior or anterior lung bases), and small lymph nodes are best approached using FNA.
Complications related to PTB are relatively infrequent, but occasionally they can be life-threatening. For mediastinal, chest wall, and pleural biopsies, the major risk is hemorrhage, with infection and postprocedural pain following in incidence. Major vascular injury is rare, but it has been reported following biopsies of mediastinal masses. For lung biopsies, the major risk is pneumothorax, followed by hemorrhage, infection, and, rarely, air embolism. While air embolism is the rarest complication, with reported frequency of 0.05% to 0.10%, it is potentially the most life-threatening, due to its unpredictable nature and difficult treatment. Pneumothorax rate varies widely according to institution, and estimates from 5% to 50% have been reported. Most postprocedural pneumothoraces are small and not clinically significant; however, in up to 5% to 10% of patients, a large or symptomatic pneumothorax requires chest tube placement.
The following precautions are advised to minimize the risks associated with PTB: (1) critical appraisal of the clinical need for biopsy and whether PTB is the best approach; (2) thorough preprocedural laboratory assessment to ensure normal platelet count and function and normal coagulation profile. Anticoagulants and antiplatelet medications should be discontinued after conferring with the referring physician; (3) performance or supervision of the procedure by an experienced radiologist; (4) careful preprocedural planning, choosing a patient position and needle trajectory that minimizes the risk of vascular injury and decreases the distance to the lesion; (5) proper biopsy technique with purposeful, fast, accurate needle motion, confirming with imaging the needle location, depth, and relationship to the lesion prior to, and after, each needle movement; and (6) minimization of the effects of patient motion by tracking chest wall movement and advancing the needle in a consistent phase of the respiratory cycle.8,9
Therapeutic, percutaneous, image-guided techniques have also been increasingly accepted and utilized. These range from percutaneous chest tube or drain placement to ablation of neoplasms utilizing microwave or cryoablation techniques. The same principles of imaging guidance described for PTB apply for percutaneous therapeutic interventions. Given their complexity and the availability of alternative treatment options (such as surgery or radiation therapy), their use is best reserved for selected patients following discussion with multidisciplinary healthcare teams.
OBSTRUCTIVE LUNG DISEASES, WITH EMPHASIS ON COPD
Pulmonary ventilation, as is the case for pulmonary perfusion, is not homogeneous; it is affected by gravity, airway caliber, and chest wall mechanics. Ventilation is greater at the bases in the erect position due to greater regional changes in lung volume with inspiration, but the apical–basal ventilation gradient is smaller than the perfusion gradient (noting that perfusion is also greater at the bases). Therefore, the ventilation–perfusion ratio (V/Q) is greater at the apices in the erect patient. A similar pattern occurs in the supine patient between the dependent posterior and the nondependent anterior lungs, albeit to a lesser extent. Changes in relative ventilation affect the relative volume and average density of the lung parenchyma and, therefore, can be depicted by imaging.
Chronic obstructive pulmonary disease (COPD) is a complex group of disorders characterized by chronic, progressive airflow limitation that is not fully reversible and is associated with a range of pathologic changes in the lungs (Chapters 39 and 40). In addition, significant extrapulmonary effects caused by chronic inflammation and structural changes are observed. The chronic airflow limitation is caused by a mixture of small airway disease (obstructive bronchiolitis) and parenchymal destruction (emphysema). In addition, large airway inflammation, with increased sputum production and cough, is the hallmark of chronic bronchitis, part of the spectrum of COPD. The relative contributions of these components vary substantially from patient to patient. The presence and extent of each component has the potential to affect clinical presentation, disease severity, prognosis, and therapeutic response. COPD is strongly related to smoking. It has emerged as the third leading cause of death in the United States.
Another clinically prevalent obstructive lung disease is asthma, which is an inflammatory condition affecting mainly small airways, with increased mucus production, airway wall inflammation, and reduced luminal caliber (Chapters 44–46). Asthma differs from COPD from an imaging standpoint in that the clinical manifestations are usually intermittent and reversible, and the degree of hyperinflation tends to be mild, except in severe, long-standing disease.10,11
Chest radiographs are not particularly useful in diagnosing obstructive lung disease. In early disease, these are generally normal, as is the case with most asthmatic patients. In more severe or advanced disease, hyperinflation ensues and can be detected radiographically. The classic radiographic appearance of hyperinflation is manifested by increased radiolucency of the lungs; low, flat diaphragms; exaggerated verticality of the heart; increased AP diameter of the chest; and widening of the retrosternal lucent space. Of all these criteria, diaphragmatic flattening is probably the most reliable in supporting a diagnosis of COPD, as it is likely associated with severe emphysema. Care must be taken in making a diagnosis, however, as hyperinflation can be simulated radiographically when a healthy person exerts a maximal inspiratory effort. The lungs also appear hyperinflated in very slender persons. Therefore, it is unwise to make the diagnosis of emphysema solely on the basis of the radiographic finding of hyperinflation (Figs. 30-10 and 30-11).
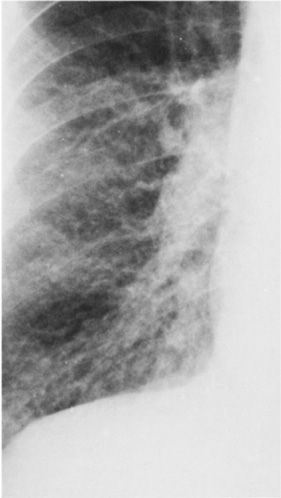
Figure 30-10 Detail view of the lung parenchyma in a PA radiograph, demonstrating increased bronchovascular markings, which are particularly prominent throughout the central lung fields. The patient has COPD with predominant chronic bronchitis. Hyperaeration is minimal.
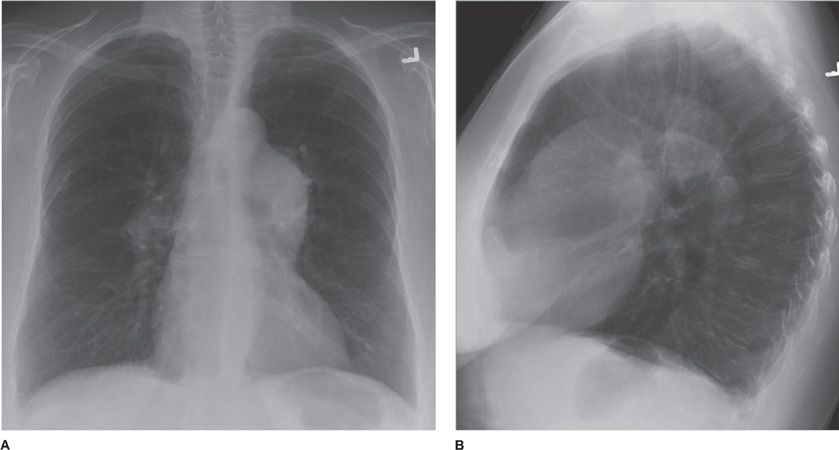
Figure 30-11 (A) PA and (B) lateral of a patient with severe emphysema-predominant COPD. Salient features are hyperinflation (denoted by flattening of the diaphragms and increased craniocaudal and anteroposterior diameters of the chest) and hyperlucency of the parenchyma. Also note prominence of the central pulmonary arteries, compatible with pulmonary hypertension.
Radiographic evaluation of the pulmonary vessels may also support a diagnosis of emphysema. Two distinctly different vascular patterns have been identified in patients with chronic bronchitis and emphysema: arterial deficiency and increased lung markings. Patients who show the arterial deficiency pattern often have panlobular emphysema and manifest the clinical syndrome of the “pink puffer.” Those who have the pattern of increased lung markings often have centrilobular emphysema and manifest the “blue bloater” syndrome. Notably, these radiographic findings occur relatively late in the clinical course of emphysema. Moreover, these findings are not specific and must be considered in the clinical context provided.
Similarly, the diagnosis of chronic bronchitis is a clinical one, based upon a history of chronic cough and sputum production and supplemented by characteristic abnormalities in pulmonary function tests. The radiograph rarely provides substantive help. Vascular markings throughout the lung fields are sometimes prominent, but this finding is nonspecific.
CT, on the other hand, is capable of demonstrating the pathologic changes associated with COPD, including large and small airway inflammation and parenchymal destruction (emphysema). Three basic types of emphysema can be detected by CT—centrilobular, paraseptal, and panlobular.
Centrilobular emphysema is characterized by focal areas of lucency within the centers of secondary pulmonary lobules and without perceptible walls. The lobular arteries and bronchi are maintained, appearing as small dots within the involved secondary lobules. These features help to differentiate the holes of centrilobular emphysema from the cysts of cystic lung disease, as the latter have thin walls and are devoid of internal structure.
Paraseptal emphysema occurs peripherally, adjacent to the visceral pleura, and adjacent to the bronchovascular interstitium. Centrilobular and paraseptal emphysema are both associated with smoking and, therefore, tend to coexist, although the contribution of each form for the total amount of emphysema varies substantially. There is generally upper lung predominance, except in very severe disease. The extreme form of paraseptal emphysema is evident as bullous disease, in which the cystic spaces may become large enough to compromise lung mechanics due to their mass effect.
Finally, panlobular emphysema is a distinct entity in which there is diffuse hyperlucency, hypovascularity, and a paucity of interstitial markings, often with a basilar predominance. These important findings can be overlooked even in patients with marked panlobular emphysema, since there are no discrete holes, as is the case in centrilobular emphysema. This form of emphysema is less likely associated with smoking, and more likely associated with α1-antitrypsin deficiency, a genetic condition that can be exacerbated by smoking (Figs. 30-12 and 30-13).12–14
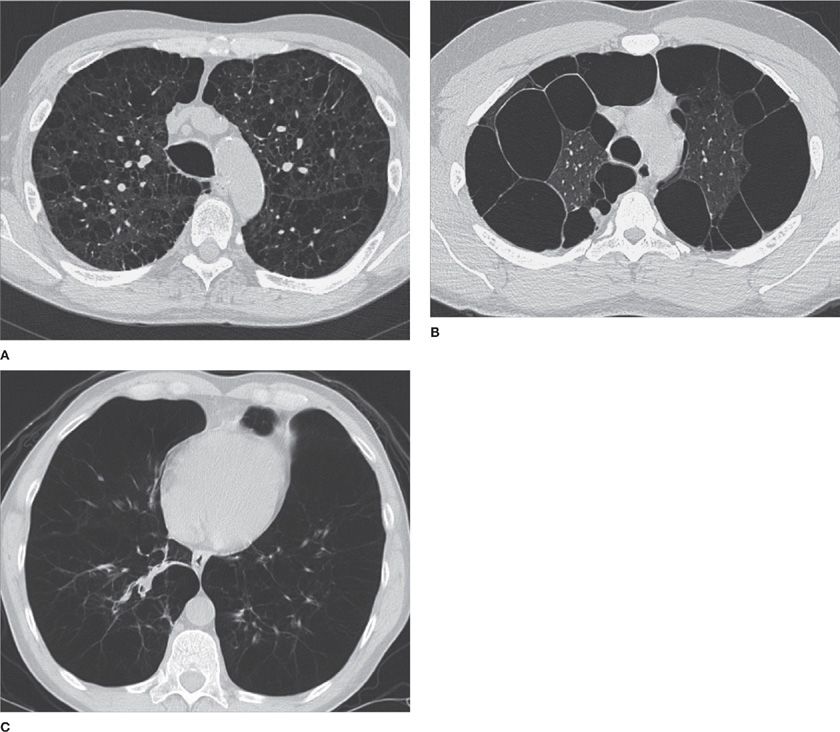
Figure 30-12 Three different phenotypes of emphysema. A. Centrilobular. B. Paraseptal. C. Panlobular. The images demonstrate different configurations and anatomical distribution of parenchymal destruction. (A) and (B) are typically smoking-related, whereas the patient in (C) had α1-antitrypsin deficiency.
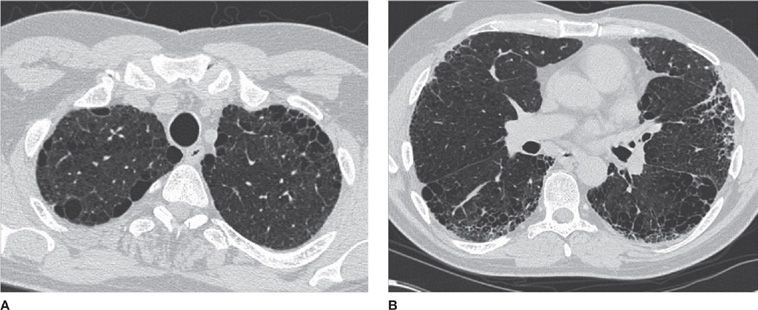
Figure 30-13 Severe emphysema and pulmonary fibrosis in a long-term smoker. A. Paraseptal and centrilobular emphysema involving the upper lung fields; (B) Additional presence of traction bronchiectasis, peripheral reticulation and honeycombing—features of fibrosis. Smoking-related pulmonary fibrosis is associated with COPD and resembles UIP from an imaging standpoint.
Large airway inflammation as a manifestation of chronic bronchitis may be suggested by the presence of airway wall thickening, the diagnosis of which is somewhat subjective, although several studies have described computer-assisted quantitative measurement methods. Mucoid impaction is a reliable indicator of airway inflammation, but it is not specific for COPD, as it can be seen in the setting of asthma, acute bronchitis, or bronchopneumonia.
Small airway inflammation was previously the most difficult component of COPD to diagnose by imaging. While it is still not possible to directly image inflammation of the very distal airways, expiratory CT now provides the best technique to indirectly diagnose small airway disease. The presence of small airway disease may be inferred by the presence of expiratory air trapping. Normally, the average CT attenuation of aerated lung parenchyma increases in expiration due to volume averaging of voxels that contain less air. In contrast, with air trapping, the increased lung attenuation with expiration is not observed. Thus, in the presence of small airway disease a “mosaic attenuation pattern” is demonstrated on CT images obtained in end expiration, with the darker (lower attenuation) areas corresponding to areas of regional air trapping. Up to 25% of the lung may show air trapping in healthy subjects (typically at the lung bases); higher degrees of air trapping correlate with decreases in functional parameters assessed with pulmonary function testing, such as residual volume (RV) or functional residual capacity (FRC) (Figs. 30-14 and 30-15).
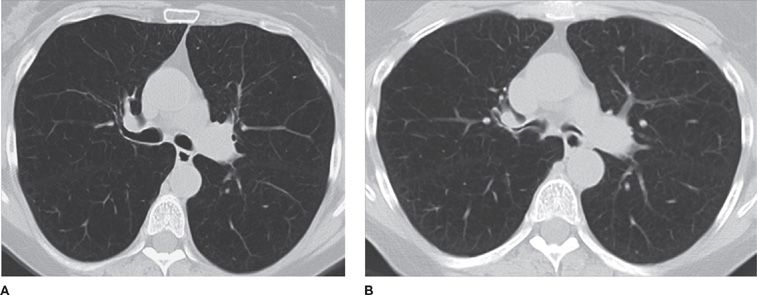
Figure 30-14 (A) Inspiratory and (B) expiratory CT images at the level of the mainstem bronchi, demonstrating dynamic expiratory collapse of the central airways, indicative of bronchomalacia, a common association with COPD.
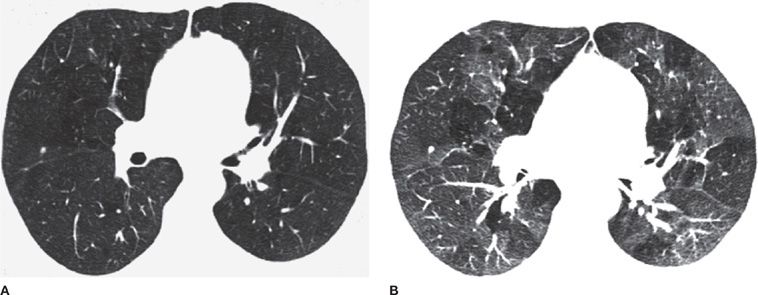
Figure 30-15 (A) Inspiratory and (B) expiratory CT images demonstrate the presence of mosaic attenuation (i.e., geographic areas of low parenchymal attenuation interspersed within normal, higher-attenuation areas in expiration), characteristic of air trapping. This patient had a diagnosis of bronchiolitis obliterans.
The major future trend in the imaging of COPD is the development of computer-assisted quantification techniques for disease phenotyping, namely, detecting and measuring the severity and relative contributions of emphysema and large and small airway diseases to the overall clinical presentation and functional status. Many studies have been published on this subject in the last decade. For quantitative imaging, strict standardization of the scanning technique is required. Sophisticated computer algorithms are also required to accurately separate the lung parenchyma, central airways, central vasculature, mediastinum, and chest wall structures based upon attenuation characteristics and geometric constraints using thin-section, isotropic volumetric data sets primarily obtained using CT. A variety of computational methods can then be applied to detect several disease patterns and characterize their extent and distribution, for both diagnosis and disease quantification as a means of better assessing prognosis and response to therapies.15,16
It has been established that “attenuation masks” that separate all low attenuation voxels in the segmented lung parenchyma (e.g., areas of <–950 HU), not including central airways, can accurately quantify the volume of emphysema compared with the reference standard of pathologic assessment. Such CT measures of emphysema demonstrate strong correlation with functional metrics that denote obstruction (e.g., FEV1/FVC,%). Moreover, it is possible to measure the thickness of the central airways (to the fifth or sixth generation) as a quantitative metric in chronic bronchitis. In addition, small airway disease can be indirectly measured using quantification of expiratory air trapping, which can be accomplished via several different techniques. The simplest method uses attenuation masks in expiration. Voxels measuring less than –856 HU on expiratory CT are considered areas of air trapping. This attenuation threshold has been validated in multiple publications. More sophisticated techniques take into account how much each voxel varies in attenuation between full inspiration and end expiration (at FRC). The latter approach requires mathematical, nonrigid registration techniques that track individual voxel motion and regional volume changes between data acquired at two different time points, allowing for a one-on-one correspondence between lung voxels in inspiration and expiration.17,18
While these sophisticated quantitative applications are still largely investigational, they will likely reach the clinical realm within this decade. Studies continue to validate the superiority of quantitative imaging over standard qualitative assessment of thoracic imaging studies, demonstrating improved correlations with disease severity and functional impairment. Such quantitative imaging will ultimately provide better tools to estimate prognosis and monitor the efficacy of therapy.
INTERSTITIAL LUNG DISEASE
Interstitial lung disease (ILD) is a broad and complex topic, with many distinct and unrelated clinical entities potentially contributing to a single imaging pattern. Their detailed pathophysiology is described elsewhere. The focus of this discussion is the contribution of imaging to the differential diagnosis of ILD, emphasizing the most common and clinically relevant diseases.
The chest radiographic pattern of interstitial disease differs from the pattern of alveolar disease in that with interstitial disease the imaging pattern tends to be discrete and sharp, rather than fluffy and irregular; the lesions tend to be diffused, rather than localized. In addition, coalescence is not a typical feature in ILD, and the small opacities are characteristically nodular, reticular, or linear. Large masses or consolidations are not characteristic of the interstitial pattern (Fig. 30-16).
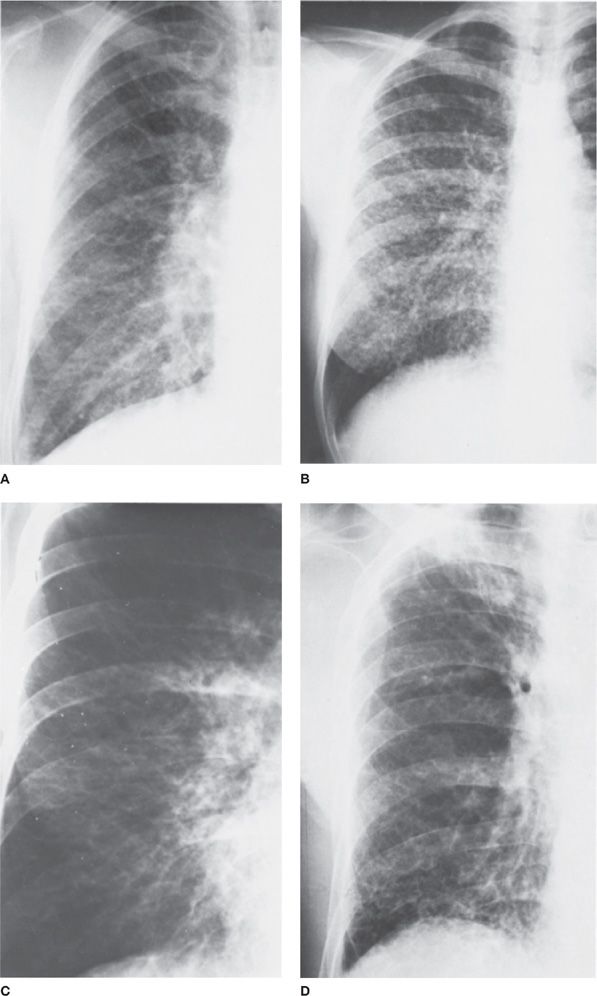
Figure 30-16 Radiographic patterns of interstitial disease. A. Linear interstitial pattern produced by interstitial pulmonary edema. The pattern is caused by fluid in the axial and septal interstitial spaces of the lungs, particularly in interlobar septae. B. Nodular interstitial pattern due to sarcoidosis. Multiple small, discrete nodules involve both lung fields diffusely. Adenopathy is absent. C. Lymphangitic spread of neoplasm. The linear interstitial pattern was caused by metastatic carcinoma of the pancreas. D. Reticular interstitial lung pattern. The pattern is most marked at the bases and is characteristic of idiopathic pulmonary fibrosis or collagen vascular disease, particularly scleroderma (as in this patient).
In and of itself, the recognition of an interstitial pattern on chest radiographs is not specific for a particular diagnosis. Most often a CT is necessary for further characterization. However, two observations that may provide useful insight into the likely diagnosis are the temporal course and distribution of disease.
Most interstitial diseases have a chronic, progressive course. Therefore, recognition of an acute interstitial pattern, that is, development and rapid evolution over hours or a few days, is strongly suggestive of interstitial pulmonary edema. This is even more likely if ancillary findings indicative of congestive heart failure or volume overload are present, such as cardiomegaly, pleural effusions, and widening of the vascular pedicle in the mediastinum. Occasionally, a rapidly changing interstitial pattern represents atypical pneumonia due to Pneumocystis jiroveci, cytomegalovirus, or mycoplasma. The acute interstitial disorders typically cause a radiographic linear or reticular pattern, which is characterized by prominent Kerley lines throughout the lungs.
In his original description in 1951, Kerley associated thin, radiographic parenchymal opacities with left ventricular failure. Initially, Kerley lines were thought to represent swollen pulmonary lymphatics. It is now recognized that Kerley lines usually represent edematous septae within the pulmonary interstitium. Three patterns exist. Kerley type B lines are the most familiar and are particularly prominent at the lung bases, where they appear as straight, thin, peripheral lines approximately 1 cm long and oriented parallel to the diaphragm. Kerley type A lines represent septae deep within the substance of the lungs; they radiate from the hili, but they are thinner than central vessels. Kerley type C lines probably represent coalescence of A and B lines and are difficult to recognize.
Chronic ILDs may be caused by a wide variety of diseases, including idiopathic interstitial pneumonias, connective tissue diseases, pneumoconiosis, sarcoidosis, lymphangitic spread of malignancy, infections, Langerhans cell histiocytosis (LCH), and lymphangioleiomyomatosis (LAM). Of note, LCH and LAM are not interstitial diseases per se, but rather cystic lung diseases that can present as an interstitial pattern on chest radiography; they are better characterized as cystic diseases on CT.
Characterization of the pattern of interstitial disease as nodular, reticular, or linear on chest radiograph may help in differential diagnosis, since many of the ILDs have a predilection for one of these three patterns. However, beyond that, the radiographic findings are not sufficient for a specific diagnosis. Nonetheless, separation of the distribution of disease into two broad categories can be helpful—upper lung predominant versus basilar predominant.
Upper lung–predominant distribution favors airway-related pathology, with inhalational diseases such as infections, LCH, and pneumoconiosis predominating in this group. Moreover, sarcoidosis is also typically upper lung predominant, a finding compatible with the hypothesis that the disease is triggered by an inhaled agent, although its exact cause remains elusive. On the other hand, basilar-predominant distribution favors idiopathic interstitial pneumonias and connective tissue diseases, in which increased blood flow and greater regional volume changes may play a role in explaining the lower lung predominance. Following such radiographic assessment, CT is generally the next diagnostic step.19,20
CT has been validated as the optimal imaging technique for evaluating chronic ILDs. CT can often identify interstitial disease that is not seen on chest radiography, and it provides better disease pattern characterization to enable identification of the underlying etiology, as well as better qualitative or quantitative assessment of severity. CT patterns of ILD follow, to some degree, the patterns seen on the chest radiograph; however, CT allows distinction of reticular, linear, and nodular patterns much more confidently. In addition, it permits evaluation of ancillary findings, such as honeycombing, traction bronchiectasis, ground-glass opacities, and cystic changes, all of which may be very challenging or impossible to recognize on chest radiographs. Important to emphasize is that, as previously discussed, every chest CT performed using current protocols on modern scanners may serve as a high-resolution examination. Therefore, the distinction between standard and high-resolution chest CT is obsolete, and detailed interstitial disease characterization can be performed on all current chest CT studies.21
Careful analysis of the CT in evaluating ILD can be described as comprising three steps.
The first step in the diagnostic approach of ILD on CT is to exclude interstitial pulmonary edema as the cause. An acute course and ancillary findings of cardiomegaly, bilateral pleural effusions, and central vascular engorgement strongly suggest interstitial pulmonary edema. CT findings include symmetric bilateral axial (peribronchovascular) and interlobular septal thickening, with central and basilar predominance. Ground-glass opacities may be present, denoting concomitant alveolar edema. It is important to remember that lymphangitic spread of neoplasm may present with a similar CT pattern; however, the temporal course is not acute and the findings are often asymmetric and more nodular, with additional features of malignancy present, such as pulmonary masses and hilar or mediastinal lymphadenopathy.22,23
The second step is to decide whether usual interstitial pneumonia (UIP) is the most likely cause of the pattern. UIP is the pathologic correlate of idiopathic pulmonary fibrosis, although it may also be associated with connective tissue disorders and asbestosis, as well. The latter should be considered if other findings that correlate with asbestos exposure, such as pleural plaques, are present. It is important to recognize UIP because it generally has a much worse prognosis than other causes of ILD and because typical CT features may be sufficient for diagnosis and obviate the need for surgical lung biopsy. CT imaging findings of UIP include symmetric, basilar-predominant reticular opacities, peripheral stacked layers of small cysts (honeycombing), and traction bronchiectasis (Video 30-6). Honeycombing, in particular, is the imaging finding most suggestive of, and specific for, UIP. If this constellation of findings is present, the pattern can be confidently diagnosed as typical UIP and a surgical biopsy avoided.22

Video 30-6 Axial cine images using lung window, demonstrating a typical usual interstitial pneumonia (UIP) pattern of fibrosing interstitial lung disease—in this case, idiopathic (and, therefore, classified as IPF, or idiopathic pulmonary fibrosis). Access at www.fishmansonline.com
The third step is to ascertain whether there are features that suggest fibrosis but which are not typical of UIP. In the absence of honeycombing, the combination of reticulation, architectural distortion, and traction bronchiectasis indicates the presence of fibrosis. If fibrosis is present, the differential diagnosis is relatively limited, including atypical UIP, fibrotic nonspecific interstitial pneumonia (NSIP), end-stage sarcoidosis, and chronic hypersensitivity pneumonitis (CHP). Fibrotic NSIP is favored over atypical UIP if there is central, rather than peripheral, predominance, and honeycombing and associated ground-glass opacities are absent. Moreover, the early phase of NSIP may manifest as multifocal bilaterally symmetric ground-glass opacities without fibrotic features or consolidation, denoting early inflammatory changes (cellular NSIP) (Video 30-7). Untreated cellular NSIP generally progresses to fibrotic NSIP, though cellular NSIP tends to respond to anti-inflammatory drugs such as steroids. Nonetheless, significant overlap occurs between fibrotic NSIP and atypical UIP. Both may be idiopathic or associated with connective tissue disorders. Clinical correlation and laboratory tests usually are required to exclude a connective tissue disorder. Of note, the presence of a patulous esophagus may be a clue to the diagnosis of CREST syndrome or systemic sclerosis (Figs. 30-17 and 30-18).24

Video 30-7 Axial cine images using lung window, demonstrating mild interstitial lung disease characterized by basilar-predominant ground-glass opacities without overt fibrotic features, likely reflecting cellular nonspecific interstitial pneumonia (NSIP). In this case, the findings were attributed to connective tissue disease (likely due to scleroderma). Access at www.fishmansonline.com
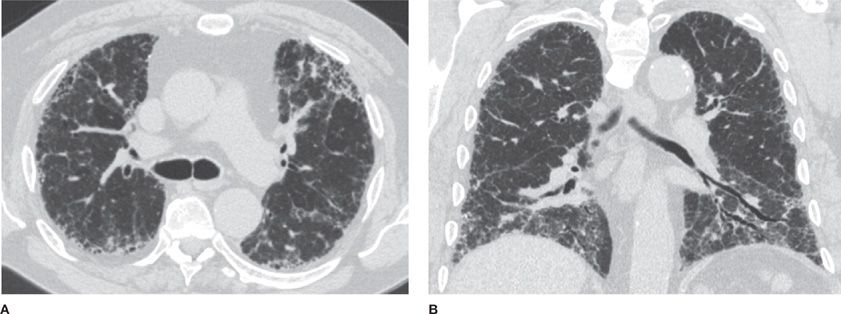
Figure 30-17 (A) Axial and (B) coronal CT images demonstrate a classic usual interstitial pneumonia (UIP) pattern, depicting symmetric, basilar- and peripheral-predominant reticulation, traction bronchiectasis and honeycombing. A UIP pattern confers the worst prognosis among interstitial diseases and is associated with the clinical diagnosis of idiopathic pulmonary fibrosis (IPF).
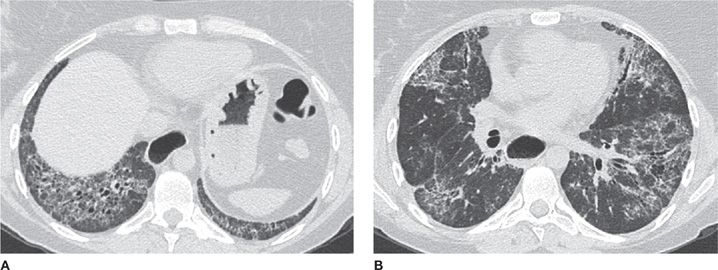
Figure 30-18 (A) Axial basilar and (B) axial midlung CT images in a patient with nonspecific interstitial pneumonia (NSIP) pattern. This pattern is distinguished from UIP by the absence of honeycombing and the more central (or peribronchovascular) distribution of reticulation denoting fibrosis. Traction bronchiectasis is also noted. The patient had a clinical diagnosis of scleroderma.
Sarcoidosis is suspected when there is a combination of upper lung–predominant disease that is bilaterally symmetric, axial and interlobular septal interstitial thickening, multiple diminutive nodules with perilymphatic distribution (see section on Pulmonary Nodules and Lung Cancer, below), and associated mediastinal and hilar lymphadenopathy. Mosaic air trapping may also be present. The presence of fibrotic features denotes end-stage disease (radiographic Stage IV). The differential diagnosis includes interstitial pulmonary edema and lymphangitic spread of neoplasm, with interlobular septal thickening as the unifying theme for these three entities.25
CHP frequently is associated with a mosaic attenuation pattern that is accentuated on expiratory imaging, denoting heterogeneous small airway air trapping. In addition, CHP tends to show upper zone predominance and may cause multiple tiny nodules. The presence of air trapping is somewhat specific for CHP in the setting of pulmonary fibrosis that does not conform to typical UIP or show features of sarcoidosis, unless the patient has superimposed asthma or COPD (Figs. 30-19–30-21).26
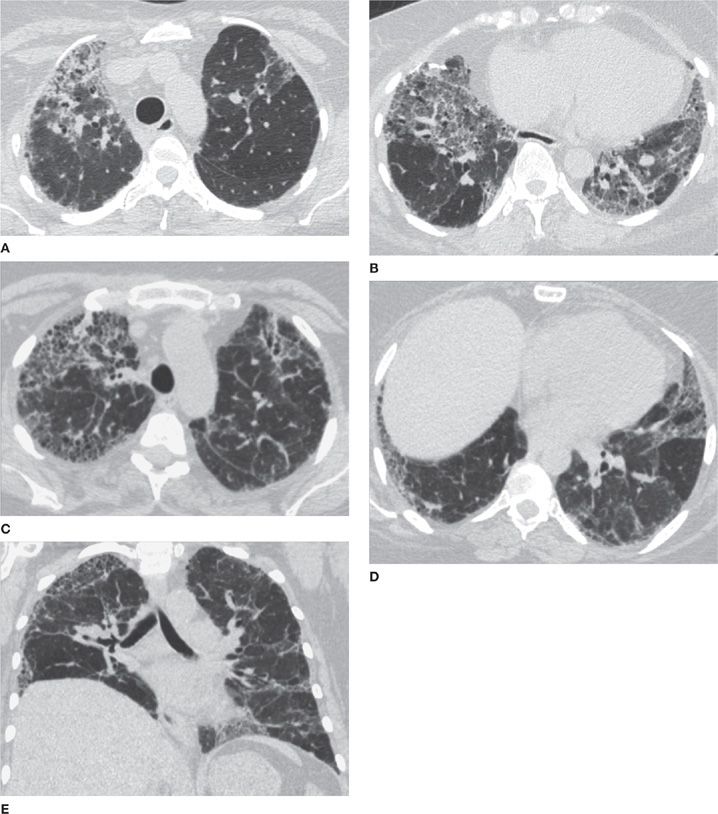
Figure 30-19 (A) and (B) are axial apical and axial basilar CT images in a patient with biopsy-proved CHP (chronic hypersensitivity pneumonitis); (C), (D), and (E) are axial apical, axial basilar, and coronal CT images in another patient with the same diagnosis, but with a more severe presentation. CHP is a differential diagnosis of fibrosing interstitial disease. It differs from UIP and NSIP by the upper lung predominance, patchy (or nonhomogeneous) distribution, and presence of air trapping (noting mosaic attenuation).
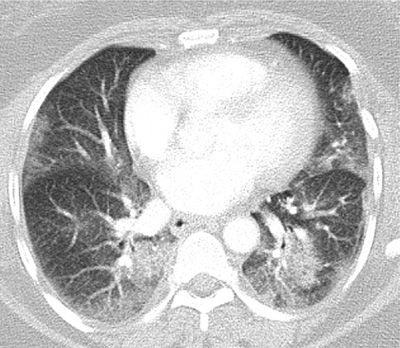
Figure 30-20 Multifocal airspace consolidation and ground-glass opacities in a patient with cryptogenic organizing pneumonia (COP). Infection is the most common differential diagnosis.
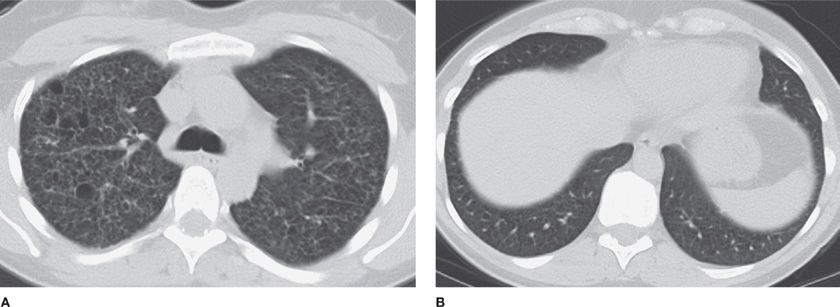
Figure 30-21 (A) and (B) are axial apical and axial basilar CT images in a patient with Langerhans cell histiocytosis (LCH). Although LCH is not considered an interstitial lung disease proper (instead, it is classified as a cystic lung disease), this disease does cause an interstitial pattern on chest radiographs. Key features are cysts with upper lung predominance, occasional nodules, and associated hyperinflation. A strong smoking history is often elicited.
Pneumoconioses, particularly silicosis and berylliosis, may present with interstitial interlobular septal and axial thickening, as well as with perilympathic nodules—a pattern that can be indistinguishable from sarcoidosis. The presence of calcified nodules and mediastinal or hilar lymph nodes support the diagnosis of pneumoconiosis, but these findings may also be seen with sarcoidosis. Specific environmental exposure history is, of course, central in suggesting the diagnosis of pneumoconioses.
Currently, severity of ILD is assessed routinely via subjective analysis of disease extent on CT, along with evaluation of the degree of restriction on pulmonary function testing. Ongoing research has shown the promise of computational quantitative imaging techniques, which allow not only accurate diagnosis based upon pattern, but also quantification of the individual contributions of each pattern feature (e.g., ground-glass opacities and septal thickening) to the overall disease extent. This approach offers the potential for better tools for monitoring disease progression, predicting prognosis, and development of quantitative, surrogate imaging biomarkers for future medication trials.27
PULMONARY NODULES AND LUNG CANCER
Pulmonary nodules are exceedingly common and may be noted in up to 50% of CT examinations performed in hospital settings. Furthermore, the differential diagnosis is extremely broad and the imaging findings often nonspecific. Therefore, management of pulmonary nodules can be very challenging. We aim here to present a practical, evidence-based approach that is centered on answering four key questions: (1) Is the nodule likely malignant? If so, what is the best approach to tissue sampling? (2) If not, does the nodule need to be followed? If so, how often and for how long? (3) If it is not likely malignant, is the nodule likely to be manifestation of an infectious or inflammatory process that requires pathologic confirmation for proper management? (4) Does the nodule have any features that allow either a specific diagnosis or a confident diagnosis of benignity? The reader is also referred to Chapter 110 for further discussion.
The discussion of pulmonary nodules starts with their definition, which is not always straightforward. While there is no question that well-circumscribed round or ovoid opacities should be characterized as nodules, the distinction of nodules from focal consolidations and interstitial opacities can sometimes be cloudy, particularly when ill-defined or ground-glass nodules are taken into account. As a general rule, any opacity that has mostly convex borders and a shape that can be described as round or ovoid should be classified as a nodule. This has implications for differential diagnosis (Figs. 30-22 and 30-23).
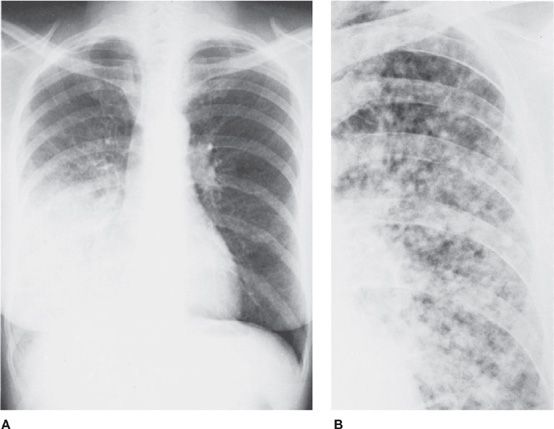
Figure 30-22 Radiographic patterns of adenocarcinoma. A. Large area of consolidation in the right lower lobe. The alveolar pattern suggests pneumonia, but it failed to improve with antibiotic treatment and was discovered to be an adenocarcinoma. B. Multiple ill-defined nodules. The nodules have irregular or fuzzy margins that are characteristic of alveolar, rather than interstitial, nodulation, in this patient with metastatic adenocarcinoma.
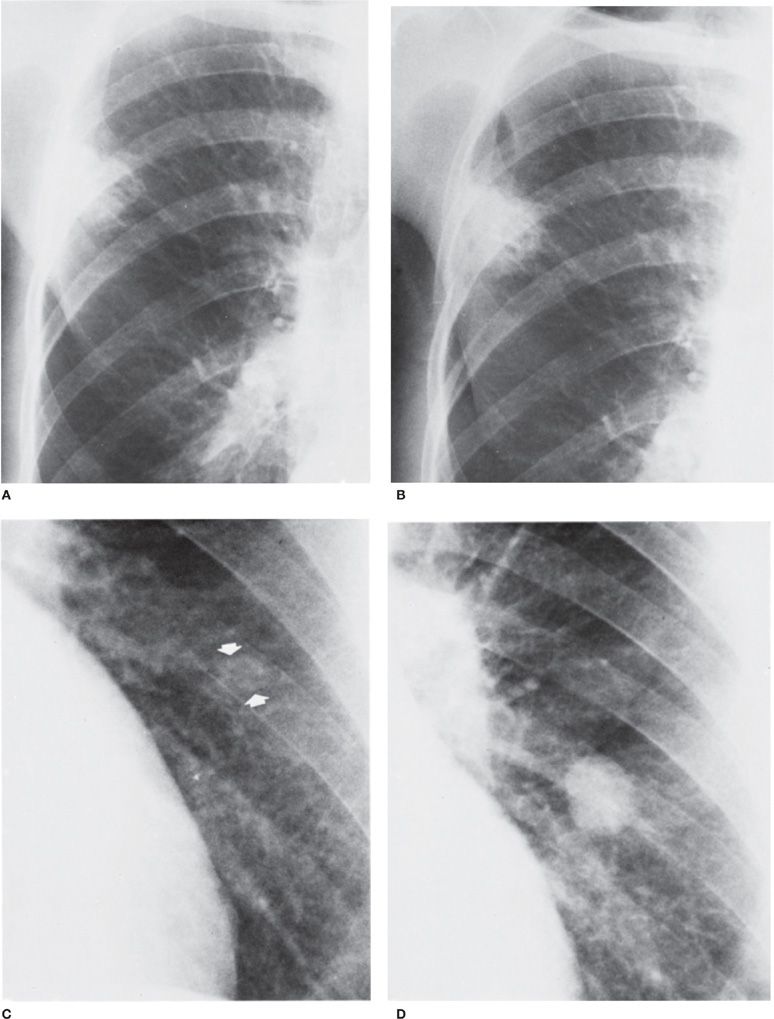
Figure 30-23 Top: Carcinoma of the lung with a long doubling time. An interval of 18 months elapsed between (A) and (B). The right upper lobe lesion, which enlarged minimally during that time, proved to be primary squamous cell. Bottom: Carcinoma of the lung with a short doubling time. An interval of 4 months elapsed between (C) and (D). The nodule was not detected on the first radiograph (C). It proved to be a primary small cell carcinoma.
From an imaging perspective, the following descriptors are important in assigning a nodule to a particular differential diagnostic category: number (solitary versus multiple), size, border, CT attenuation, and distribution (if multiple). Below each category is described and a strategic approach to diagnosis and management discussed, emphasizing a combination of clinical and CT findings.28,29
To answer the first question, that is, the nodule likely to be malignant, one must be cognizant of the pretest clinical probability. Age is important; the older the patient, the more likely that a lung nodule is malignant. Smoking history and COPD are major risk factors for lung cancer and should be taken into account. A known diagnosis of malignancy also places the patient at a higher risk of pulmonary metastases.
Nodule features on CT are of considerable importance in suggesting malignancy. For a solitary nodule, the larger its size, the more likely it is malignant and represents a primary bronchogenic carcinoma. Ill-defined borders are also more highly associated with primary bronchogenic carcinoma than benign etiologies, although infectious processes, such as fungal pneumonia, also have to be considered in the proper clinical setting. Mixed attenuation nodules, that is, subsolid nodules with coexistence of solid and ground-glass components, are highly associated with a diagnosis of primary bronchogenic carcinoma. Multiple nodules that are well circumscribed, vary in size, and are basilar predominant are strongly suggestive of metastatic disease (Figs. 30-24–30-32).
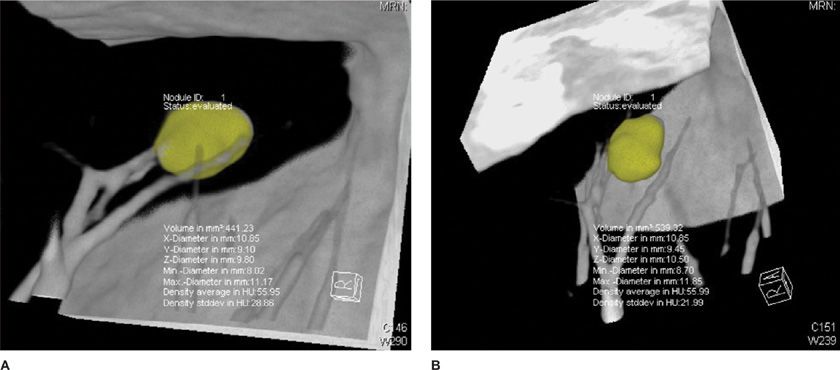
Figure 30-24 CT allows accurate volumetric measurement, which is not possible with chest radiographs, with the use of postprocessing software for nodule segmentation and volume calculation. This nodule grew from 441 mm3 (A) to 539 mm3 (B) in 7 months, an increase of 19%; it was later confirmed as metastasis from colon cancer.
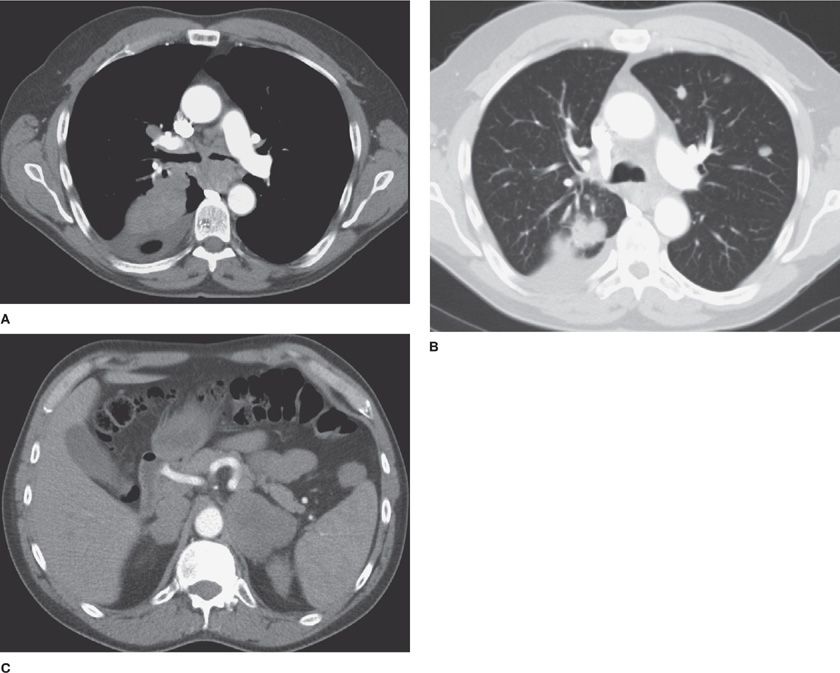
Figure 30-25 Advanced-stage lung cancer. The right lower lobe mass was proved to represent a small cell carcinoma. A. Axial CT on soft tissue window demonstrates the primary RLL mass, a malignant right pleural effusion, and mediastinal lymphadenopathy. B. Axial CT on lung window demonstrates multiple metastatic nodules in the left lung. C. Axial CT on soft tissue window demonstrates bilateral adrenal metastasis. The constellation of findings indicates Stage IV disease.
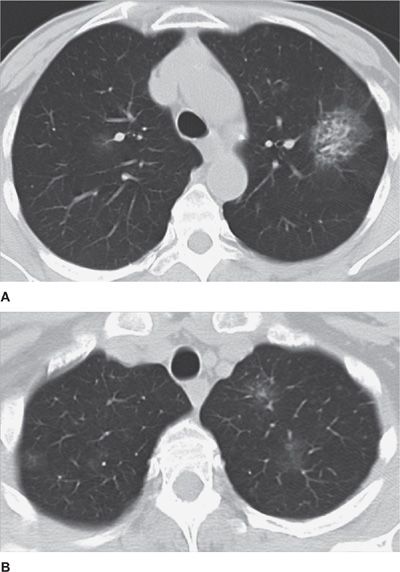
Figure 30-26 Spectrum of pulmonary adenocarcinoma. A. Axial CT image demonstrates a dominant, mixed-attenuation left upper lobe nodule, with solid and ground-glass components, which was resected and characterized as an adenocarcinoma. B. Axial CT image at a higher level demonstrates multiple smaller nodules, some of them mixed, most of purely ground-glass attenuation, which are compatible with multiple lesions in the spectrum of atypical adenomatous hyperplasia (AAH), adenocarcinoma in situ (AIS), and minimally invasive adenocarcinoma (MIA). In the past, all of these lesions would have been classified as BACs (bronchoalveolar carcinomas), a terminology that should no longer be utilized, as discussed in the text.
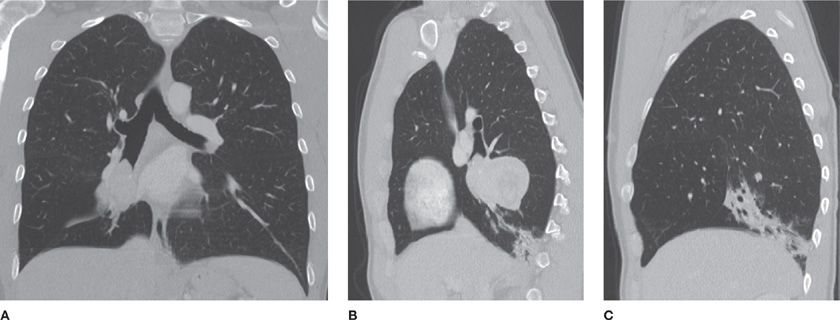
Figure 30-27 Coronal (A) and two sagittal CT images (B) and (C) showing a large endobronchial mass obstructing the RLL and growing concentrically into the lung parenchyma, with well-circumscribed borders. Note the associated atelectasis of the RLL basilar posterior segment. This mass was a carcinoid neoplasm.
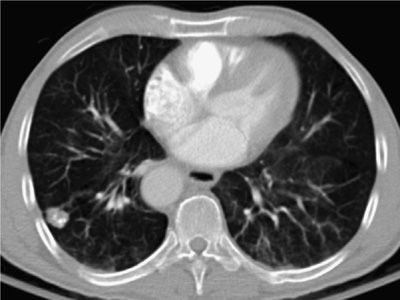
Figure 30-28 Right lower lobe nodule with coarse calcification, typical of a benign pulmonary hamartoma. Incidentally noted is a right-sided descending thoracic aorta.
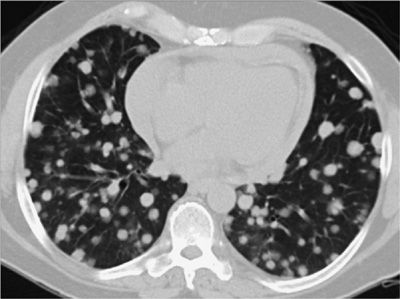
Figure 30-29 Differential diagnosis of multiple pulmonary nodules: axial CT image showing multiple well-circumscribed nodules, of varying size, characteristic of pulmonary metastases, in this case from renal cell carcinoma.
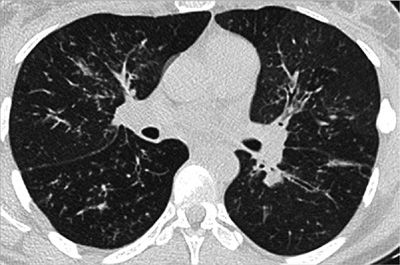
Figure 30-30 Differential diagnosis of multiple pulmonary nodules: axial CT image demonstrating very numerous, very small (1–2 mm) pulmonary nodules with a perilymphatic distribution (along the septal and axial interstitial compartments), typical of sarcoidosis—the diagnosis in this patient. This pattern can also be seen in lymphangitic carcinomatosis.
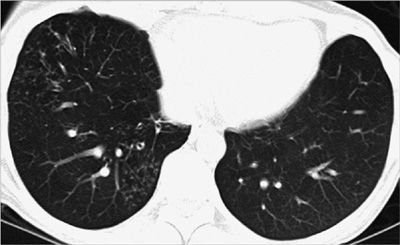
Figure 30-31 Differential diagnosis of multiple pulmonary nodules: axial CT images demonstrating multiple clusters of small nodules (measuring <2–3 mm each) in the RLL and RML, with centrilobular distribution and tree-in-bud configuration. This pattern is typical of infection and usually represents bronchiolitis. In this case, it was due to nontuberculous mycobacterial infection.
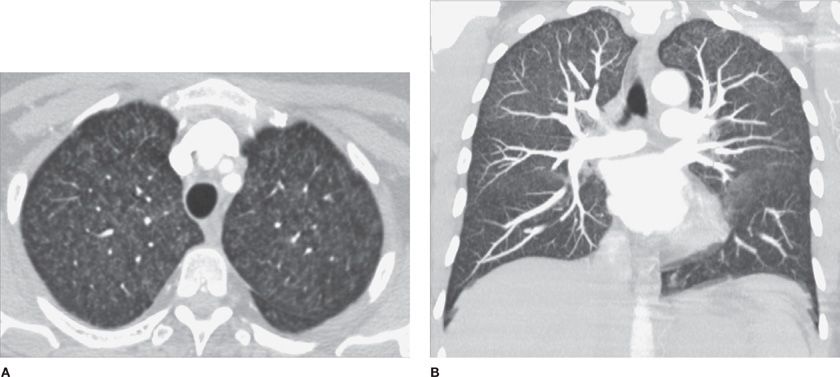
Figure 30-32 Differential diagnosis of multiple pulmonary nodules: (A) axial and (B) coronal MIP (maximum intensity projection) images demonstrate very numerous, very small (1–2 mm) pulmonary nodules with centrilobular distribution, low attenuation, and indistinct contours. Also noted is symmetric upper lung field predominance. The diagnosis is acute hypersensitivity pneumonitis. In a smoker, the differential diagnosis includes respiratory bronchiolitis.
The best evidence-based guidelines for management of solid pulmonary nodules are those published by the Fleischner Society.30 Although originally described only for solitary nodules, the guidelines are oftentimes applied to multiple nodules.
The Fleischner Society guidelines stratify the risk of malignancy and recommend imaging follow-up intervals according to nodule size and clinical risk factors (Table 30-1). Nodules measuring <4 mm in a low-risk patient do not require follow-up, whereas larger nodules in higher-risk patients require follow-up at progressively shorter intervals (between a maximum of 12 months and a minimum of 3 months). Most nodules measuring more than 8 mm and lacking definitive benign imaging characteristics or confirmation of temporal stability are potentially malignant and, therefore, require more aggressive evaluation. Evaluation may include short-term interval CT follow-up, PET imaging, and often tissue sampling, which can be accomplished via minimally invasive transthoracic CT-guided or bronchoscopic techniques, or rarely, via surgical biopsy. As a general rule, peripheral and smaller nodules are more accurately sampled using transthoracic CT-guided techniques, whereas central or larger masses are more safely approached via bronchoscopic techniques.


