1
What the ECG is about
‘ECG’ stands for electrocardiogram, or electrocardiograph. In some countries, the abbreviation used is ‘EKG’. Remember:
• By the time you have finished this book, you should be able to say and mean ‘The ECG is easy to understand’.
THE ELECTRICITY OF THE HEART
The contraction of any muscle is associated with electrical changes called ‘depolarization’, and these changes can be detected by electrodes attached to the surface of the body. Since all muscular contraction will be detected, the electrical changes associated with contraction of the heart muscle will only be clear if the patient is fully relaxed and no skeletal muscles are contracting.
THE WIRING DIAGRAM OF THE HEART
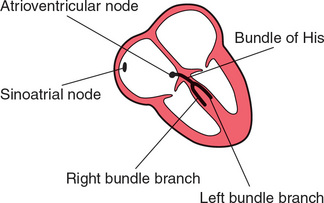
The electrical discharge for each cardiac cycle normally starts in a special area of the right atrium called the ‘sinoatrial (SA) node’ ( Fig. 1.1). Depolarization then spreads through the atrial muscle fibres. There is a delay while depolarization spreads through another special area in the atrium, the ‘atrioventricular node’ (also called the ‘AV node’, or sometimes just ‘the node’). Thereafter, the depolarization wave travels very rapidly down specialized conduction tissue, the ‘bundle of His’, which divides in the septum between the ventricles into right and left bundle branches. The left bundle branch itself divides into two. Within the mass of ventricular muscle, conduction spreads somewhat more slowly, through specialized tissue called ‘Purkinje fibres’.
THE DIFFERENT PARTS OF THE ECG
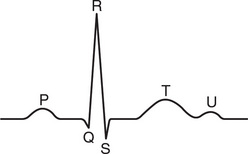
The muscle mass of the atria is small compared with that of the ventricles, and so the electrical change accompanying the contraction of the atria is small. Contraction of the atria is associated with the ECG wave called ‘P’ ( Fig. 1.2). The ventricular mass is large, and so there is a large deflection of the ECG when the ventricles are depolarized: this is called the ‘QRS’ complex. The ‘T’ wave of the ECG is associated with the return of the ventricular mass to its resting electrical state (‘repolarization’).
In some ECGs an extra wave can be seen on the end of the T wave, and this is called a U wave. Its origin is uncertain, though it may represent repolarization of the papillary muscles. If a U wave follows a normally shaped T wave, it can be assumed to be normal. If it follows a flattened T wave, it may be pathological (see Ch. 4).
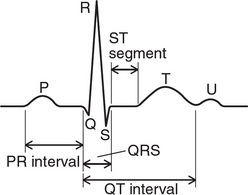
The different parts of the QRS complex are labelled as shown in Figure 1.3. If the first deflection is downward, it is called a Q wave ( Fig. 1.3a). An upward deflection is called an R wave, regardless of whether it is preceded by a Q wave or not ( Figs 1.3b and 1.3c). Any deflection below the baseline following an R wave is called an S wave, regardless of whether there is a preceding Q wave ( Figs 1.3d and 1.3e).
TIMES AND SPEEDS
ECG machines record changes in electrical activity by drawing a trace on a moving paper strip. ECG machines run at a standard rate of 25 mm/s and use paper with standard-sized squares. Each large square (5 mm) represents 0.2 second (s), i.e. 200 milliseconds (ms) ( Fig. 1.4). Therefore, there are five large squares per second, and 300 per minute. So an ECG event, such as a QRS complex, occurring once per large square is occurring at a rate of 300/min. The heart rate can be calculated rapidly by remembering the sequence in Table 1.1.
Table 1.1
Relationship between the number of large squares between successive R waves and the heart rate
| R-R interval (large squares) | Heart rate (beats/min) |
| 1 | 300 |
| 2 | 150 |
| 3 | 100 |
| 4 | 75 |
| 5 | 60 |
| 6 | 50 |
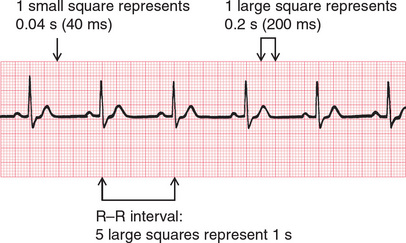
Fig. 1.4 Relationship between the squares on ECG paper and time. Here, there is one QRS complex per second, so the heart rate is 60 beats/min
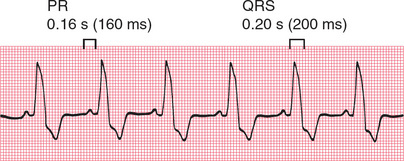
The PR interval is measured from the beginning of the P wave to the beginning of the QRS complex, and it is the time taken for excitation to spread from the SA node, through the atrial muscle and the AV node, down the bundle of His and into the ventricular muscle. Logically, it should be called the PQ interval, but common usage is ‘PR interval’ ( Fig. 1.5).
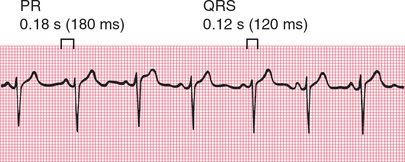
The normal PR interval is 120–220 ms, represented by 3–5 small squares. Most of this time is taken up by delay in the AV node ( Fig. 1.6).
If the PR interval is very short, either the atria have been depolarized from close to the AV node, or there is abnormally fast conduction from the atria to the ventricles.
The duration of the QRS complex shows how long excitation takes to spread through the ventricles. The QRS complex duration is normally 120 ms (represented by three small squares) or less, but any abnormality of conduction takes longer, and causes widened QRS complexes ( Fig. 1.7). Remember that the QRS complex represents depolarization, not contraction, of the ventricles – contraction is proceeding during the ECG’s ST segment.
CALIBRATION
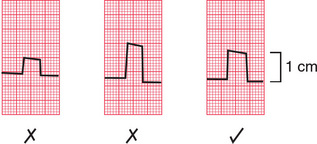
A limited amount of information is given by the height of the P waves, QRS complexes and T waves, provided the machine is properly calibrated. A standard signal of 1 millivolt (mV) should move the stylus vertically 1 cm (two large squares) ( Fig. 1.8), and this ‘calibration’ signal should be included with every record.
THE ECG – ELECTRICAL PICTURES
The word ‘lead’ sometimes causes confusion. Sometimes it is used to mean the pieces of wire that connect the patient to the ECG recorder. Properly, a lead is an electrical picture of the heart.
The ECG is made up of 12 characteristic views of the heart, six obtained from the ‘limb’ leads (I, II, III, VR, VL, VF) and six from the ‘chest’ leads (Vi-V6). It is not necessary to remember how the leads (or views of the heart) are derived by the recorder, but for those who like to know how it works, see Table 1.2. The electrode attached to the right leg is used as an earth, and does not contribute to any lead.
Table 1.2
| Lead | Comparison of electrical activity |
| 1 | LAandRA |
| II | LLandRA |
| III | LL and LA |
| VR | RA and average of (LA + LL) |
| VL | LA and average of (RA + LL) |
| VF | LL and average of (LA + RA) |
| v1 | V1 and average of (LA + RA + LL) |
| v2 | V2 and average of (LA + RA + LL) |
| v3 | V3 and average of (LA + RA + LL) |
| v4 | V4 and average of (LA + RA + LL) |
| v5 | V5 and average of (LA + RA + LL) |
| v6 | V6 and average of (LA + RA + LL) |
THE 12-LEAD ECG
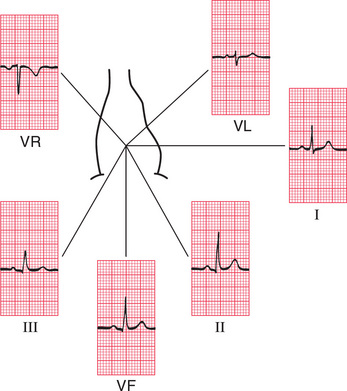
ECG interpretation is easy if you remember the directions from which the various leads look at the heart. The six ‘standard’ leads, which are recorded from the electrodes attached to the limbs, can be thought of as looking at the heart in a vertical plane (i.e. from the sides or the feet) ( Fig. 1.9).
Leads I, II and VL look at the left lateral surface of the heart, leads III and VF at the inferior surface, and lead VR looks at the right atrium.
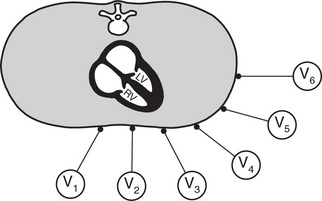
The six V leads (V1-V6) look at the heart in a horizontal plane, from the front and the left side. Thus, leads V1 and V2 look at the right ventricle, V3 and V4 look at the septum between the ventricles and the anterior wall of the left ventricle, and V5 and V6 look at the anterior and lateral walls of the left ventricle ( Fig. 1.10).
< div class='tao-gold-member'>
Stay updated, free articles. Join our Telegram channel

Full access? Get Clinical Tree


