Waveforms, Intervals, Segments, and Complexes
Much of the information that the ECG tracing provides is obtained from the examination of the three principal waveforms (the P wave, the QRS complex, and the T wave) and their associated segments and intervals. Assessment of this data provides the facts necessary for an accurate cardiac rhythm interpretation.
P wave
The first deflection of the cardiac cycle, the P wave, is caused by depolarization of the right and left atria (Figure 3-1). The first part of the P wave represents depolarization of the right atrium; the second part represents depolarization of the left atrium. The waveform begins as the deflection leaves baseline and ends when the deflection returns to baseline. A normal sinus P wave originates in the sinus node and travels through normal atria, resulting in normal depolarization. Normal P waves are smooth and round, positive in lead II (a positive lead), 0.5 to 2.5 mm in height, 0.10 second or less in width, with one P wave to each QRS complex. More than one P wave before a QRS complex indicates a conduction disturbance, such as that which occurs in second and third-degree heart block (discussed in Chapter 8).
There are two types of abnormal P waves:
▪ Abnormal sinus P wave — An abnormal sinus P wave originates in the sinus node and travels through enlarged atria, resulting in abnormal depolarization of the atria. Abnormal atria depolarization results in abnormal-looking P waves.
Impulses traveling through an enlarged right atrium (right atrial hypertrophy) result in P waves that are tall and peaked. The abnormal P wave in right atrial enlargement is sometimes referred to as p pulmonale because the atrial enlargement that it signifies is common with severe pulmonary disease (for example, pulmonary stenosis and insufficiency, chronic obstructive pulmonary disease, acute pulmonary embolism, and pulmonary edema).
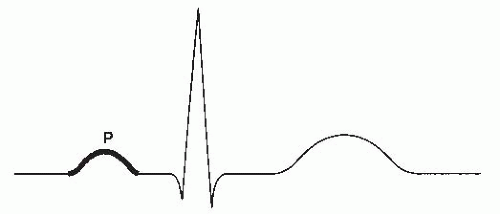 Figure 3-1. The P wave. |
Impulses traveling through an enlarged left atrium (left atrial hypertrophy) result in P waves that are wide and notched. The term p mitrale is used to describe the abnormal P waves seen in left atrial enlargement because they were first seen in patients with mitral valve stenosis and insufficiency. Left atrial enlargement can also be seen in left heart failure.
▪ Ectopic P wave — The term ectopic means away from its normal location. Therefore, an ectopic P wave arises from a site other than the SA node. Abnormal sites include the atria and the AV junction. P waves from the atria may be positive or negative; some are small, pointed, flat, wavy, or sawtooth in appearance. P waves from the AV junction are always negative (inverted) and may precede or follow the QRS complex or be hidden within the QRS complex and not visible.
Examples of P waves are shown in Figure 3-2.
PR interval
The PR interval (sometimes abbreviated PRI) represents the time from the onset of atrial depolarization to the onset of ventricular depolarization. The PR interval (Figure 3-3) includes a P wave and the short isoelectric line (PR segment) that follows it. The PR interval is measured from the beginning of the P wave as it leaves baseline to the beginning of the QRS complex. The duration of the normal PR interval is 0.12 to 0.20 seconds.
Abnormal PR intervals may be short or prolonged:
▪ Short PR interval — A short PR interval is less than 0.12 seconds and may be seen if the electrical impulse originates in an ectopic site in the AV junction. A shortened PR interval may also occur if the electrical impulse progresses from the atria to the ventricles through one of several abnormal conduction pathways (called accessory pathways) that bypass a part or all of the AV node. Wolff-Parkinson-White syndrome (WPW) is an example of such an accessory pathway.
▪ Prolonged PR interval — A prolonged PR interval is greater than 0.20 seconds and indicates that the impulse was delayed longer than normal in the AV node. Prolonged PR intervals are seen in first-degree AV block.
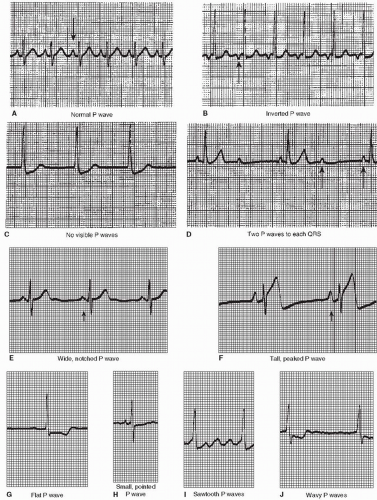 Figure 3-2. P wave examples. |
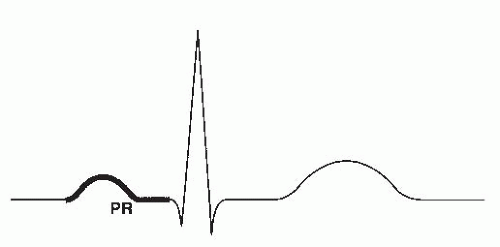 Figure 3-3. The PR interval. |
Examples of PR intervals are shown in Figure 3-4.
QRS complex
The QRS complex (Figure 3-5) represents depolarization of the right and left ventricles. The QRS complex is larger than the P wave because depolarization of the ventricles involves a larger muscle mass than depolarization of the atria.
The QRS complex is composed of three wave deflections: the Q wave, the R wave, and the S wave. The R wave is a positive waveform; the Q wave is a negative waveform that precedes the R wave; the S wave is a negative waveform that follows the R wave. The normal QRS complex is predominantly positive in lead II (a positive lead) with a duration of 0.10 second or less.
The QRS complex is measured from the beginning of the QRS complex (as the first wave of the complex leaves baseline) to the end of the QRS complex (when the last wave of the complex begins to level out into the ST segment). The point where the QRS complex meets the ST segment is called the J point (junction point). Finding the beginning of the QRS complex usually isn’t difficult. Finding the end of the QRS complex, however, is at times a challenge because of elevation or depression of the ST segment. Remember, the QRS complex ends as soon as the straight line of the ST segment begins, even though the straight line may be above or below baseline.
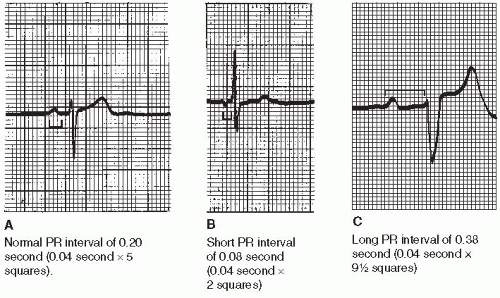 Figure 3-4. PR interval examples. |
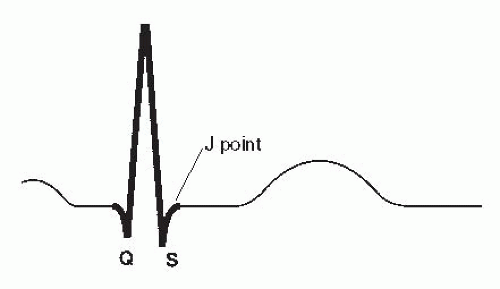 Figure 3-5. The QRS complex. |
Although the term QRS complex is used, not every QRS complex contains a Q wave, R wave, and S wave. Many variations exist in the configuration of the QRS complex (Figure 3-6). Whatever the variation, the complex is still called the QRS complex. For example, you might see a QRS complex with a Q and an R wave, but no S wave (Figure 3-6, example B), an R and S wave without a Q wave (Figure 3-6, example C), or an R wave without a Q or an S wave (Figure 3-6, example D). If the entire complex is negative (Figure 3-6, example F), it is termed a QS complex (not a negative R wave because R waves are always positive). It’s also possible to have more than one R wave (Figure 3-6, example I) and more than one S wave; (Figure 3-6, example J). The second R wave is called R prime


Stay updated, free articles. Join our Telegram channel
Full access? Get Clinical Tree
