and Mark C. Mammel2, 3
(1)
Division of Neonatal-Perinatal Medicine, C.S. Mott Children’s Hospital University of Michigan Health System, Ann Arbor, MI, USA
(2)
Neonatal Medicine, Children’s Hospitals and Clinics of Minnesota, St. Paul, St. Paul, MN, USA
(3)
University of Minnesota, Minneapolis, MN, USA
Keywords
Ventilator cycleAir leakPEEPMean airway pressureAuto-cycling2.1 Introduction
Waveforms depict the relationship between respiratory parameters and time on a breath-to-breath basis. The three most commonly used signals are pressure (cm H2O), volume (mL), and flow (mL/s), and these three signals describe the respiratory cycle. Most graphic monitors are now capable of displaying all three waveforms simultaneously; some display only one or two.
When displayed in aggregate, the cyclic phases of respiration can be appreciated. Each waveform has distinct points of initiation of inspiration, peak inspiration, end of inspiration/initiation of expiration, and end of expiration. These are depicted schematically in Fig. 2.1a and actually in Fig. 2.1b.
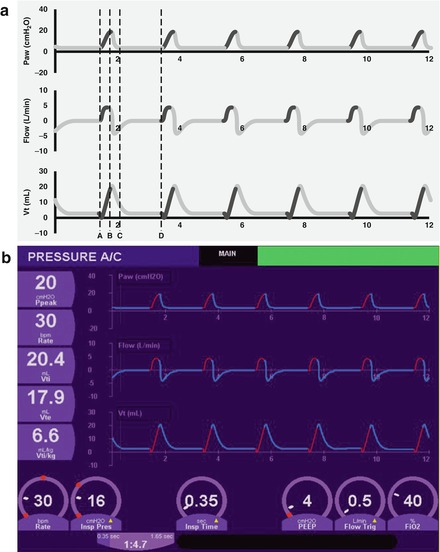
Figure 2.1
Pulmonary waveforms (a, schematic; b, actual). Pressure waveforms are displayed on top, flow waveforms are on the middle panel, and volume waveforms are on the bottom. Point A represents the initiation of inspiration. Point B is peak inspiration. Point C represents the end of inspiration and start of expiration. Point D is the end of expiration
2.2 Volume Waveform
The volume waveform displays the changes in delivered volume over time. It is determined by integrating the inspiratory and expiratory flow signals. A typical volume waveform is shown in Fig. 2.2. As seen in Fig. 2.2a, the waveform has several reference points. Point A depicts the initiation of inspiration. Point B represents the maximum inspired gas volume. Point C represents the end of inspiration and the start of expiration. Point D depicts end-expiration volume and should be very close to the zero volume line; expired volume is usually a bit less than inspired volume because of air leak around the uncuffed neonatal endotracheal tube. An actual volume waveform is shown in Fig. 2.2b.
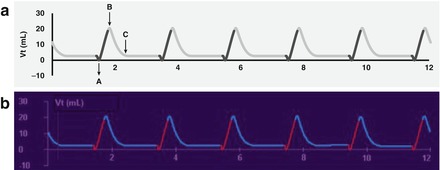
Figure 2.2
Volume waveform (a, schematic; b, actual). Point A is the start of inspiration. Point B represents the maximum inspired gas volume. Point C is the end inspiratory volume
Evaluation of the tidal volume (Vt) waveform may be useful in determining the relative contributions of mechanical and spontaneous breaths during intermittent mandatory or synchronized intermittent mandatory ventilation (SIMV). Figure 2.3 demonstrates this. Note that the larger volume breaths are SIMV, and the smaller breaths, supported only by positive end-expiratory pressure (PEEP), are spontaneous.
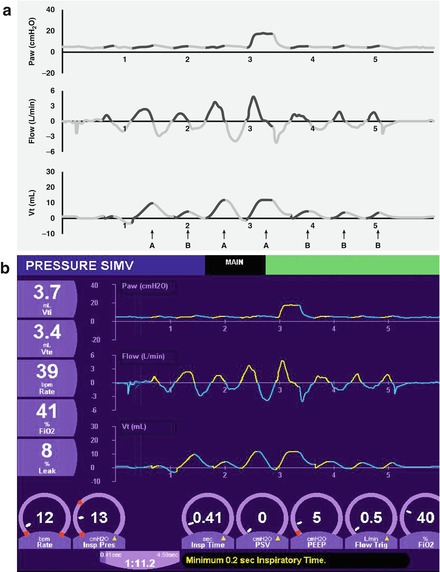
Figure 2.3
Waveforms obtained during SIMV/pressure support ventilation. Note the relative contributions during SIMV (waveforms connoted by A) and partial pressure support (waveforms connoted by B) in schematic (a) and actual (b) waveforms. In this example, since pressure support is set at 0, we see no pressure deflection (since no positive pressure is being added to support spontaneous breaths) but we do see the flow and volume changes initiated by the patient
2.3 Pressure Waveform
The pressure waveform represents the airway pressure throughout the respiratory cycle (Fig. 2.4). Virtually every newborn requiring conventional mechanical ventilation receives some degree of PEEP. Thus, the waveform at end inspiration or the initiation of inspiration is above the baseline (zero) value. Pressure rises during inspiration, reaching its maximum value, or peak inspiratory pressure (PIP), then declines during expiration to the PEEP level. The area under a single cycle represents the mean airway pressure (mean Paw). The difference between the PIP and the PEEP is referred to as the amplitude or delta P. These are shown schematically (Fig. 2.4a) and actually (Fig. 2.4b).
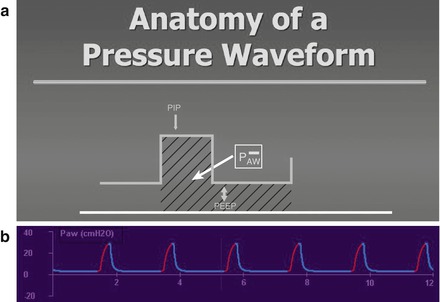
Figure 2.4
Schematic representation of the anatomy of a pressure waveform (a). The amplitude or ΔP is the difference between the peak inspiratory pressure (PIP) and the baseline pressure, referred to as the positive end-expiratory pressure (PEEP). The mean airway pressure is represented by the area under the curve (shaded area) for a single waveform. An actual pressure waveform is depicted in (b)
2.3.1 Plateau Pressure
If an inspiratory hold is used to prolong the inspiratory time (preventing the exhalation valve from opening), a plateau pressure may develop. This is shown in Fig. 2.5. After reaching the PIP, rather than linearly decreasing to the baseline, it remains constant, creating the plateau, until the hold ends and the exhalation valve opens.
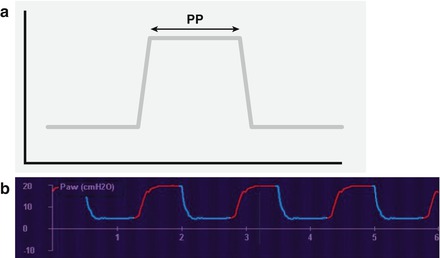
Figure 2.5
Plateau pressure. Prolonging inspiratory time by use of an inspiratory hold produces a pressure plateau (PP), demonstrated schematically (a) and actually (b)
2.3.2 Changes in PIP and PEEP
Changes in either PIP or PEEP will change the shape of the pressure waveform and alter the delivered mean Paw. Figure 2.6 represents the index ventilator settings, where the PIP is 20 cm H2O and the PEEP is 5 cm H2O. Figure 2.7 demonstrates the change when the PIP is increased to 30 cm H2O. If the PEEP remains unchanged, the amplitude will increase by 10 cm H2O.
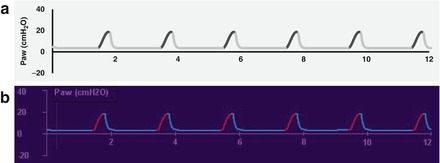
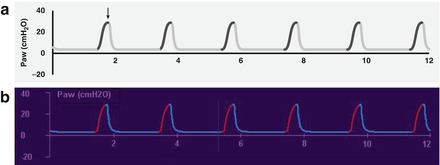
Figure 2.6
Index pressure waveform (a, schematic; b, actual). PIP is 20 cm H2O, PEEP is 5 cm H2O
Figure 2.7
In this pressure waveform (a, schematic; b, actual), the PIP has been increased to 30 cm H2O (arrow)
Changes in PIP without concomitant changes in PEEP will alter the amplitude. Here, our initial settings are again PIP 20 cm H2O and PEEP 5 cm H2O (Fig. 2.6). When the PEEP is increased to 10 cm H2O while the PIP is held constant, note how the baseline rises and the difference from PIP to PEEP decreases (Fig. 2.8).

Figure 2.8
In this example, the PEEP has been increased from 5 to 10 cm H2O (arrow). Note the rise in the baseline and decrease in the amplitude (a, schematic; b, actual)
2.3.3 Change in Inspiratory Time
Increasing the inspiratory time will increase the duration of positive pressure and will lengthen the inspiratory phase of the pressure waveform. If all other parameters are held constant, the mean Paw will increase (the area under the curve enlarges). Figure 2.9 shows changes in the pressure waveform after increasing the inspiratory time from that seen in Fig. 2.6. Note the increased length of the inspiratory phase of the waveform and the increased area under the curve.
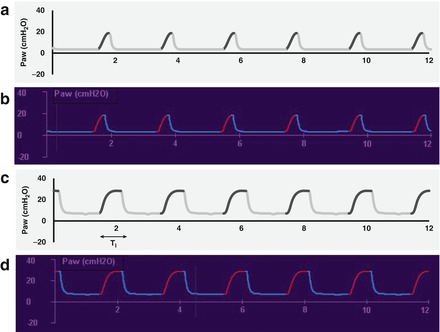
Figure 2.9


Increasing the inspiratory time increases the area under the curve, and hence, the mean airway pressure. The upper waveforms (a, schematic; b, actual) show a PIP of 20, PEEP 5 with a short Ti; the lower waveforms (c, schematic; d, actual) show how a longer Ti changes the inspiratory pressure waveform and increases mean airway pressure
Stay updated, free articles. Join our Telegram channel
Full access? Get Clinical Tree
