Noncalcific attenuated plaques identified by grayscale intravascular ultrasound (IVUS) are often seen in patients with acute coronary syndromes and have been associated with no reflow and creatine kinase-MB elevation after percutaneous coronary intervention. Histopathology has shown cholesterol clefts, microcalcification, or organized thrombus. One hundred twenty-four vessels in 64 patients with acute coronary syndromes from the PROSPECT trial were identified for inclusion in the present analysis. After excluding 4 vessels with severe calcification, 9 vessels with <40% plaque burden, and 3 vessels with too few (<3) virtual histology (VH)–IVUS frames for analysis, complete grayscale IVUS and VH-IVUS was available for 108 vessels in 64 patients that contained 39 VH-IVUS thin-capped fibroatheromas (VH-TCFA), 40 thick-capped fibroatheromas (VH-ThFA), and 33 pathologic intimal thickening but no fibrotic or fibrocalcific plaques. Overall, there were 47 grayscale IVUS attenuated plaques in 43 vessels. Compared to the minimum luminal sites of the remaining 65 vessels (controls), attenuated plaques contained larger necrotic core areas (1.5 ± 0.9 vs 0.9 ± 0.8 mm 2 in controls, p = 0.001). Fibroatheromas (VH-TCFA or VH-ThFA) were more common at the sites of attenuated plaques than at control sites (VH-TCFA 42.5% vs 29.2%, VH-ThFA 53.2% vs 23.1%, pathologic intimal thickening 4.3% vs 47.7%, p <0.0001). In conclusion, grayscale IVUS attenuated plaques are associated with a large amount of VH-IVUS necrotic core and are markers of the presence of fibroatheromas (VH-TCFA or VH-ThFA). This may explain the biologic instability of these lesions.
Noncalcific attenuated plaques seen during grayscale intravascular ultrasound (IVUS) imaging are defined as hypoechoic or mixed atheromas with ultrasound attenuation despite little evidence of calcium. Histopathologic analysis of a small number of attenuated plaques has shown microcalcification, thrombus, or cholesterol crystals. Attenuated plaques are more often seen in patients with acute coronary syndromes than in those with stable angina and are characterized by positive remodeling and nearby calcification. Recent data have indicated that attenuated plaques are associated with no reflow and creatine kinase-MB elevation after percutaneous coronary intervention because of distal embolization. Virtual histology (VH)–IVUS has 94% to 97% ex vivo accuracy when used to identify different atherosclerotic plaque elements. Available data have shown larger VH-IVUS necrotic cores (NCs) in lesions responsible for acute coronary syndromes compared to stable angina, and the presence and sizes of VH-IVUS NCs are related to the liberation of small embolic particles during coronary stenting, especially in patients with acute coronary syndromes. We hypothesized that attenuated plaques contain large amounts of NC that would also explain the unstable nature of such lesions.
Methods
The multicenter, prospective, international Providing Regional Observations to Study Predictors of Events in the Coronary Tree (PROSPECT) trial ( ClinicalTrials.gov identifier NCT00180466 ) was designed to identify imaging and serologic predictors of vulnerable plaque events in patients who underwent percutaneous coronary intervention for acute coronary syndromes. After their culprit lesions were treated, patients underwent 3-vessel grayscale IVUS and VH-IVUS imaging of culprit and nonculprit arteries. The inclusion criteria were (1) acute cardiac pain, or angina equivalent, consistent with unstable angina or myocardial infarction, lasting >10 minutes within the past 72 hours, and (2) the presence of any of the following: elevated enzymes (creatine kinase-MB isoenzyme or troponin I or T) greater than the upper limits of normal; ST depression >1 mm in ≥2 contiguous leads or transient ST elevation >1 mm in ≥2 contiguous leads lasting <30 minutes; ST elevation myocardial infarction with onset >24 hours previously, diagnosed with the typical triad of nitrate-unresponsive chest pain lasting >30 minutes, ST elevation >1 mm in ≥2 contiguous leads, or new left bundle branch block; and increase and decrease of creatine kinase isoenzyme. Risk factors included hypertension (medication dependent or documented history), diabetes (diet controlled, oral agent treated, or insulin treated), or hypercholesterolemia (medication treated or a measurement >200 mg/dl), and cigarette smoking. This study was approved by the institutional review boards of the centers at which the procedures were performed, and written informed consent was obtained from all patients before cardiac catheterization. From this IVUS imaging registry of 697 patients, we randomly selected 124 vessels in 64 patients for inclusion in the present analysis.
A phased-array, 20 MHz, 3.2Fr IVUS catheter (Eagle Eye; Volcano Corporation, Rancho Cordova, California) was placed at the distal coronary artery and pulled back to the aorto-ostial junction using motorized catheter pullback at 0.5 mm/s. During pullback, grayscale IVUS was recorded, raw radiofrequency data were captured at the top of the R wave, and reconstruction of the color-coded map by a VH-IVUS data recorder was performed (In-Vision Gold; Volcano Corporation). The grayscale and radiofrequency data were written onto CD-ROMs or DVDs for off-line analysis. Offline grayscale IVUS and VH-IVUS analysis were performed using (1) QCU-CMS (Medis Medical Imaging Systems, Inc., Leiden, The Netherlands) for contouring, (2) pcVH 2.1 (Volcano Corporation) for contouring and VH data output, and (3) qVH (developed at the Cardiovascular Research Foundation, New York, New York) for segmental qualitative assessment and data output.
We identified nonculprit, untreated lesions having plaque burdens ≥40% of ≥1.5 mm in length (approximately 3 consecutive VH-IVUS frames) and compared coronary arteries with ≥1 untreated attenuated plaque by grayscale IVUS (attenuated plaque group) to coronary arteries without any attenuated plaques (nonattenuated plaque group). The maximum arc of attenuation was measured with an electronic protractor centered on the lumen. The lesion site was the slice with the maximum attenuation arc in the attenuated plaque group, while the lesion site was the slice with the minimal luminal area and ≥40% plaque burden in the nonattenuated plaque group ( Figure 1 ). Attenuated plaques were considered independent if there was a gap >5 mm between them. External elastic membrane (EEM) and luminal borders were contoured for all recorded frames (approximately every 0.5 mm in length depending on the RR interval). Quantitative IVUS measurements included EEM, lumen, and plaque and media cross-sectional area and plaque burden (defined as plaque and media divided by EEM). The proximal and distal reference segments were the most normal looking segments (largest lumen with least plaque) <5 mm proximal and distal to the lesion, but before a major side branch. The remodeling index was the lesion EEM divided by the mean reference EEM. Positive remodeling was defined as a remodeling index >1.05, negative remodeling as a remodeling index <0.95, and intermediate or negative remodeling as a remodeling index of 0.95 to 1.05. Eccentricity was the ratio of maximum to minimum plaque thickness; lesions were characterized as concentric (plaque with a ratio <2), eccentric (ratio ≥2), or eccentric with arc of normal intima (ratio ≥2 and minimum plaque thickness <0.3 mm). Calcification was identified as very bright echoes (brighter than the adventitia) with acoustic shadowing of deeper tissue zones.
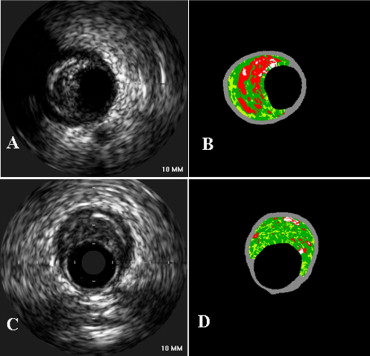
Four VH-IVUS plaque components were color-coded as white (dense calcium), red (NC), light green (fibrofatty), and dark green (fibrotic tissue) and reported as cross-sectional area and percentages of total plaque area. According to the relative amounts of the 4 components, lesions were classified as (1) thin-capped fibroatheroma, (2) thick-capped fibroatheroma, (3) pathologic intimal thickening, (4) fibrotic plaque, or (5) fibrocalcific plaque. Fibroatheroma had >10% confluent NC. The axial resolution of the 20-MHz transducer was approximately 200 μm. Because the pathologic definition of a thin fibrous cap was ≤65 μm (below the resolution of the IVUS catheter), if >30° of the NC abutted to the lumen in 3 consecutive frames, the fibroatheroma was classified as a VH-IVUS thin-capped fibro atheroma; otherwise, it was categorized as thick-capped fibroatheroma. Fibrotic plaque was defined as mainly fibrous plaque (<10% of confluent NC, <10% of confluent dense calcium, <15% of fibrofatty plaque), and fibrocalcific plaque was defined as mainly fibrous plaque with >10% confluent dense calcium and <10% of confluent NC. All other plaques were categorized as pathologic intimal thickening having a mixture of all plaque components, but dominantly fibrofatty plaque with <10% of confluent NC and <10% of confluent dense calcium. Qualitative and quantitative IVUS analyses were performed by 2 independent, experienced observers (XW and AM), and the consensus interpretation was included in the subsequent analysis.
Statistical analysis was performed using SPSS version 15.0 (SPSS, Inc., Chicago, Illinois). Continuous variables (expressed as mean ± SD) were compared using unpaired Student’s t test. Categorical variables (expressed as frequencies) were compared using chi-square statistics or Fisher’s exact probability test. Linear regression analysis was performed to evaluate the correlation between NC area and morphometric parameters. A p value <0.05 was considered statistically significant. Intraobserver and interobserver variability for lesion type classifications were assessed by the κ test of concordance.
Results
After excluding 4 vessels with severe calcification, 9 vessels with <40% plaque burden, and 3 vessels with too few (<3) VH-IVUS frames correlated to the grayscale IVUS attenuated plaque for analysis, complete grayscale IVUS and VH-IVUS images were available for 108 vessels of 64 patients. We analyzed all nonstented segments in these 108 vessels and identified 47 attenuated plaques (in 43 vessels of 34 patients) and 65 nonattenuated plaques (in 65 remaining vessels of 30 patients, the control group). Baseline patient characteristics are listed in Table 1 .
| Variable | Value |
|---|---|
| Men | 52 (81%) |
| Age (years) | 59 ± 12 |
| Unstable angina pectoris | 1 (1.6%) |
| Non–ST elevation myocardial infarction | 47 (73%) |
| ST elevation myocardial infarction (>24 h) | 16 (25%) |
| Hypertension ⁎ | 42 (66%) |
| Hypercholesterolemia † | 43 (67%) |
| Previous myocardial infarction | 3 (5%) |
| Diabetes mellitus | 11 (17%) |
| Current smoker | 29 (45%) |
⁎ Systolic blood pressure ≥140 mm Hg, diastolic blood pressure ≥90 mm Hg, or use of an antihypertensive drug.
Attenuated plaque was present in 47 lesions (42.0%) in 43 vessels (39.8%) of 34 patients (53.1%): 7 of 16 patients (43.8%) with ST elevation myocardial infarctions and 27 of 48 patients (56.3%) with non–ST elevation myocardial infarctions. Overall, 22 patients had 1 attenuated plaque, 11 patients had 2 attenuated plaques, and 1 patient had 3 attenuated plaques. The average number of attenuated plaques was 0.4 ± 0.5 per vessel; 39 vessels had 1 and 4 vessels had 2 attenuated plaques. Vessels studied were 42 (38.9%) left anterior descending, 36 (33.3%) left circumflex, and 30 (27.8%) right coronary arteries; there were 43 culprit vessels and 65 nonculprit vessels. There was no difference in the incidence of attenuated plaques comparing culprit lesion–containing versus nonculprit vessels (34.0% vs 47.7%, p = 0.15) and among the left anterior descending, left circumflex, and right coronary arteries (46.5% vs 35.1% vs 43.8%, p = 0.6). Attenuated plaques were predominately located in proximal portions of coronary arteries within 40 mm of the ostium in 83% (39 of 47; Figure 2 ). Among culprit vessels, 13 attenuated plaques (81.3%) were proximal to the acutely implanted stent (an average of 20.5 ± 16.6 mm proximal to the stent edge). Among nonculprit vessels, only 9 attenuated plaques (29%) were located at the minimum luminal site.
Grayscale IVUS findings are listed in Table 2 . There were no differences in lesion site lumen, EEM, and plaque and media cross-sectional area and plaque burden between attenuated and nonattenuated plaques. Positive remodeling was more frequent in attenuated versus nonattenuated plaques (50% vs 17.1%, p = 0.003). All attenuated plaques were eccentric, and eccentric plaques with an arc of normal intima were more common in the attenuated versus the nonattenuated plaque group (72.3% vs 44.6%, p = 0.012).
| Variable | Attenuated Plaque (n = 47) | Nonattenuated Plaque (n = 65) | p Value |
|---|---|---|---|
| Lesion | |||
| EEM CSA (mm 2 ) | 17 ± 5.7 | 15 ± 4.6 | 0.12 |
| Luminal CSA (mm 2 ) | 7.0 ± 3.9 | 5.6 ± 1.8 | 0.08 |
| P&M CSA (mm 2 ) | 9.5 ± 3.1 | 9.0 ± 3.5 | 0.53 |
| Plaque burden (%) | 59 ± 11 | 61 ± 8.1 | 0.41 |
| Eccentricity index | 9.0 ± 8.7 | 5.9 ± 3.4 | 0.02 |
| Positive remodeling (%) | 50% | 17% | <0.005 |
| Proximal reference segment | |||
| EEM CSA (mm 2 ) | 17 ± 5.8 | 15 ± 5.1 | 0.33 |
| Luminal CSA (mm 2 ) | 8.8 ± 4.8 | 8.1 ± 2.4 | 0.46 |
| P&M CSA (mm 2 ) | 7.7 ± 2.9 | 7.1 ± 3.7 | 0.50 |
| Plaque burden (%) | 48 ± 14 | 45 ± 12 | 0.39 |
| Distal reference segment | |||
| EEM CSA (mm 2 ) | 16 ± 5.7 | 14 ± 4.5 | 0.12 |
| Luminal CSA (mm 2 ) | 8.1 ± 3.7 | 7.5 ± 2.1 | 0.39 |
| P&M CSA (mm 2 ) | 8.2 ± 2.7 | 6.9 ± 3.6 | 0.13 |
| Plaque burden (%) | 50 ± 12 | 46 ± 13 | 0.21 |
Stay updated, free articles. Join our Telegram channel

Full access? Get Clinical Tree


