6 Ventricular Function
Overview
Left Ventricular Systolic Function
Background
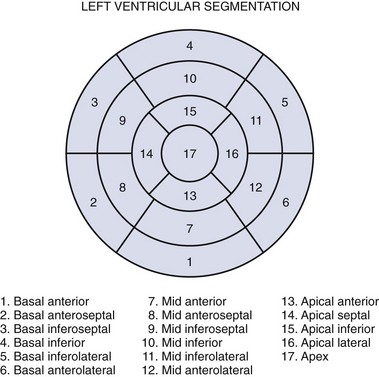
Coronary Anatomy and Left Ventricular Wall Segmentation
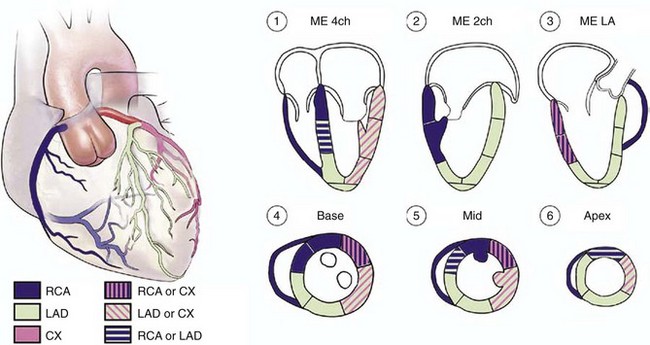
Figure 6-1 Typical distributions of the RCA, the LAD, and the LCX coronary arteries.
Modified with permission from Lang RM, Bierig M, Devereux RB, et al; Chamber Quantification Writing Group; American Society of Echocardiography’s Guidelines and Standards Committee; European Association of Echocardiography. Recommendations for chamber quantification: A report from the American Society of Echocardiography’s Guidelines and Standards Committee and the Chamber Quantification Writing Group, developed in conjunction with the European Association of Echocardiography, a branch of the European Society of Cardiology. J Am Soc Echocardiogr. 2005;18:1440-1463.
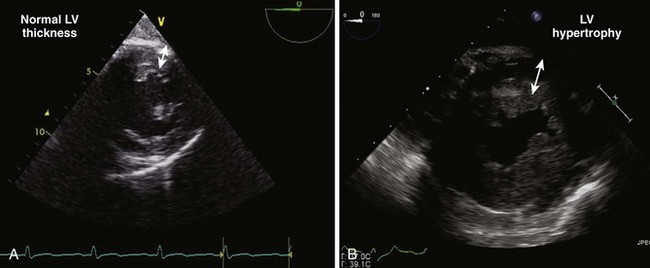
Left Ventricular Anatomy: Wall Thickness and Size
Left Ventricular Ejection Fraction
Pathophysiology
Left Ventricular Hypertrophy
Cardiomyopathies
Overview of Echocardiographic Approach
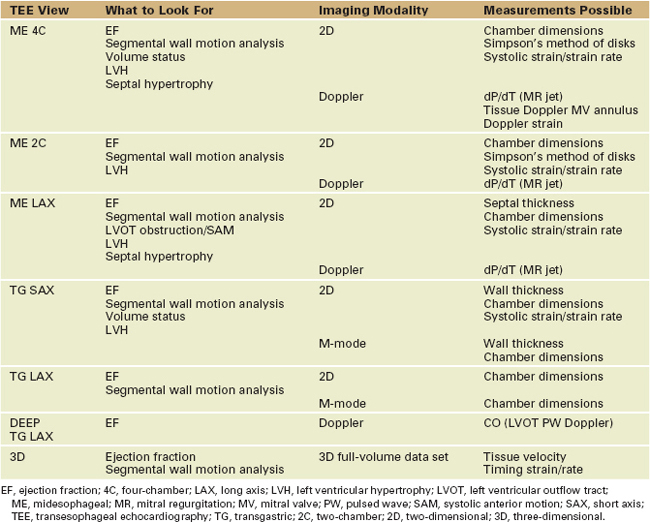
Table 6-1 presents an evaluation of LV systolic function.
Anatomic Imaging
Acquisition
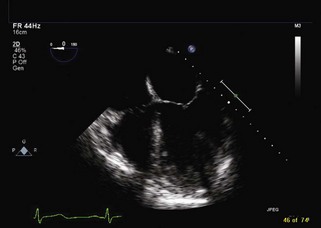
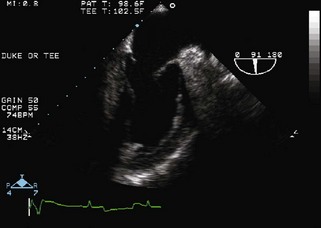
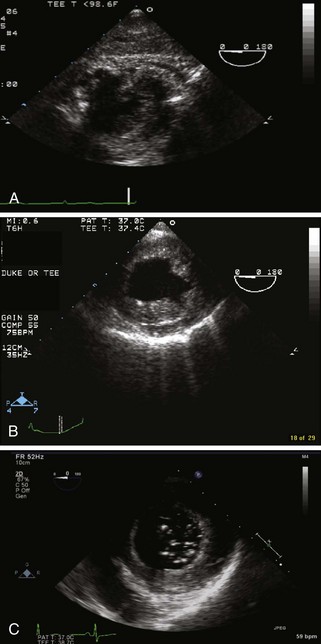
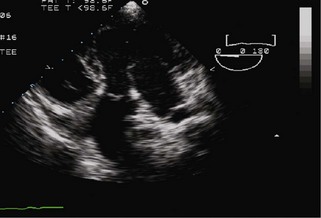
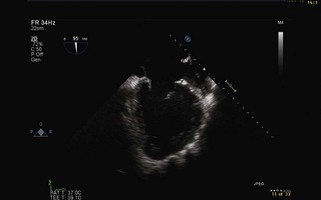
Figure 6-12 Deep TG LAX view of the LV with the scan angle at 0 degrees and the probe tip anteflexed.
Analysis
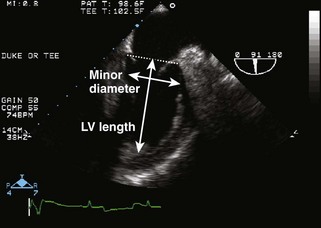
Ejection Fraction Linear Measurement

Ejection Fraction Area Measurement
Ejection Fraction Volumetric Measurements
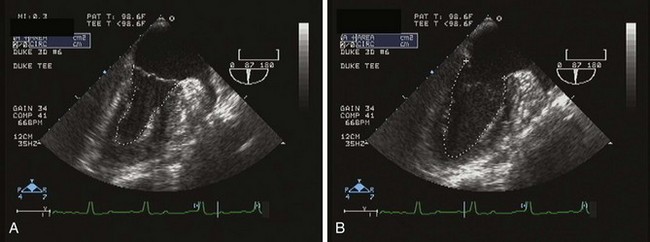
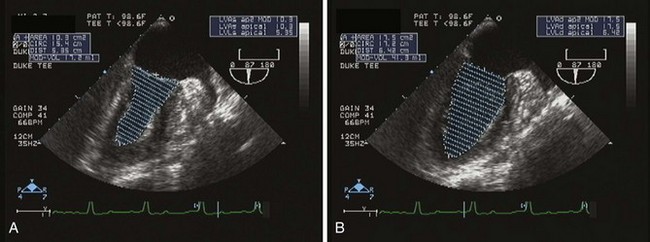
Figure 6-16 ME 2C view of the LV with the endocardial border traced during systole (A) and diastole (B).
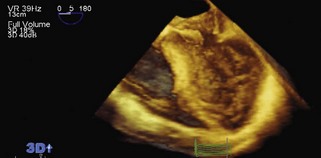
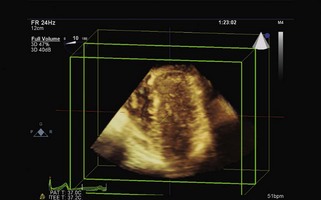
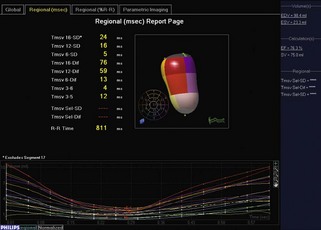
Ejection Fraction Three-Dimensional Measurement
Key Points Pitfalls
Physiologic Data
Acquisition
Analysis
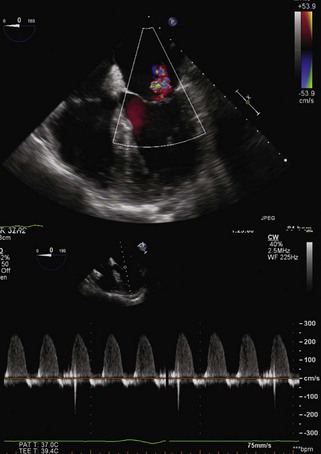
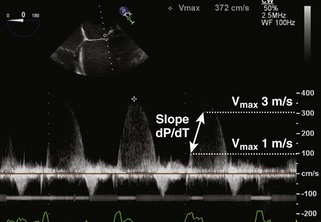
Rate of Rise in Left Ventricle Pressure (dP/dT)
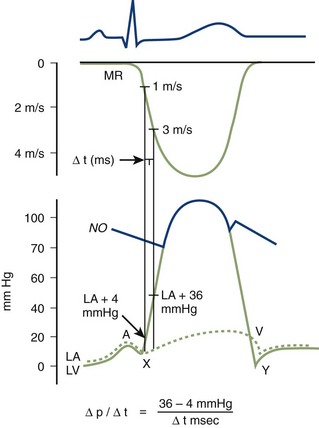
Figure 6-23 Pressure tracing diagram.
From Pai RG, Bansal RC, Shah PM. Doppler-derived rate of left ventricular pressure rise. Its correlation with the postoperative left ventricular function in mitral regurgitation. Circulation. 1990;82:514-520.

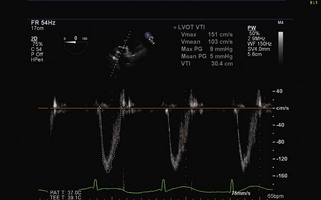
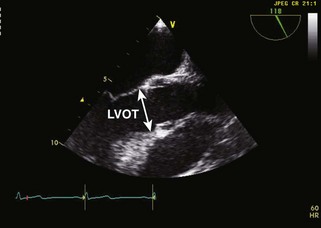
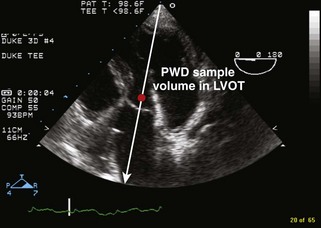
Cardiac Output


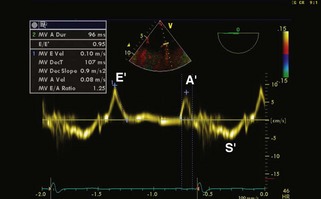
Tissue Doppler Imaging of the Mitral Annulus
Strain/Strain Rate and Speckle Tracking
Key Points Pitfalls
Alternate Approaches—When Transesophageal Echocardiography Is Insufficient
Key Points
Stay updated, free articles. Join our Telegram channel

Full access? Get Clinical Tree


