Valvular Heart Disease
Jan Bogaert
Andrew M. Taylor
INTRODUCTION
Although the incidence of valvular heart disease (VHD) in the developed countries is relatively low compared with the incidence of ischemic heart disease, it continues to cause considerable morbidity and mortality, and in many patients surgical valve repair or replacement will be indicated (1). The diagnosis of VHD is usually based on the patients’ symptoms (e.g., dyspnea on exertion, exertional syncope, angina, shortness of breath, palpitations, fatigue, heart failure) and abnormal cardiac auscultation (e.g., diastolic or systolic murmur). The role of additional imaging procedures, usually echocardiography with Doppler flow measurements and less frequently cardiac catheterization, is to assess the severity of VHD and to evaluate its impact on cardiac function. Cardiac imaging is also indicated to monitor the disease progress and to help in determining the optimal timing for surgical intervention. In contrast with other cardiac diseases, such as assessment of myocardial infarction and viability, where magnetic resonance imaging (MRI) can be considered as the reference technique, the role of MRI in assessing patients with VHD is currently not well established. This is in part due to the availability of a good and well-accepted, noninvasive first-line imaging modality, that is, echocardiography. Moreover, clinicians are still unaware of the potential clinical applications of MRI for assessing cardiac diseases (2,3). In this chapter, we focus on the different approaches to study VHD with MRI in the clinical setting.
MRI STRATEGIES TO EVALUATE VALVULAR HEART DISEASE
The heart has two atrioventricular and two ventriculoarterial valves which guarantee a correct, unidirectional flow of blood through the heart. This is achieved by alternated phases of valve opening and valve closure. Normal valves are not flow-restrictive when opened and prevent backflow of blood when closed. A small, physiologic regurgitation, however, may be present in healthy subjects (usually the tricuspid and pulmonary valve, less frequently the mitral valve). In the diseased state, the valve orifice may become narrowed, leading to an obstruction of the blood flow (valvular stenosis), and/or the valve leaflets may not completely coapt leading to a pathologic regurgitation of blood into the proximal chamber (valvular regurgitation). Valvular stenosis/regurgitation may be caused by diseases directly affecting the valves (e.g., endocarditis, degenerative disease) or indirectly by adjacent pathology or pathology at a distance (e.g., dilated cardiomyopathy, papillary muscle infarction, Marfan’s disease). Valve lesions lead to acute/chronic alterations in preload and/or afterload, with remodeling of the involved cardiac chamber. When these initially compensatory responses, that are meant to preserve normal cardiac function, are severe and/or longstanding, the compensatory phenomena may fail and lead to a state of cardiac decompensation.
The role of imaging in patients with suspected VHD is to obtain information on the following issues: (a) Definition of valvular anatomy—number of valve leaflets, leaflet thickness, presence of infective endocarditis; (b) assessment of valvular function—degree of valvular stenosis or
regurgitation; (c) definition of the consequences of valvular dysfunction on ventricular/atrial size, function and mass, and pulmonary artery pressure; (d) assessment of associated morphologic abnormalities—great vessel anatomy or thrombus formation; and (e) exclusion of non-VHD-related cardiac pathology—coronary artery disease and/or prior myocardial infarction. Much of the above required information can be obtained with a single investigation that is safe, noninvasive and without exposure to x-rays: Cardiovascular MRI (2,3).
regurgitation; (c) definition of the consequences of valvular dysfunction on ventricular/atrial size, function and mass, and pulmonary artery pressure; (d) assessment of associated morphologic abnormalities—great vessel anatomy or thrombus formation; and (e) exclusion of non-VHD-related cardiac pathology—coronary artery disease and/or prior myocardial infarction. Much of the above required information can be obtained with a single investigation that is safe, noninvasive and without exposure to x-rays: Cardiovascular MRI (2,3).
VALVULAR MORPHOLOGY
Although fast spin-echo MRI techniques with dark blood prepulses provide high-quality morphologic images of the heart, they are seldom of diagnostic quality to evaluate the valvular anatomy (4). This is mainly related to the lack of contrast between the low-proton density of valve leaflets and the surrounding dark blood (Fig. 14.1). With bright blood MRI, using either the spoiled gradient-echo (GE) or balanced
steady-state free precession (b-SSFP) techniques, valve leaflets are visible as low-signal intensity structures surrounded by the bright blood (Fig. 14.1). Moreover, their depiction is greatly enhanced by using the cine-viewing mode, allowing for better visualization of the number of valve leaflets, leaflet morphology and integrity, as well as leaflet mobility and motion. On the new b-SSFP techniques, combining a good spatial with an excellent contrast resolution, the subvalvular apparatus (e.g., tendinous chords) of the atrioventricular valves and papillary muscles are well depicted (Fig. 14.1). Although echocardiography remains the investigation of choice for imaging valve leaflet anatomy, MRI can be helpful for unraveling valvular anatomy in patients with poor subjects for echocardiography, for example, due to heavily calcified mitral valve ring or aortic valvular calcifications. The best imaging planes are a combination of longitudinal and perpendicular views through the diseased valve(s). It should be emphasized that in patients with endocarditis, echocardiography is superior to MRI in detecting valvular vegetations because of its real-time imaging features, while for endocarditis-related complications, such as abscess or pseudoaneurysm formation, MRI is often complementary to echocardiography (Fig. 14.2).
steady-state free precession (b-SSFP) techniques, valve leaflets are visible as low-signal intensity structures surrounded by the bright blood (Fig. 14.1). Moreover, their depiction is greatly enhanced by using the cine-viewing mode, allowing for better visualization of the number of valve leaflets, leaflet morphology and integrity, as well as leaflet mobility and motion. On the new b-SSFP techniques, combining a good spatial with an excellent contrast resolution, the subvalvular apparatus (e.g., tendinous chords) of the atrioventricular valves and papillary muscles are well depicted (Fig. 14.1). Although echocardiography remains the investigation of choice for imaging valve leaflet anatomy, MRI can be helpful for unraveling valvular anatomy in patients with poor subjects for echocardiography, for example, due to heavily calcified mitral valve ring or aortic valvular calcifications. The best imaging planes are a combination of longitudinal and perpendicular views through the diseased valve(s). It should be emphasized that in patients with endocarditis, echocardiography is superior to MRI in detecting valvular vegetations because of its real-time imaging features, while for endocarditis-related complications, such as abscess or pseudoaneurysm formation, MRI is often complementary to echocardiography (Fig. 14.2).
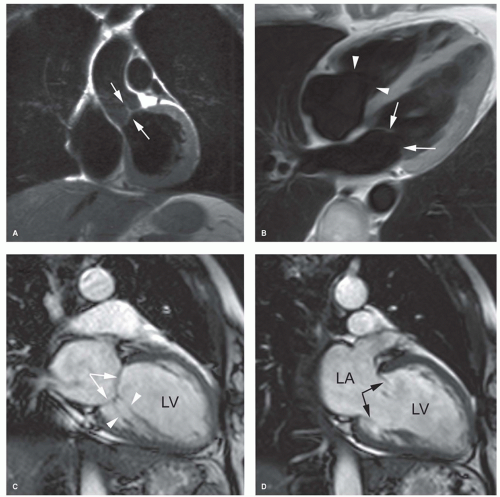 Figure 14.1. Valvular morphology on dark blood (A,B) and bright blood MRI (C,D). A: Coronal fast spin-echo MRI of the aortic valve (arrows). B: Fast spin-echo MRI of the mitral (arrows) and tricuspid valve (arrowheads) in the horizontal long-axis plane. The valve leaflets appear as low-signal intensity structures surrounded by the dark blood. Vertical long-axis bright blood MRI using the balanced-SSFP technique at endsystole (C) and during early ventricular filling (D). The leaflets of the mitral valve (arrows) and the tendinous chords (arrowheads) are well visible. Also the mobility of the leaflets (black arrows) can be well appreciated. LA, left atrium; LV, left ventricle. |
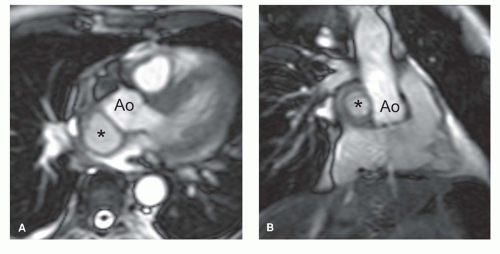 Figure 14.2. Pseudoaneurysm formation in a 56-year-old patient with renal transplant and history of endocarditis. Balanced-SSFP cine MRI in axial plane (A) and vertical long-axis through aortic root (B). The infectious pseudoaneurysm is visible as a welldefined hyperintense structure (asterisk) behind the aortic root (Ao). MRI is indicated to detect and follow up the formation of these pseudoaneurysms in patients with endocarditis. |
VALVULAR REGURGITATION
Whereas conventional imaging techniques (i.e., echocardiography and cardiac catheterization) use a semi-quantitative approach to grade the severity of valvular regurgitation, MRI in contrast enables true quantitative assessment (2,3). This technique can image the regurgitant jet in any plane, and thus provide a three-dimensional (3D) appreciation of the regurgitant jet. Besides, MRI can quantify blood flow and thus provide accurate information on the regurgitant volume, either as an absolute value or as a regurgitant fraction. This information in combination with global ventricular function is of particular clinical relevance for the timing of valve replacement. The following techniques can be applied to evaluate the severity of valvular regurgitation:
Qualitative assessment of signal loss on cine MRI
Quantitative assessment by velocity mapping
Quantitative assessment of ventricular volumes, function, and mass
Qualitative Assessment of Signal Loss with Cine MRI
The bright blood phenomenon on spoiled GE cine MRI techniques is based on the laminar inflow of fully magnetized spins. Intravoxel dephasing of the proton spins, due to flow disturbance (turbulence, acceleration) leads to loss in signal. This principle can be applied to assess valvular regurgitation. Imaging over multiple frames throughout the cardiac cycle enables visual assessment of flow disturbance caused by the regurgitation. Depending on the severity a dark signal is visible extending from the diseased valve into the receiving chamber, either pencil-beam-like or fan-like, during a variable time period of the cardiac cycle (Fig. 14.3). Using a combination of contiguous cine MRI slices, the direction of the regurgitant jet can be well visualized. Because of the continuously changing loading conditions, the jet direction may vary over time (Fig. 14.4). Similar to cardiac catheterization and cardiac ultrasound, the extent of signal loss in the receiving chamber can be used to grade the severity of regurgitation. This semi-quantitative approach, however, suffers from similar shortcomings as the approach used by the other conventional imaging techniques. The signal loss is highly dependent on the imaging parameters (e.g., echo time), and several studies have shown poor reproducibility of the technique between centers (5,6). The severity is underestimated when the jet impinges on the cardiac chamber wall, and this method is unable to separate turbulent volumes when dual-valve disease exists. Nevertheless, cine MRI remains an interesting approach to rapidly evaluate the presence or absence of valvular regurgitation. In case of valve regurgitation, other MRI techniques can be applied to quantify the valvular regurgitation severity. The new standard bright blood sequence that is now used to study cardiac function, that is, b-SSFP technique, is designed to be relatively flow-insensitive, yielding a better endocardial/blood pool definition than spoiled GE techniques. As a consequence, however, this results in reduced visualization of flow disturbance secondary to valvular regurgitation. In particular, mild regurgitation may not be seen, or less apparent on b-SSFP cine imaging. Krombach et al. found a good correlation between b-SSFP cine imaging and color Doppler and cardiac catheterization in patients with known valvular dysfunction (7). Although the jet phenomenon was slightly
more pronounced on spoiled GE cine MRI, the b-SSFP cine technique resulted in a significantly better image quality.
more pronounced on spoiled GE cine MRI, the b-SSFP cine technique resulted in a significantly better image quality.
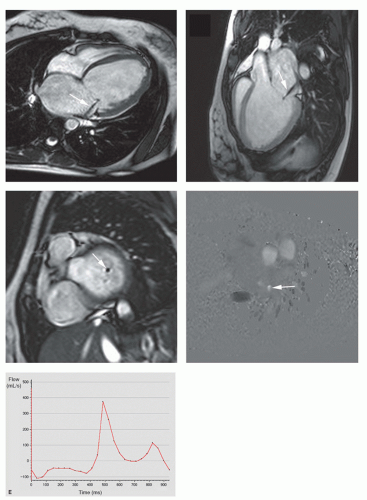 Figure 14.3. Mitral regurgitation in a 15-year-old female patient with severely dilated cardiomyopathy. Balanced-SSFP cine MRI in horizontal long-axis (A), three-chamber view (B), basal short-axis view (C), and velocity-mapping (phase images) (D) with flow volume versus time curve (E). During cardiac systole presence of a regurgitant jet through mitral valve (arrow, A,B,C). The direction of the jet is excentrically located abutting the lateral left atrial wall. Velocity mapping (systolic phase) shows white regurgitant jet (arrow, D). The corresponding flow volume versus time curve shows regurgitant volume of 14 mL (corresponding to a regurgitant fraction of 33%). Quantitative assessment of LV and RV shows an end-diastolic volume of 236 mL and 83 mL and an ejection fraction of 24% and 37% for left and right ventricle, respectively. |
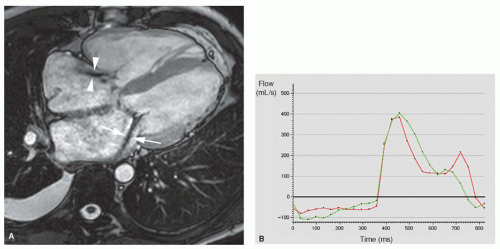 Figure 14.4. Mixed tricuspid and bicuspid valve regurgitation in a 43-year-old man with surgically corrected tetralogy of Fallot and recent history of inferior myocardial infarction, presenting with cardiac decompensation. Balanced-SSFP cine MRI in horizontal long-axis, midsystolic time frame (A), and flow volume versus time curve of mitral (red) and tricuspid (green) valve flow (B). Presence of excentrically (i.e., laterally) located tricuspid (arrowheads, A) and mitral (arrows, A) regurgitation. Velocity mapping (B) shows important (systolic) regurgitation through mitral and tricuspid valve. Quantitative assessment of LV and RV shows an end-diastolic volume of 280 mL and 279 mL and an ejection fraction of 32% and 33% for left and right ventricle, respectively. |
Quantitative Assessment by Velocity Mapping
Noninvasive quantification of blood flow can be achieved with velocity mapping (also called velocity-encoded MRI or phase-contrast velocity mapping). For an extensive description of the velocity mapping technique, we refer to Chapter 5 on MR blood flow measurements. In brief, spins moving along a magnetic field gradient are exposed to a different magnetic field than the stationary, nonmoving spins. As a result, these moving spins experience a different degree of dephasing than stationary spins, which is proportional to the distance they move in time (and thus the velocity). This phenomenon can be exploited to measure flow velocities and to extract flow volumes that pass through valves. Velocity mapping can be applied in any direction, though for flow quantification of valvular lesions, through-plane imaging is used. Stationary spins are depicted as midgray, while increasing velocities in either direction are shown in increasing grades of white or black (Fig. 14.5). Precise determination of the velocity window as close as possible to the expected peak velocity is important to avoid aliasing while maintaining the highest sensitivity for flow measurements. Measurement of the velocity of all pixels in a region of interest enables calculation of the instantaneous flow volume at any point of the cardiac cycle (Fig. 14.5). Integrating the instantaneous flow volumes for all frames throughout the cardiac cycle enables calculation of the flow volume per heartbeat. Velocity mapping has been well validated in vitro and in vivo and can be considered the best available in vivo technique for flow measurements (8,9). In normal individuals, the output of the left ventricle (LV) and the right ventricle (RV) obtained by quantification of the through-plane flow in the proximal ascending aorta and pulmonary trunk has a 1:1 ratio. Differences in ratio can be caused by left-toright or right-to-left shunt or by valvular dysfunction.
To obtain reliable measurements of flow velocities and volumes through valves with velocity mapping, several technical issues need to be addressed. To improve the accuracy of measurements, it can be necessary to perform a baseline correction using a stationary phantom (10,11). To keep phase errors induced by eddy currents and Maxwell terms as low as possible, the area of interest should be as close to the center of the main magnetic field (B0) as possible. The imaging plane should be perpendicular to the valve. This ensures that the velocity vectors of most voxels are perpendicular to the imaging plane. This can be achieved by a thorough knowledge of cardiac anatomy and cardiac image-plane positioning. The best position for flow measurements is not exactly at the level of the valve, but just proximal or distal to the valve annulus. Correction for motion of the valve annulus through the imaging plane during the cardiac cycle can be obtained with slice-tracking technique (12). This promising technique is, however, not yet available for clinical use.
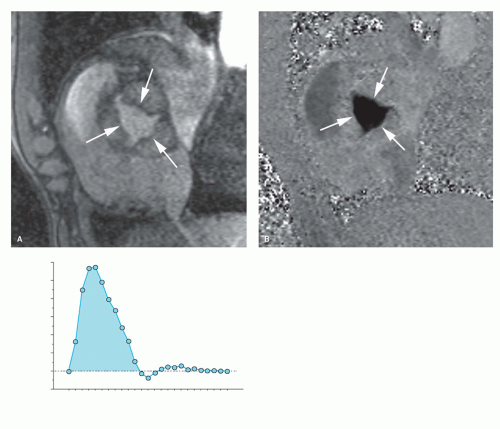 Figure 14.5. Quantitative through-plane flow assessment of the aortic valve using the velocity mapping technique. Magnitude image (A), phase image (B), and corresponding flow volume versus time map (C). The three leaflets of the aortic valve in opened position are well visible on the magnitude image (arrows, A). Forward flow through the aortic valve is shown as dark signal on the phase image (arrows, B) while stationary spins have a midgray signal intensity. Presence of regurgitant or backward flow through the aortic valve would be visible on velocity mapping as white signal. Delineation of the aortic valve orifice of all images obtained during the entire cardiac cycle yields the flow volume versus time map. Forward flow through the aortic valve is shown by positive values whilst retrograde flow has negative values. The surface under the curve yields the flow volumes and enables to calculate ventricular stroke volumes (shaded surface). |
Quantitative Assessment of Ventricular Volumes, Function, and Mass
Cardiac MRI is currently considered the reference technique for in vivo measurement of ventricular volumes and myocardial mass. For this task, breath-hold cine MRI, using the b-SSFP sequence, is used. Based on the volumetric approach (Simpson’s rule), a set of cardiac short-axis cuts covering the length of the ventricles enables to determine ventricular volumes and myocardial mass (see Chapter 6). In normal conditions, there is a 1:1 relationship between LV and RV stroke volumes. In the absence of a cardiac shunt, any discrepancy between stroke volumes in a patient with regurgitation will identify the regurgitant volume. Unfortunately, only patients with a single regurgitant valve can be assessed. However, combination of velocity mapping with ventricular stroke volume measurements allows for the assessment and quantification of multivalvular disease. Moreover, wine MRI allows for an excellent appreciation of the consequences of volume overload on ventricular/atrial remodeling.
VALVULAR STENOSIS
Exact determination of the stenotic valve area and transvalvular gradient is crucial in assessing patients with valvular stenosis. Although this is usually achieved by echo Doppler and cardiac catheterization, MRI is capable of assessing valvular stenosis. Different strategies are currently available. The presence of valvular stenosis can be indirectly identified by the presence of postvalvular signal loss on cine MR images. The orifice area can be measured on perpendicular views through the stenotic valve. Velocity mapping may be used to establish an accurate peak velocity across the valve to quantify the severity of the stenosis, while b-SSFP cine MRI enables determination of the impact of valve stenosis on ventricular volumes, function, and mass.
Visual Assessment of Valve Stenosis on Cine MRI
Use of signal loss extending from a stenotic valve into the distal chamber or vessel is helpful for identification of a
stenotic valve (Fig. 14.6). The degree of signal loss, however, is not only dependent on the degree of stenosis but also on the echo time used. For shorter echo times, less spin dephasing occurs. Kilner et al. have shown that in more severe stenoses shorter echo times need to be used to prevent signal loss in the images (13). Similar as for the qualitative assessment of valvular regurgitation, signal loss is less marked on the b-SSFP cine MR images, and therefore it is more difficult to get a feel for the peak velocity with b-SSFP sequences than with conventional spoiled GE cine imaging.
stenotic valve (Fig. 14.6). The degree of signal loss, however, is not only dependent on the degree of stenosis but also on the echo time used. For shorter echo times, less spin dephasing occurs. Kilner et al. have shown that in more severe stenoses shorter echo times need to be used to prevent signal loss in the images (13). Similar as for the qualitative assessment of valvular regurgitation, signal loss is less marked on the b-SSFP cine MR images, and therefore it is more difficult to get a feel for the peak velocity with b-SSFP sequences than with conventional spoiled GE cine imaging.
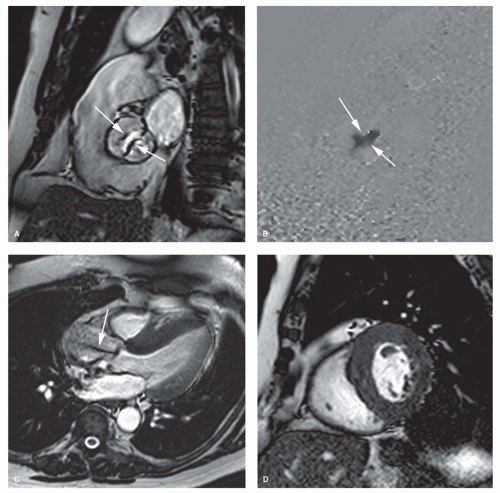 Figure 14.6. Comprehensive MR imaging in aortic stenosis. A 71-year-old man known with stenotic bicuspid aortic valve. Cine imaging (A) and velocity mapping (B) perpendicular through aortic valve. Cine imaging in three-chamber view (C). Cine imaging in short-axis (D) and longitudinally through ascending aorta (E). Contrast-enhanced 3D MR angiography of thoracic aorta (F). The presence of a bicuspid aortic valve can be well appreciated on cine imaging and velocity mapping perpendicular through the aortic valve (arrows, A,B). The aortic valve orifice measures 1.2 cm2 (direct planimetry) with a maximal flow velocity of 3.2 m/s yielding a transvalvular gradient of 41 mm Hg. The flow acceleration with a postvalvular jet can be well seen on the three-chamber view (arrow, C). Compensatory concentric LV hypertrophy with maximal septal thickness 18 mm (D). Dilatation of the ascending aorta to 55 mm (E,F). |
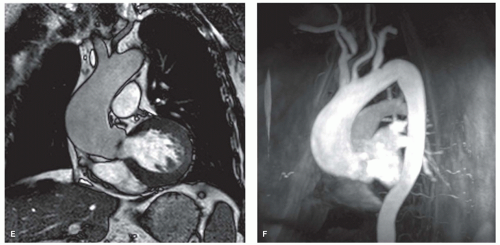 Figure 14.6. (continued) |
Valve Area Quantification
Valve area or valve orifice can be estimated indirectly using the peak systolic transvalvular gradient (cardiac catheterization) and the continuity equation (echo Doppler), or can be calculated by direct planimetry (transesophageal echocardiography and MRI). MR images perpendicular through the stenotic valve, during maximal opening, allows a planimetric quantification of the valve orifice (14,15). It is currently unclear whether b-SSFP sequences with short echo times are better than the conventional spoiled GE techniques to obtain reliable estimates of the valve stenosis (16). While spoiled GE cine MRI, especially when using longer echo times, is sensitive to spin-dephasing artifacts, the b-SSFP technique may have different sources of artifacts, including sensitivity to areas of magnetic field disturbance (e.g., calcifications, tissue interfaces) and sometimes severe artifacts in areas of highly complex flow (16). Using data from velocity-encoded flow curves, the continuity equation (similar as used in echo Doppler) can be used to calculate valve area (17) (see Aortic Valve).
Quantitative Evaluation with Velocity-encoded Cine MRI
Information from the phase-contrast velocity map, that is, peak velocity across the valve, can be used to obtain an estimate of the gradient across the valve, using the modified Bernoulli equation:
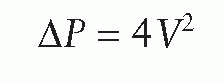
where P is the pressure drop across the stenosis (in millimeters of mercury) and V is velocity (m/s). The technique is comparable with Doppler echo measurements and has an in vitro accuracy of 4% (18). The main advantage of the technique over cardiac ultrasound is that the velocity jet can be aligned easily in any direction without the limitation of acoustic windows or the interference of (peri)valvular calcifications.
The flow through a stenotic valve can be imaged inplane (velocity jet parallel to the imaging plane) or throughplane (velocity jet perpendicular to the imaging plane). The in-plane method visualizes the entire jet and shows the point within the jet of peak velocity. However, peak velocity may not always be accurately depicted, for instance, when the jet is not aligned in a single two-dimensional (2D) plane, or in case of tight narrow jets there may be partial volume averaging and motion within the imaging slice. For throughplane motion, the jet will always pass through the imaging plane, but, as only part of the stenotic jet is sampled, the peak velocity may not be measured. Since both strategies have advantages and disadvantages, it is the best to use a combination of the two strategies with initial definition of the jet in-plane and quantification with through-plane imaging at the site of maximum velocity on the in-plane image.
Use of an appropriate velocity window is essential to maintain sensitivity and accuracy of measurements, while avoiding aliasing. Thus, the velocity window should be adapted to the expected peak velocity within the vessel or the valve of interest. Practically, always check the phase images and repeat the sequence with an adapted velocity window if aliasing is present.
ASSOCIATED FINDINGS IN VHD
It is important to identify the presence of associated findings in patients with VHD. The presence of VHD will have an immediate impact on the loading conditions of the ventricle, eventually leading to a geometric ventricular remodeling with morphologic changes (cavity diameter, wall thickness, and myocardial tissue characteristics) and functional changes (systolic, diastolic (dys) functions). It is commonly accepted that MRI is more accurate than echocardiography in describing this remodeling process (19). Myocardial tagging can be applied noninvasively to study abnormal myocardial deformation patterns in patients with VHD (20,21).
A reversed remodeling is found early after valve replacement (19,22). Assessment of the inflow patterns through the atrioventricular valves or flow patterns in the pulmonary and systemic veins with velocity mapping can be used to assess diastolic function, while contrast-enhanced inversionrecovery MRI with late or delayed imaging (i.e., late gadolinium enhancement [LGE] MRI) is able to depict abnormal areas of focal (hyper)-enhancement reflecting areas of macroscopic fibrosis or microinfarction in patients with longstanding aortic stenosis (AS).
In the presence of mitral stenosis or VHD with atrial fibrillation, thrombus formation in the atria or atrial appendages needs to be ruled out. A combination of cine MRI sequences (preferably the b-SSFP technique) and LGE MRI is likely the best strategy to depict abnormal intracavity structures (23). The vertical long-axis view is well suited to visualize the left atrial appendage. Abnormalities of the thoracic vessels are not uncommon in pulmonary and/or aortic VHD. Aortic or pulmonary valve stenoses are not infrequently associated with aneurysmal dilatation of the proximal ascending aorta or pulmonary trunk, respectively (Fig. 14.6). Moreover, there is an association between the presence of bicuspid aortic valve and aortic coarctation. MRI offers the possibility of an integrated approach combining valve imaging and great vessel imaging. The arsenal of MRI techniques used to study the thoracic vessels consists of fast spin-echo MRI, b-SSFP cine MRI sequences, and 3D contrast-enhanced MR angiography.
ASSESSMENT OF NON-VHD CARDIAC DISEASES
Concomitant non-VHD-related cardiac diseases are not infrequent in patients with VHD. For example, LV dysfunction with low cardiac output in the presence of AS may be related to the AS, but may also be caused by concomitant coronary artery disease or previous myocardial infarction. In order to determine the potential benefit of an aortic valve replacement in such patients, other causes of LV dysfunction need to be excluded. As highlighted in other chapters in this book, MRI can be applied to image the proximal segment and the midsegment of the coronary arteries (Chapter 20), to evaluate the myocardial perfusion in rest and stress conditions (Chapter 15), and to determine the presence and extent of myocardial necrosis and scar tissue (Chapter 17). In this way, MRI is appealing to the clinicians as it offers a comprehensive approach to investigate VHD patients.
AORTIC VALVE
AORTIC STENOSIS
Severe AS is an important clinical entity because it is the most common valve lesion considered for valve replacement in the United States, especially in older people (1). AS may be congenital (e.g., bicuspid aortic valve), or acquired (i.e., degenerative [fibrocalcific senile AS] and rheumatic heart disease) (Fig. 14.7). Besides stenosis of the aortic valve, sub- and supravalvular stenosis may also lead to AS. The hemodynamic consequence of all forms is an increase in LV afterload leading to ventricular hypertrophy and myocardial replacment fibrosis (Fig. 14.6). It is essential in the diagnosis of AS to obtain information on the gradient across the aortic valve and the absolute aortic valve area (AVA). The gradient as such gives an incomplete assessment of the AS severity. Since the gradient is dependent on the stroke volume, ejection time (both of which are load dependent and influenced by myocardial contractility), and also the aortic pressure, it is possible for a mean aortic valve gradient <50 mm Hg to be associated with severe, moderate, or even mild AS (24). Thus it is important to determine AVA. Severe AS is defined as an AVA ≤1 cm2 (indexed AVA ≤0.6 cm2/m2). It is currently believed that patients with severe AS can be divided into three groups: A first group of AS patients with highgradient, normal-flow, and preserved LV ejection fraction; a second group with low-gradient, low-flow, and decreased LV ejection fraction; while recently a third group has been added—low-gradient, low-flow AS patients presenting with a preserved LV ejection fraction (24,25). The observed prevalence of the third group ranges between 14% and 24%. Whereas outcome in AS patients with “high-gradient” is good after aortic valve replacement, this is much less the case in the other subgroups because these patients often have comorbid conditions (coronary artery disease, previous myocardial infarction, systemic hypertension, diabetes mellitus, COPD).
Stay updated, free articles. Join our Telegram channel

Full access? Get Clinical Tree


