Fig. 8.1
Example of a landmark in a lung CT data set, selected by three medical experts. It can be seen that manual landmark selection and subsequent quantitative registration evaluation suffers from interobserver variability of landmark identification
For evaluation purposes, a (usually relatively sparse) set of landmarks is identified within each of the images  and
and  to register. For a single landmark
  within the discrete domain of image
  ,
,  , and a spatial transformation
  mapping
  onto
onto  , the standard validation metric is the Euclidean distance between the mapped landmark position
 ![$${\varvec{x}}_B^{[pred]}={\varvec{T}}\left( {\varvec{x}}_A\right) $$](/wp-content/uploads/2016/07/A217865_1_En_8_Chapter_IEq9.gif) after registration and the position
after registration and the position ![$${\varvec{x}}_B^{[actual]}$$](/wp-content/uploads/2016/07/A217865_1_En_8_Chapter_IEq10.gif) in
in  that is anatomically corresponding to landmark
  . In literature, this metric
![$$\begin{aligned} {\text{ TRE }}\left( {\varvec{x}}_A\right) =\left\| {\varvec{x}}_B^{[pred]}-{\varvec{x}}_B^{[actual]}\right\| _2 \end{aligned}$$](/wp-content/uploads/2016/07/A217865_1_En_8_Chapter_Equ1.gif)
is also often referred to as landmark-based, point, or target registration error [2, 13], and to summarize the error distribution for a set of landmarks, the mean error, the standard deviation, the maximum error and/or error quantiles are commonly considered.
and to register. For a single landmark within the discrete domain of image , , and a spatial transformation mapping onto , the standard validation metric is the Euclidean distance between the mapped landmark position after registration and the position in that is anatomically corresponding to landmark . In literature, this metric(8.1)
Whilst landmark-based registration errors as defined above represent (in the sense of a metric) absolute, non-negative error values, over- or underestimation of respiratory motion along a certain direction can also be identified using landmark sets. Therefore let the direction of interest being represented by a unit vector  along a vector
  ; then, directional errors and over/underestimation can be deduced from the projections of the misalignments
 ![$$\left( {\varvec{x}}_B^{[pred]}-{\varvec{x}}_B^{[actual]}\right) $$](/wp-content/uploads/2016/07/A217865_1_En_8_Chapter_IEq15.gif) onto
onto  .
.
along a vector ; then, directional errors and over/underestimation can be deduced from the projections of the misalignments onto .8.2.1.2 Ground-Truth Generation
Ground-truth for evaluating the landmark-based registration error is commonly generated by annotating corresponding landmarks within the images to register manually and is usually carried out by ‘medical experts’ (radiologists, medical students, etc.). The manual selection of such points is, however, time-consuming and landmark locations are prone to uncertainties due to intra- and interobserver variability concerning exact point selection [5, 12] (cf. Fig. 8.1), for instance caused by low image resolution or partial volume effects. In the case of lung CT registration, landmark identification additionally suffers from low contrast in near-to-pleura regions, which often leads to very limited landmark sets grouped around the mediastinum [3]. To serve as reliable ground-truth, the landmarks should preferably consist of a well-distributed set of verifiable anatomical correspondences throughout the image region of interest (e.g. the lungs) and be large enough in number to enable meaningful statistical analysis. The required number of landmarks can be assessed by a posteriori statistical sample size calculation [2]. The number may vary for individual data sets and motion estimation approaches, but it has been reported to be even more than 1000 anatomical point pairs [2] and so efforts have been made to (partially) automate identification of landmark sets.
One such algorithm is described in [11, 14], here serving as an example. The algorithm starts with automatic detection of landmarks in an image  . A so-called distinctiveness term is defined to quantify the distinctiveness of a voxel within its local neighborhood. The distinctiveness term combines both differential properties (gradient magnitude) and intensity characteristics to quantify the suitability of the voxel as a landmark candidate. Good distribution throughout the region of interest is ensured by forcing a minimum Euclidean distance between the landmark candidates. In a second step, the interactive landmark transfer to the image
  to be aligned with image
  by registration is supported by computing and progressively refining a thin-plate-splines transformation based on user-annotated landmark correspondences. After manually transferring an adequate number of landmarks, the transformation can be applied to guide the user to find correspondences for the remaining landmarks or even be used to transfer the landmarks fully automatically.
. A so-called distinctiveness term is defined to quantify the distinctiveness of a voxel within its local neighborhood. The distinctiveness term combines both differential properties (gradient magnitude) and intensity characteristics to quantify the suitability of the voxel as a landmark candidate. Good distribution throughout the region of interest is ensured by forcing a minimum Euclidean distance between the landmark candidates. In a second step, the interactive landmark transfer to the image to be aligned with image by registration is supported by computing and progressively refining a thin-plate-splines transformation based on user-annotated landmark correspondences. After manually transferring an adequate number of landmarks, the transformation can be applied to guide the user to find correspondences for the remaining landmarks or even be used to transfer the landmarks fully automatically.The algorithm has recently been applied for a number of registration evaluation studies [3, 9, 15], but it is only one example for construction of a landmark-based ground-truth. For instance, reviving earlier works on landmark detection [16] it has been suggested to incorporate curvature-based operators for distinctiveness calculation [17] or to consider Shannon entropy instead [18]. Furthermore, template matching methods have been applied for landmark transfer in order to fully automate the evaluation process [17, 19]; however, especially automating the landmark transfer can be controversial [2]. The transfer represents, by definition, a (point-based) registration problem. Thus, a (semi-)automatic landmark transfer may lead to biased evaluation if the registration method to evaluate and the landmark transfer methods are similar in some sense (for example if they maximize the same similarity measure).
8.2.1.3 Validation in Practice
The usage of landmarks is the most popular method of validation of non-linear registration. As well as the validation studies mentioned above and the described publicly accessible 4D-CT databases, numerous research articles have used anatomical landmark sets denoted by experts.
However, the actual size of the landmark sets varies from small numbers of about 20 landmark positions to large sets of 1500 positions, cf., e.g. [2, 20]. Naturally, the larger the number of landmarks, the better the estimation of accuracy is likely to be (cf. requirements for ground-truth generation described above). For a simple illustration beyond pure statistical computations, consider a lung with a volume of 4 l together with a set of 20 landmark positions. In this example, each cube of lung parenchyma with edge length 58 mm contains one landmark on average. Increasing the set of landmarks to 100 or even to 1500, the edge length of this cube reduces to 34 mm and 14 mm, respectively. A landmark spacing of a size of 14 mm undoubtedly allows for registration accuracy estimation on a coarse scale but not on a finer scale when taking into account the distinctive inhomogeneity of lung parenchyma.
Another critical point is the requirement of the landmarks to represent a well-distributed set over the structure/region of interest. If landmarks are placed on the bifurcations of major blood vessels as shown exemplarily in Fig. 8.2, left, they are concentrated around the mediastinum which has a number of disadvantages: (1) this type of ground-truth does not allow for accurate estimation in regions near to the pleura or diaphragm where registration accuracy is typically worse; (2) the stiffness of the lungs is highest in the surroundings of the major bronchial tree—reducing the local motion and meaning that the registration task is most difficult elsewhere; (3) major bifurcations are clearly visible to a human observer but also to the majority of registration schemes—unlike the hardly detectable low-contrast structures near to the pleura. The importance of the requirement of a good distribution of the landmarks in the region of interest is demonstrated in [3]. The authors compared landmark-based registration error as obtained for two landmark sets, one set as commonly used in the literature (cf. POPI-model), the other set well-distributed throughout the lung volume (shown in Fig. 8.2). A collection of six popular methods including surface- and volume-based as well as parametric and non-parametric methods was investigated. From each of these algorithms, a deformation vector field was extracted and used to transform the landmarks from both sets. While the mean landmark-based registration error on both landmark sets differs only slightly, a region-based analysis reveals smaller errors in apical regions but also a significantly higher error in the lower right lung (Fig. 8.3) and therefore a dependency of the landmark-based registration error on the distribution of landmarks. This dependency is observed for each of the six registration schemes.
Conclusion: Landmarks are a popular and intuitive method of registration validation. Both a large number of corresponding positions and a good distribution of the points throughout the organ of interest are crucial for reliable registration accuracy assessment. However, landmarks estimate registration accuracy only at selected locations and additional validation metrics are beneficial to provide deeper insight.
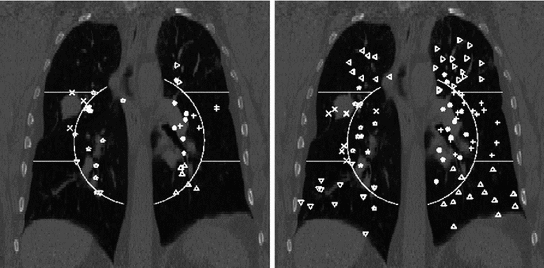
Fig. 8.2
Region definition and landmark positions shown in a coronal projection for a landmark set as commonly used in the literature (left) and for a well-dispersed landmark set (right). For improved visualization each region is given a unique landmark symbol
Fig. 8.3
Landmark-based registration error, shown proportional to the spheres’ diameters after registration by six different algorithms. Note the different errors in apical regions and lower right lung indicating the need for a well-dispersed set of landmarks
8.2.2 Line-Like Anatomical Structures
8.2.2.1 Validation Metrics
Landmarks focus on prominent points which are in most cases bifurcations of airways or the vessel tree. In order to extend the evaluation, validation metrics for line-like anatomical structures analyze he registration accuracy not only at discrete positions, but take the properties of the structure (e.g. vessel or airway) into account. For example, significant changes in curvature, folding along a branch, or implausible changes in branch length are interesting properties that can not be captured by landmarks. In the following, it is assumed that for both images a segmentation of the airways and/or vessels is given. Furthermore, the individual branches are labelled, so that for each branch in one image, the corresponding part in the other image is known. From the segmentation, a centerline representation can be derived and the branching points can be extracted.
Now, consider a given set of centerline points defined between two branch points of consecutive branching generations. An adequate interpolation scheme can be chosen to represent the point set as a continuous curve with a parametrization as a function  with
with ![$$t\in [0,1]$$](/wp-content/uploads/2016/07/A217865_1_En_8_Chapter_IEq21.gif) . The corresponding curve described by a function
. The corresponding curve described by a function  can be derived in the other image as well. Having two continuous corresponding line segments allows the definition of a variety of distance measures.
with . The corresponding curve described by a function can be derived in the other image as well. Having two continuous corresponding line segments allows the definition of a variety of distance measures.As an example, the registration accuracy along the centerline can be evaluated as the difference between corresponding points that have the same value of the parametrization constant as
where  defines the branch index and
  is the transformed centerline belonging to the
  th branch defined in image
  . Note that this measure is sensitive to a change in the length of the centerline. As the structures considered in the lungs can be assumed to preserve their absolute length during respiration, this sensitivity might be desirable.
(8.2)
defines the branch index and is the transformed centerline belonging to the th branch defined in image . Note that this measure is sensitive to a change in the length of the centerline. As the structures considered in the lungs can be assumed to preserve their absolute length during respiration, this sensitivity might be desirable.Alternatively, it is also possible to evaluate the distance by finding the closest point on the corresponding other centerline as
![$$\begin{aligned} D^i_2(t_A) = \underset{t_B\in [0,1]}{\text{ min }}||T(\varvec{c}^{i,A}_{\alpha (t_A)})-\varvec{c}^{i,B}_{\beta (t_B)}||_2\,. \end{aligned}$$](/wp-content/uploads/2016/07/A217865_1_En_8_Chapter_Equ3.gif)
Based on the centerline representation, other measures can be evaluated that consider line properties of the transformed centerline, for example local curvature, to detect implausible deformations. However, so far metrics for line-like structures have rarely been applied, mainly because segmentation and labelling of the considered structures is difficult to achieve.
(8.3)
8.2.2.2 Ground-Truth Generation
Examples that can be considered for line-like structures are airways and vessels. In each case the ground-truth generation relies on a segmentation and a labelling. However, manual segmentation and labelling is very time-consuming and from a practical point of view not always possible. Although a variety of automatic segmentation algorithms exists, failure especially in the case of pathologies or low image resolution, which is the case in 4D-CT, is likely to occur. A reliable ground-truth may be most efficiently obtained by applying an automatic segmentation first which is then inspected and manually corrected.
Both airways and blood vessels form dense tubular structures, but typically differ in appearance in a CT image. Thus, most approaches that take into account the tubular characteristic of the structure to be segmented can be often applied for both airways and vessels by simply changing the appearance parameters.
Many existing algorithms for airway and vessel segmentation are based on region growing [21]. However, in areas where the contrast is low, for example due to resolution and noise, leakage is observed. One possibility to circumvent this problem is by means of explosion control, for example by introducing certain rules derived from anatomical knowledge [22], or using template tracking based methods [23, 24]. For a recent overview on vessel segmentation techniques see [25] as well as algorithms described within challenges on vessel segmentation in the lung (VESSEL12)4 and on airway extraction (EXACT09, [26]).5
8.2.2.3 Validation in Practice
Validation based on labelled airways or vessels as introduced in Sect. 8.2.2.1 has, to our knowledge, not been published so far. While a considerable amount of work has been done on automatic segmentation as well as on matching of both airways and vessels, little of this information has been used for registration evaluation. This might be due to the fact that even with the help of automatic segmentation algorithms, generating a reliable ground-truth would require the verification of the obtained segmentations which is still very difficult and time-consuming. Furthermore, automatic extraction of both airways and vessels is still difficult on 4D-CT with low resolution and severe pathologies.
Conclusion: Compared to the use of landmarks that evaluate the registration accuracy at distinct locations, metrics described here can be used to measure the registration accuracy along a line-like structure. These measures have the potential to provide additional valuable insight into the registration, for example by detecting folding of a branch or change in branch length, etc. Nevertheless, measurements based on line-like structures have not been used so far because of the difficulties of obtaining a reliable ground-truth.
8.2.3 Surface Structures and Volumes
8.2.3.1 Validation Metrics
Estimating the registration accuracy for anatomical structures like the lungs, the lobes and the fissures leads to validation metrics for surface structures and volumes. The segmentations of a corresponding anatomical surface area or volume in two images  and
and  are denoted as voxel sets
  and
and  , respectively, with the transformed voxel set denoted as
  (cf. Fig. 8.4).
and are denoted as voxel sets and , respectively, with the transformed voxel set denoted as (cf. Fig. 8.4).Fig. 8.4
Illustration of union and intersection between two volumes
One common measure for evaluation of the registration accuracy using surface structures such as the outer lung boundaries or the fissures is the average surface distance. For each voxel  contained in
  , the closest voxel
  in
in  is determined and the Euclidean distance between them is calculated as
To ensure symmetry, the error  at each voxel in
  is also calculated and finally the average overall error is computed.
contained in , the closest voxel in is determined and the Euclidean distance between them is calculated as(8.4)
at each voxel in is also calculated and finally the average overall error is computed.
8.2.3.2 Ground-Truth Generation
Ground-truth generation for surface structures and volumes requires the segmentation of the respective objects of interest. For the purpose of evaluation of lung motion estimation, the most relevant structures are (i) lungs, (ii) lung lobes and fissures and (iii) potential tumors. Manual segmentation of those structures is usually very time-consuming. Thus, ground-truth generation that results from semi-automatic or automatic segmentation algorithms which are inspected and manually corrected is much more feasible from a practical point of view.
For the segmentation of the lungs, automatic approaches have been presented ranging from voxel-based segmentation methods [37] to multi-atlas registration [38]. Voxel-based methods are based on the assumption that, for normal lung parenchyma, there is a large difference in attenuation between the lung parenchyma and the surrounding tissue. While those methods have low computational time, they fail especially in the case of pathological lungs or image artifacts. Other methods that involve prior knowledge give potentially better results on pathological cases but have a significant increase in runtime. Further algorithms are described within a challenge on lobe and lung analysis (LOLA11).6
Fissure segmentation has been recently described in [39, 40] and extensions have been presented to deal with incomplete fissures or cases where the fissures are hardly visible [41]. Interactive methods [42] allow for correction of a given automatic segmentation result or manual segmentation from scratch.
In the context of radiotherapy planning and treatment, evaluating the correctness of tumor motion estimation is of major importance. For ground-truth generation, a variety of methods for semi-automatic and automatic tumor segmentation exists including vessel removal and pleural surface removal [43].
8.2.3.3 Validation in Practice
Volumetric overlap measures are well established and often applied to evaluate the results of an automatic segmentation [38]. However, especially in the case of large volumes, surface distance metrics are probably more relevant as there can still be quite large errors near the boundaries even though large parts of the volumes are overlapping.
For the registration methods from Fig. 8.3, a careful inspection of the pleura revealed good alignment with no significant inter-method variation. This observation is supported by the EMPIRE10 challenge [9] where 12 (26) out of 34 methods matched more than 99.99 % (99.9 %) of pleura-adjacent voxels correctly to either the interior or the exterior of the lung boundary.
Unlike the lung boundaries, the fissures are of much lower contrast in CT and thus more challenging to align in particular for larger motion amplitudes. In the EMPIRE10 challenge 2 (20) out of 34 methods matched more than 99.9 % (99 %) of fissure-adjacent voxels to the correct lung lobe. Registration of fissures is examplarily shown in Fig. 8.5. For visual inspection, the fissure of the left lung (marked by green plus signs) as extracted from the reference image (shown top left) is overlayed onto the transformed template images from three of the six registration methods under consideration. Although none of the methods employs dedicated knowledge about the fissures (e.g. by detecting them first), the fissures are roughly matched with a misalignment of only one to two voxels. Taking into account their low contrast, it can be assumed that matching of the fissures is assisted by high contrast surrounding vessel structures guiding the algorithm towards the desired deformation result (cf. Fig. 8.5 where the iso-contour is defined at  HU in the reference image and overlayed onto each transformed template image).
 < div class='tao-gold-member'>


HU in the reference image and overlayed onto each transformed template image).Only gold members can continue reading. Log In or Register to continue
Stay updated, free articles. Join our Telegram channel
Full access? Get Clinical Tree
