The detection of coronary artery microbruits, subaudible bruits too faint to be heard through standard auscultation, may provide an alternative means to diagnose coronary artery disease (CAD). The aim of this study was to test the accuracy of a novel digital electronic stethoscope, the Cardiac Sonospectrographic Analyzer (CSA; SonoMedica model 3.0, SonoMedica, Inc., Vienna, Virginia, United States Food and Drug Administration 510[k] cleared) to diagnose CAD compared to gold-standard diagnosis using cardiac computed tomographic (CT) angiography. In this blinded, single-site study, adults previously referred for CT imaging were selected. Patients underwent CT and CSA evaluations. CSA exams entailed recording heart sounds at 9 positions on the chest for 40 seconds at each position. An algorithm then processed these data to generate a microbruit score. The CT scans were read blinded to patients’ microbruit scores. Sensitivity and specificity of the CSA in detecting CAD compared to CT imaging were estimated using standard receiver-operating characteristic curves calculated from logistic regression models. A total of 161 patients, aged 57 ± 13 years (range 22 to 85), 53% with hypertension and 40% with obesity (body mass index ≥30 kg/m 2 ), completed the protocol and had evaluable CT and CSA examinations. The overall sensitivity of the CSA to identify >50% stenosis in any major epicardial coronary artery as determined by CT imaging was 89.5% (p <0.0001). Gender-specific models based on smaller sample sizes had slightly poorer results and lower specificity among men with heavy chest hair. In conclusion, the CSA showed high sensitivity and specificity for the detection of significant early CAD in an outpatient setting and represents a new noninvasive device for detecting abnormal coronary blood flow as occurs in CAD.
Acoustic cardiography is a technique that uses heart sound data culled using a specialized stethoscope in concordance with simultaneous digital electrocardiographic data to create an interpretation of the acoustic data. Modeling studies indicate that bruits are generated by arterial wall motion driven by the turbulence in blood flow created by arterial narrowing. By interpreting differences in sound quality produced by laminar flow in an artery not affected by atherosclerotic plaque compared to the turbulent flow produced by some degree of intracoronary obstruction, acoustic cardiography may be able to detect coronary artery disease (CAD) at an early stage. This simple, noninvasive technique has been under various stages of development since the 1980s. Although the traditional stethoscope has long been the physician’s trusted companion in the diagnostic armamentarium, the technological advances wrought by the digital age have allowed significant improvements in the capability to detect CAD using surface auscultation. We sought to assess the diagnostic utility of the Cardiac Sonospectrographic Analyzer (CSA; SonoMedica model 3.0, SonoMedica, Inc., Vienna, Virginia) in predicting and/or ruling out CAD in patients who undergo multidetector computed tomographic (CT) coronary angiography.
Methods
A prospective, single-site evaluation was performed in consecutively selected adults referred for coronary CT angiography as part of their routine medical care. The study was conducted under the auspices of the Institutional Ethics Committee/Human Research Ethics Committee at North Shore University Hospital (Manhasset, New York), and consent was obtained from all patients before their participation. SonoMedica financially supported the study with respect to performance of the sonospectroscopic analysis. Patients were not compensated for their participation in the study. Spectroscopic data were collected by the investigators and analyzed by a core laboratory specializing in sonospectrographic analysis, under the direction of Dr. John Semmlow, professor of biomedical engineering at Robert Wood Johnson Medical School and Rutgers University. The core laboratory was also responsible for independently verifying the microbruit score (MBS) for each patient. CT data were analyzed blinded to the spectroscopic data at North Shore University Hospital, and results were compared relating to prediction of CAD by the CSA. Statistical analysis was performed by an independent biostatistical research center (Biomedical Computer Research Institute, Philadelphia, Pennsylvania).
Patients eligible for study participation were without known CAD, in good health, and aged ≥21 years. Exclusion criteria included known atherosclerotic heart disease, including a history of myocardial infarction, percutaneous coronary intervention, coronary artery bypass graft surgery, or an established diagnosis of CAD by previous traditional invasive or CT angiography; supraventricular or ventricular arrhythmias that would be expected to affect CT angiographic image quality; previous use of intravenous vasodilators that may affect blood flow hemodynamics; any pulmonary conditions that would create abnormal physical findings that would interfere with the fidelity of the cardiac sound recording; the presence of audible aortic or pulmonary diastolic murmurs, tricuspid or mitral flow diastolic murmurs, or continuous murmurs; and any contraindications to coronary CT angiography.
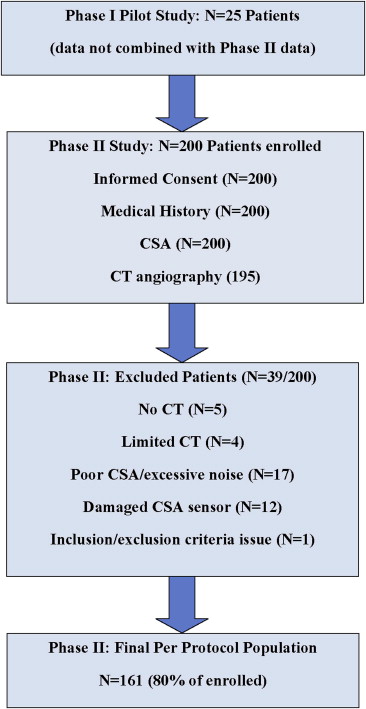
All patients provided written informed consent. There were 2 phases to the study. The first phase included 25 patients and served only as the initial pilot feasibility study to train study staff members on proper acoustic data collection. This data was not combined with the phase 2 data (n = 200), which served as the definitive study data. A flowchart explaining the patient selection algorithm is provided in Figure 1 . Each patient provided a brief medical history through an interview with study personnel. This information included questions on cardiovascular disease, risk factors, anthropometrics, and medications. Vital signs were also taken before CT angiography. The amount of male chest hair, female breast size, and the existence of heart murmurs were also obtained. The medical history and other data were captured on a standardized case report form.

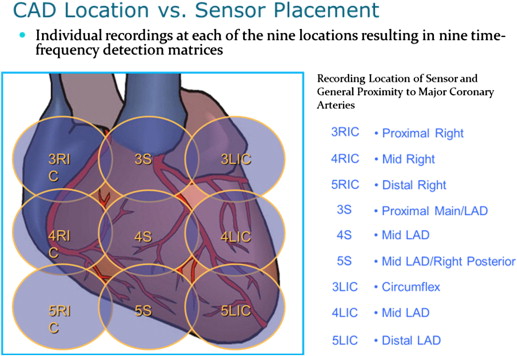
CSA evaluations were performed on each patient. The CSA is a noninvasive digital electronic stethoscope, with United States Food and Drug Administration 510(k) clearance, designed to identify microbruits in the frequency range of 400 to 2,700 Hz, characteristic of abnormal blood flow in atherosclerotic arteries. Microbruits are caused by the same mechanism as auditory bruits, namely, arterial narrowing that produces turbulent blood flow, but they are too faint to be detected by auscultation. The patient was seated in an examination chair, and 4 electrocardiographic leads were attached to the patient’s extremities. An independent reference acoustic sensor was then placed on a table adjacent to the patient to monitor environmental noise. The CSA exam was then performed by sequentially placing the transducer over 9 positions on the chest ( Figure 2 ) and recording heart sounds for 40 seconds at each position. An elastic strap was used to hold the transducer in place at the specified locations on the patient’s chest. The typical CSA recording process, including equipment setup, took approximately 15 minutes, with the acoustic and electrocardiographic signals digitally recorded on a portable computer. The CSA software algorithm processed the recorded data, using the simultaneously recorded electrocardiographic signal to identify the patient’s heartbeat cycle and analyze the acoustic signals to generate the MBS.

The CSA evaluation was conducted before CT angiography and associated β blockade. The CSA evaluation was conducted in the CT preparation area, which was selected to minimize environmental noise; however, the area was at times subject to various levels of uncontrolled environmental noise (intercom announcements, hospital maintenance noise, etc.). All assessments for an individual patient were performed at the same session by trained study personnel. Data collected were compiled and uploaded electronically to the cardiac sonospectrographic core laboratory.
All patients were scanned using a CT scanner (GE LightSpeed VCT; GE Healthcare, Waukesha, Wisconsin) equipped with 64-slice CT technology. Scan parameters included 64 slices per rotation, individual detector slice width of 0.625 mm, and 12.5-cm spatial coverage in 5 seconds at a gantry rotation speed of 330 ms. After the patient was advanced into the scanner bore, a 20-ml test bolus of contrast was administered. Patients were asked to breathe deeply and then hold their breath. After bolus administration of 70 ml of nonionic iodinated contrast material (Omnipaque [iohexol]; GE Healthcare, Amersham Health, Princeton, New Jersey) at a flow rate of 5 ml/s, image acquisition was performed. The scan time was approximately 10 seconds (1 breath hold), and heart rates were titrated using β-blocker therapy to near 60 beats/min. Image acquisition was performed at 10% increments through the R-R cardiac cycle interval. After image acquisition, images were transferred to a GE AW workstation (GE Healthcare), where they were reconstructed with electrocardiographic gating and interpreted by an experienced reader for the presence of CAD as part of the patient’s evaluation in the clinical setting. All patients had valid clinical indications for being referred for cardiac CT imaging.
The coronary CT angiograms were interpreted blinded to patients’ MBS. The CT angiography scan evaluation yielded 17 scores, each measured on a 5-point, Likert-type scale (0 = normal with no calcium, 1 = calcification with no significant narrowing, 2 = minimal/some narrowing [<30%], 3 = mild or mild to moderate narrowing [30% to 50%], 4 = moderate narrowing [>50% to 70%], 5 = severe/significant narrowing [>70%]). The a priori primary CAD end point was the dichotomous CAD outcome of ≤50% narrowing for up to 17 coronary artery locations (CAD negative) versus >50% narrowing in any 1 artery location (CAD positive). A total CAD score equal to the total sum of all locations of the CT imaging–reported CAD levels on the 0-to-5 scale was computed. A peak CAD score was also computed. These were considered secondary CAD end points.
The evaluation of the CSA data was conducted by the acoustic core laboratory, which was blinded to the CT angiographic results. The acoustic core laboratory was responsible for running the acoustic data through the SonoMedica acoustic analysis software to determine the total MBS for each patient. The total MBS formula is based on the statistical approach of taking a geometric mean of the 9 separate and independent MBS recorded from the 9 coronary artery locations ( Figure 2 ). This total MBS has a range of 0 to 1, with 0 representing low probability of clinically significant disease (no disease) and 1 representing high probability of clinically significant disease (severe or significant disease). The total MBS was the a priori primary CSA end point. Each of the 9 MBS was considered a secondary CSA end point.
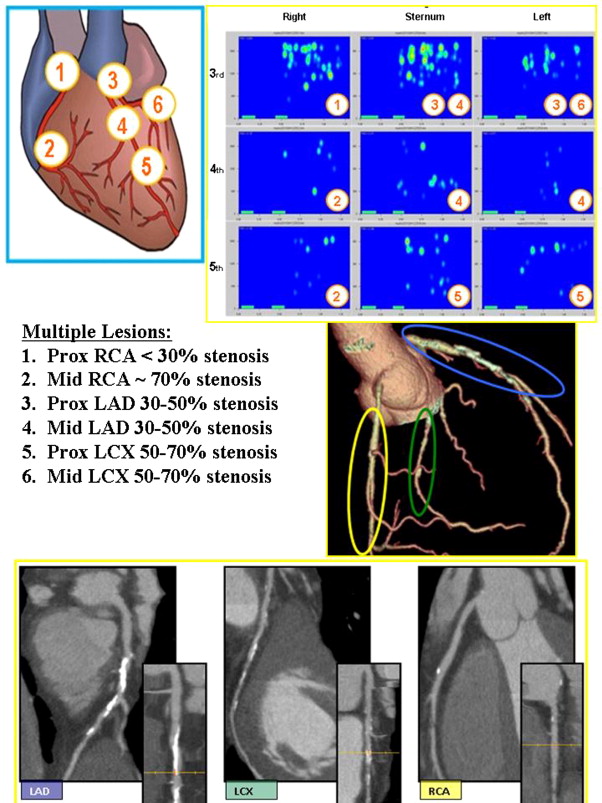
An a priori statistical analysis plan was developed. The per protocol population was all subjects in the second phase with completed medical histories, physical examinations, and CT and CSA examinations that could be interpreted, and all analyses reported here are based on the per protocol population. Patients with unevaluable CT or CSA examinations were excluded from the per protocol population. Patients were included or excluded on the basis of the quality of their CT and/or CSA evaluations. Such determination was made either by the principal investigator or the acoustic core laboratory, respectively. CT data that were deemed “limited” were excluded if it was agreed that such data could not be used to make a clinical determination of disease. CSA acoustic data were processed using an acoustic assessment algorithm, independently developed by the acoustic core laboratory, which identifies excessive levels of environmental noise. All CSA data that did not meet the noise thresholds were excluded from analysis. In total, 39 patients were excluded from the final analysis set because of (1) no CT data taken (n = 5), (2) limited CT angiographic quality (n = 4), (3) excessive environmental noise in the CSA data (n = 17), (4) a damaged CSA sensor (n = 12), or (5) failure to meet the study exclusion criteria (n = 1). An example case is provided in Figure 3 .

All numerically continuous data are expressed as mean ± SD unless otherwise stated. Proportions for demographic characteristics were compared using Fisher’s exact test. Sensitivity and specificity of the CSA were estimated using standard receiver-operating characteristic (ROC) curves calculated from logistic regression models. C-statistics (areas under the ROC curves) and p values were also computed. No Bonferroni adjustments were performed for simultaneous multiple comparisons. A p value ≤0.05 was considered statistically significant. All analyses were performed using SAS version 9.2 (SAS Institute Inc., Cary, North Carolina).
Results
A total of 161 of the 200 phase 2 patients (80%), aged 57 ± 13 years (range 22 to 85), 53% with hypertension and 40% with obesity (body mass index ≥30 kg/m 2 ), completed the protocol and had evaluable CT and CSA examinations (the per protocol population). Demographic and anthropometric data as well as vital signs and medical history data are listed in Table 1 for the entire per protocol population and the CAD-negative and CAD-positive cohorts. Nearly half the population were aged >60 years, obese, and had medical histories of hypertension and hypercholesterolemia. Baseline characteristics were evenly matched. More than half of the CT angiograms were rated as good quality ( Table 2 ), and the dominant artery was the right coronary artery in 93% of the patients.


