Current risk scores of ST-segment elevation myocardial infarction (STEMI) need sophisticated algorithm and were limited for bedside use. Our study aimed to evaluate the usefulness of admission shock index (SI) for predicting the short-term outcomes in patients with STEMI. Included were 7,187 consecutive patients with STEMI. The admission SI was defined as the ratio of admission heart rate and systolic blood pressure. Patients were divided into 2 groups with SI <0.7 and ≥0.7, respectively, based on the receiver operating characteristic curve analysis. The major end points were 7- and 30-day all-cause mortality. Of 7,187 patients, 5,026 had admission SI <0.7 and 2,161 had admission SI ≥0.7. Those who presented with SI ≥0.7 had greater 7- and 30-day all-cause mortality and major adverse cardiovascular events than patients with SI <0.7. After multivariate adjustment, patients with SI ≥0.7 had a 2.2-fold increased risk of 7-day all-cause mortality (hazard ratio 2.21, 95% confidence interval [CI] 1.71 to 2.86) and 1.9-fold increased risk of 30-day all-cause mortality (hazard ratio 1.94, 95% CI 1.54 to 2.44). Moreover, admission SI ≥0.7 was also associated with 1.6- and 1.5-fold increased risk of 7- and 30-day major adverse cardiovascular events (hazard ratio 1.63, 95% CI 1.36 to 1.95 and hazard ratio 1.47, 95% CI 1.24 to 1.74, respectively). The C statistic of admission SI for predicting 7- and 30-day all-cause mortality was 0.701 and 0.686, respectively, compared with 0.744 and 0.738 from the Thrombolysis In Myocardial Infarction risk score. In conclusion, admission SI, an easily calculated index at first contact, may be a useful predictor for short-term outcomes especially for acute phase outcomes in patients with STEMI.
Highlights
- •
Patients with shock index (SI) ≥0.7 had greater short-term mortality after ST elevation myocardial infarction.
- •
SI ≥0.7 was an independent risk factor of poor short-term outcomes after ST elevation myocardial infarction.
- •
SI had modest predictive value for 7-day all-cause mortality.
Although numerous studies have demonstrated the validity of the risk scores such as Thrombolysis In Myocardial Infarction (TIMI), GRACE, and other risk scores that are widely used for risk stratification in ST-segment elevation myocardial infarction (STEMI), the sophisticated calculation usually makes them inconvenient to operate at bedside in daily clinical practice. The shock index (SI), defined as the ratio of heart rate (HR) and systolic blood pressure (SBP), ranges from 0.5 to 0.7 in healthy adults and has been shown to be elevated in the setting of acute hypovolemia and left ventricular dysfunction. SI was originally used for evaluation of patients with hemorrhage, and it increased proportionally with progressive loss in circulating blood volume ; afterward, studies demonstrated that SI played an important role in outcome assessment in critically ill patients, such as those with severe sepsis, trauma, pulmonary embolism (PE), and pneumonia. However, the prognostic value of SI in patients with STEMI has not been well understood. The present study, therefore, aims to investigate the usefulness of SI to evaluate the short-term outcomes in patients with STEMI.
Methods
This is a retrospective study of consecutive patients with acute STEMI within 12 hours from symptom onset from 2001 to 2004 in 247 hospitals in China. Although it is a retrospective study, data were collected prospectively. STEMI was defined as following: chest pain or equivalent symptoms in combination with dynamic electrocardiographic changes consistent with STEMI (in the presence of ST elevation >0.1 mV in ≥2 extremity leads, >0.2 mV in ≥2 precordial leads, or accompanying with left bundle branch block morphology) and increased serum biochemical markers of cardiac necrosis, including creatine kinase-MB and troponin I. Study protocols were approved by the appropriate institutional review boards of Fuwai Hospital and complied with the Declaration of Helsinki. All subjects provided written informed consent.
The admission vital signs, including blood pressure (BP), HR, and oxygen saturation, were measured accurately in the supine position. For BP measurement, if possible, ≥2 readings were taken and averaged. Other baseline data including gender, age, weight, and histories of cardiovascular diseases (myocardial infarction, stroke, hypertension, diabetes, and heart failure) were obtained. Admission blood sugar, hemoglobin, location of myocardial infarction on electrocardiogram, and Killip class were also recorded. The admission TIMI risk score (TRS) was calculated according to the score criterion.
After admission to hospital, patients received medication therapy including antiplatelet, anticoagulation, statins, angiotensin-converting enzyme inhibitor or angiotensin receptor antagonist, nitrates, β blocker, and calcium channel blockers as far as possible to comply with the guidelines recommendation for the management of STEMI. Those who were appropriate for reperfusion therapy were treated with thrombolysis or percutaneous coronary intervention according to the clinical circumstances.
Admission SI is defined as the ratio of HR and SBP on admission. The optimal cut-off value of SI was based on optimizing the sum of sensitivity and specificity by receiver operating characteristic curve analysis, which predicted the7-day all-cause mortality because most of mortality events occurred within 7 days after admission to hospital.
The primary outcomes were all-cause mortality within 7 and 30 days after hospitalization. The secondary outcomes included reinfarction, life-threatening arrhythmias, cardiogenic shock, stroke, heart failure, bleeding, recurrent myocardial ischemia, and major adverse cardiovascular events (MACE) that were composite of all-cause mortality, reinfarction, life-threatening arrhythmias, cardiogenic shock, and stroke within 7 and 30 days after hospitalization.
The definition of every event was as following: all-cause mortality included cardiovascular death (defined as any death with a cardiovascular cause) and noncardiovascular death (defined as deaths due to a clearly documented noncardiovascular cause); cardiogenic shock was defined as persistent hypotension (SBP <90 mm Hg) that did not respond to fluid titration and required an intra-aortic balloon pump or intravenous inotropic therapy. Recurrent myocardial ischemia was defined as recurrent chest pain with new electrocardiographic changes. Reinfarction was defined as recurrent typical chest pain with new ischemic electrocardiographic changes (ST re-elevation or depression or new Q waves) and a further increase in enzyme levels (to twice the upper limit of normal if it had returned to baseline or if already elevated, with a further elevation by 50%). Stroke was defined as focal neurologic deficits that persisted for >24 hours and confirmed by computed tomographic scans or magnetic resonance imaging. Bleeding included major bleeding and minor bleeding. Major bleeding was defined as bleeding in a critical location such as intracranial bleeding, bleeding leading to surgical intervention, overt bleeding associated with a decrease in hemoglobin concentration of ≥20 g/L or leading to transfusion of ≥2 units of blood, or fatal bleeding. Minor bleeding was defined as clinically relevant overt bleeding not meeting the criteria for major bleeding.
The baseline characteristics presented with mean ± SD or median and interquartile range for continuous variables were compared by 1-way analysis of variance and Bonferroni correction if the data were normal distribution, otherwise by Wilcoxon signed rank test. Categorical variables presented as percentage were compared by the Pearson chi-square test. Cumulative survival and MACE curves were constructed with the Kaplan-Meier method. Log-rank tests were used to compare the curves of groups. Multivariate Cox proportional hazard regression models were performed to identify whether there was an association between SI and the 7- and 30-day outcomes, and the models were corrected for age, gender, and other clinical parameters. The adjusted hazard ratios with their respective 95% confidence intervals (CIs) for each group were calculated. The discriminatory capacity of SI for predicting 7- and 30-day all-cause mortality was assessed using the area under the receiver operating characteristic curve (C statistic). All statistical tests were 2-tailed, and p values were statistically significant at <0.05. All statistical analyses were carried out using the SPSS statistical software, version 19.0 (SPSS Inc., Chicago, Illinois).
Results
Of 7,510 patients, 323 were excluded because of incomplete data or nonsinus rhythm at admission, and 7,187 remaining patients were analyzed. The best cutoff of SI for predicting 7-day all-cause mortality was 0.7 by receiver operating characteristic curve, and the sensitivity and specificity were 59.0% and 74.4%, respectively. With this threshold, 5,026 patients had normal admission SI (<0.7) and 2,161 patients had elevated admission SI (≥0.7).
Table 1 lists the baseline characteristics of the study population. Compared with the patients with normal admission SI, patients with SI ≥0.7 were more likely to be women (p = 0.008), weighted lighter (p <0.001), and have histories of cardiovascular diseases such as myocardial infarction, diabetes mellitus, and heart failure (all p <0.001). The onset-to-admission intervals in patients with SI ≥0.7 were longer than in patients with normal admission SI (p = 0.001). At admission, those with SI ≥0.7 tended to present with anterior myocardial infarction, worse Killip class, higher blood glucose level, and TRS (all p <0.001).
| Variable | All Patients (n = 7,187) | SI <0.7 (n = 5,026) | SI ≥0.7 (n = 2,161) | p Value |
|---|---|---|---|---|
| Age (years), mean ± SD | 62.5 ± 11.9 | 62.4 ± 11.7 | 62.8 ± 12.3 | 0.181 |
| Male | 5,105 (71.0%) | 3,617 (72.0%) | 1,488 (68.9%) | 0.008 |
| Weight (kgs) | 66.7 ± 11.8 | 67.4 ± 11.6 | 65.1 ± 12.2 | <0.001 |
| History of myocardial infarction | 575 (8.0%) | 350 (7.0%) | 225 (10.4%) | <0.001 |
| Diabetes mellitus | 805 (11.2%) | 514 (10.2%) | 291 (13.5%) | <0.001 |
| Hypertension | 2,922 (40.7%) | 2,223 (44.2%) | 699 (32.3%) | <0.001 |
| History of heart failure | 196 (2.7%) | 95 (1.9%) | 101 (4.7%) | <0.001 |
| History of stroke | 669 (9.3%) | 462 (9.2%) | 207 (9.6%) | 0.626 |
| Onset-to-admission intervals (hours ∗ ) | 5.2 (3.1, 8.2) | 5.0 (3.0, 8.0) | 5.5 (3.2, 8.5) | 0.001 |
| Admission vital signs | ||||
| Systolic blood pressure (mm Hg) | 126.9 ± 25.2 | 134.5 ± 22.9 | 109.4 ± 21.4 | <0.001 |
| Diastolic blood pressure (mm Hg) | 79.3 ± 16.1 | 82.7 ± 14.9 | 71.3 ± 15.8 | <0.001 |
| Heart rate (beat/min ∗ ) | 76.0 (66.0, 88.0) | 72.0 (62.0, 80.0) | 91.0 (80.0, 103.0) | <0.001 |
| Killip class | <0.001 | |||
| I | 5,897 (82.1%) | 4,377 (87.1%) | 1,520 (70.3%) | |
| II | 981 (13.6%) | 576 (11.5%) | 405 (18.7%) | |
| III | 150 (2.1%) | 52 (1.0%) | 98 (4.5%) | |
| IV | 159 (2.2%) | 21 (0.4%) | 138 (6.4%) | |
| ST segment elevation | <0.001 | |||
| V1∼V6 | 3,892 (54.2%) | 2,560 (50.9%) | 1,332 (61.6%) | |
| II, III, avF or V7∼V9 | 3,098 (43.1%) | 2,326 (46.3%) | 772 (35.7%) | |
| I, avL | 147 (2.0%) | 112 (2.2%) | 35 (1.6%) | |
| New left bundle-branch block | 50 (0.7%) | 28 (0.6%) | 22 (1.0%) | |
| TIMI risk score | 4.1 ± 2.4 | 3.6 ± 2.0 | 5.3 ± 2.8 | <0.001 |
| Blood sugar (mmol/L ∗ ) | 7.3 (5.9, 9.6) | 7.2 (5.9, 9.2) | 7.7 (6.0, 10.6) | <0.001 |
| Hemoglobin (g/L ∗ ) | 136.0 (124.0, 148.0) | 136.0 (125.0, 148.0) | 135.0 (122.0, 148.0) | 0.010 |
Table 2 lists the main management during hospitalization. Compared with those with normal admission SI, patients with admission SI ≥0.7 received less thrombolysis, aspirin, angiotensin-converting enzyme inhibitor (or angiotensin receptor antagonist), statins, nitrates, and calcium channel blockers (all p <0.001) but used more diuretics (p <0.001). In contrast, percutaneous coronary intervention, anticoagulation, and β-blocker use were comparable between the 2 groups (all p >0.05).
| Variable | All Patients (n = 7,187) | SI <0.7 (n = 5,026) | SI ≥0.7 (n = 2,161) | p Value |
|---|---|---|---|---|
| Reperfusion strategies | ||||
| Thrombolysis | 3,754 (52.2%) | 2,700 (53.7%) | 1,054 (48.8%) | <0.001 |
| Percutaneous coronary intervention | 845 (11.8%) | 604 (12.0%) | 241 (11.2%) | 0.318 |
| Anticoagulants | ||||
| Heparin | 6,448 (89.7%) | 4,501 (89.6) | 1,947 (90.1%) | 0.498 |
| Antiplatelet therapy | ||||
| Aspirin | 6,881 (95.7%) | 4,845 (96.4%) | 2,036 (94.2%) | <0.001 |
| Clopidogrel | 2,027 (28.2%) | 1,432 (28.5%) | 595 (27.5%) | 0.424 |
| Other medications | ||||
| β Blocker | 4,518 (62.9%) | 3,178 (63.2%) | 1,340 (62.0%) | 0.325 |
| Angiotensin-converting enzyme inhibitor (or angiotensin receptors blocker) | 5,180 (72.1%) | 3,791 (75.4%) | 1,389 (64.3%) | <0.001 |
| Statins | 5,123 (71.3%) | 3,670 (73.0%) | 1,453 (67.2%) | <0.001 |
| Nitrates | 6,618 (92.1%) | 4,692 (93.4%) | 1,926 (89.1%) | <0.001 |
| Calcium channel blocker | 923 (12.8%) | 694 (13.8%) | 229 (10.6%) | <0.001 |
| Diuretics | 1,828 (25.4%) | 1,085 (21.6%) | 743 (34.4%) | <0.001 |
Table 3 lists the 7- and 30-day outcomes. The overall 7- and 30-day all-cause mortality rates were 8.0% and 10.5%, respectively. Patients with admission SI ≥0.7 had greater 7-day all-cause mortality, life-threatening arrhythmias, cardiogenic shock, heart failure, and MACE than patients with normal admission SI (all p <0.001). Similarly, the 30-day all-cause mortality, cardiac arrest, cardiogenic shock, and MACE were significantly greater in patients with admission SI ≥0.7 than in normal admission SI (all p <0.05), whereas the reinfarction, recurrent ischemia, and revascularization occurred more in patients with admission SI ≥0.7 compared with those with normal admission SI (all p <0.05).
| Outcomes | All Patients (n = 7,187) | SI <0.7 (n = 5,026) | SI ≥0.7 (n = 2,161) | p Value |
|---|---|---|---|---|
| 7-Day events | ||||
| All-cause mortality | 578 (8.0%) | 233 (4.6%) | 345 (16.0%) | <0.001 |
| Reinfarction | 107 (1.5%) | 83 (1.7%) | 24 (1.1%) | 0.089 |
| Life-threatening arrhythmias | 584 (8.1%) | 316 (6.3%) | 268 (12.4%) | <0.001 |
| Cardiogenic shock | 395 (5.5%) | 124 (2.5%) | 271 (12.5%) | <0.001 |
| Stroke | 45 (0.6%) | 27 (0.5%) | 18 (0.8%) | 0.145 |
| Heart failure | 1,324 (18.4%) | 651 (13.0%) | 673 (31.1%) | <0.001 |
| Bleeding | 258 (3.6%) | 166 (3.3%) | 92 (4.3%) | 0.053 |
| MACE | 1,240 (17.3%) | 656 (13.1%) | 584 (27.0%) | <0.001 |
| 30-Day events | ||||
| All-cause mortality | 754 (10.5%) | 328 (6.5%) | 426 (19.7%) | <0.001 |
| Reinfarction | 142 (2.0%) | 111 (2.2%) | 31 (1.4%) | 0.033 |
| Cardiac arrest | 109 (1.5%) | 65 (1.3%) | 44 (2.0%) | 0.021 |
| Cardiogenic shock | 425 (5.9%) | 141 (2.8%) | 284 (13.1%) | <0.001 |
| Stroke | 61 (0.8%) | 37 (0.7%) | 24 (1.1%) | 0.123 |
| Recurrent ischemia | 575 (8.0%) | 425 (8.5%) | 150 (6.9%) | 0.033 |
| Bleeding | 262 (3.6%) | 170 (3.4%) | 92 (4.3%) | 0.074 |
| Revascularization | 314 (4.4%) | 242 (4.8%) | 72 (3.3%) | 0.005 |
| MACE | 1,410 (19.6%) | 764 (15.2%) | 646 (29.9%) | <0.001 |
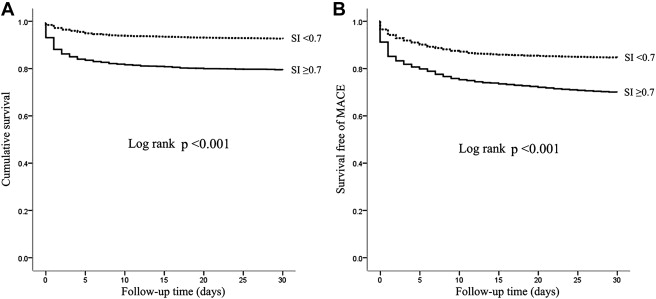
Figure 1 displays the Kaplan-Meier curves for 30-day all-cause mortality and MACE. It was revealed that patients with SI ≥0.7 had significantly greater cumulative mortality within 30 days than patients with normal admission SI (log-rank p <0.001; Figure 1 ). The survival free of MACE within 30 days also displayed the same trend (log-rank p <0.001; Figure 1 ).