The purpose of this study is to investigate the impact of a reduction of hemoglobin (Hb) content in the erythrocytes as estimated by mean corpuscular hemoglobin concentration (MCHC) on long-term clinical outcomes in nonanemic patients with heart failure (HF). We prospectively enrolled 1,579 subjects with HF who underwent coronary angiography enrolled in the GeneBank study with 5-year follow-up of all-cause mortality. Levels of Hb and MCHC were assessed at enrollment and after 6 months of follow-up. Anemia was defined as Hb levels <13 g/dl in men and <12 g/dl in women. In our nonanemic cohort (n = 785, 49.7%), mean Hb and median MCHC were 13.8 ± 1.1 g/dl and 34.3 g/dL (interquartile range 33.6 to 35), respectively. Nonanemic patients with heart failure with lower MCHC had higher mortality risk (quartiles 1 vs 4, hazard ratio = 2.1, 95% confidence interval 1.4 to 3.3, p = 0.001). In a subset of nonanemic patients with persistent normal Hb on follow-up (n = 206), the mean time between baseline and follow-up MCHC levels was 169.3 ± 41.6 days. In comparison with patients with levels of MCHC more than the first quartile (≥33.6 g/dl) on baseline and follow-up, patients with persistently low MCHC (<33.6 g/dl) had a significantly increased mortality risk (log rank <0.001). All models remained significant even after adjusting for traditional cardiac risk factors, left ventricular ejection fraction, baseline Hb levels, and mean corpuscular volume. In conclusion, relative hypochromia is an independent predictor of increased mortality risk in patients with HF, even in the setting of normal Hb levels.
Anemia has been reported to affect up to 20% to 30% of patients with heart failure (HF) and has consistently been associated with increased morbidity and mortality. Multiple mechanisms are involved in the development of anemia in the setting of HF, including nutritional deficiencies (such as malabsorption, impaired metabolism), acute or chronic blood loss (such as gastrointestinal bleeding), intrinsic renal disease leading to insufficient erythropoietin production, hemodilution from volume expansion, increased levels of circulating inflammatory cytokines (as in anemia of chronic inflammation), and medication use or hematinic abnormalities. The presence of anemia has become increasingly recognized as an important factor in the development and progression of HF. As one of the most common causes of anemia, iron deficiency is associated with impaired functional capacity, worse cardiac function, and adverse cardiac outcome. However, the definition of iron deficiency is largely restricted to quantifying levels of circulating iron and its binding proteins. Mean corpuscular hemoglobin concentration (MCHC), the index of hemoglobin (Hb) in blood cells, reported in complete blood cell count, reflects amount of iron incorporated into circulating erythrocytes. We have previously reported the prognostic implications of relative hypochromia (defined as low MCHC in the setting of normal Hb) in a small observational series of ambulatory patients with significant left ventricular impairment. Here, we investigate the effect of hypochromia on a larger and broader patient population of stable patients with heart failure especially regarding the impact of changes in MCHC levels over time on long-term survival. We also investigate the association between relative hypochromia and severity of HF assessed by biochemical, physiological, and functional measures and the association between relative hypochromia and various inflammatory and oxidative stress markers in the setting of HF.
Methods
The Cleveland Clinic GeneBank study is a large, prospective cohort study from 2001 to 2007 with clinical and longitudinal outcomes data composed of consenting subjects who underwent elective diagnostic cardiac catheterization procedure. All participants gave written informed consent approved by the Cleveland Clinic Institutional Review Board. History of HF was detected by (a) directly asking patient by research personnel, (b) reviewing medical records for confirmation (all patients were seen by cardiologist at Cleveland Clinic before the left heart catheterization), and (c) ICD codes and adjudication by research personnel. This analysis included 1,579 subjects with HF with the New York Heart Association functional class II to IV without evidence of myocardial infarction (cardiac troponin I <0.03 ng/ml) with hematologic data available for analysis. Five-year survival was ascertained for all subjects after enrollment through a combination of prospective patient contact, electronic medical record review, and confirmed by the Social Security Death Index.
Complete blood cell count was performed on blood samples collected at the day of enrollment using ADVIA 120 hematology analyzer (Siemens, New York, New York). Anemia was defined as Hb <13 g/dl for men and <12 g/dl for women. Indexes of anemia included Hb, hematocrit, MCHC (ratio of Hb to hematocrit), and mean corpuscular volume (MCV). The normal range of MCHC is 33 to 36 g/dl. Nonanemic patients were grouped into quartiles based on MCHC levels.
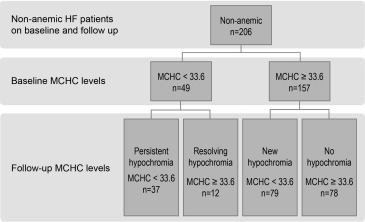
Follow-up levels of Hb and MCHC levels were obtained from reviewing the electronic medical records when these tests were measured for clinical purposes. To study change of MCHC levels over time, a fixed cutoff of 180 ± 90 days was used, and level closest to day 180 was selected. Only nonanemic patients on baseline and follow-up were analyzed to assess effect of MCHC change over time on patient’s outcome. To study the effect of MCHC change over time on outcomes, patients were grouped using cutoff of quartile 1 for MCHC; thus, 4 groups were identified: persistent hypochromia, resolving hypochromia, new hypochromia, and no hypochromia ( Figure 1 ).
HF severity was assessed based on plasma B–type natriuretic peptide levels (BNPs; using Abbott Architect ci8200; Abbott Laboratories, Abbott Park, Illinois) and Duke Activity Score Index (DASI) on day of enrollment. Left ventricular ejection fraction (LVEF) was collected for all patients. High-sensitivity C-reactive protein (hsCRP), ceruloplasmin, and serum arylesterase activity were all measured at the time of enrollment in a randomly selected sample of 790 patients. Ceruloplasmin and hsCRP were measured by Abbott Architect ci8200 (Abbott Laboratories). Serum arylesterase activity level was determined using a modification of a spectrophotometry-based assay as previously described.
The Student’s t test, Wilcoxon rank-sum test, or Kruskal-Wallis test for continuous variable and the chi-square test for categorical variables were used to examine the difference between the groups. Kaplan-Meier analysis and Cox proportional hazards regression were used for time-to-event analysis to determine hazard ratio and 95% confidence intervals (CIs) for 5-year survival. Levels of MCHC were adjusted for traditional cardiac risk factors in a multivariate model, including age, gender, diabetes mellitus, systolic blood pressure, hyperlipidemia, creatinine clearance, smoking, coronary artery disease, LVEF, body mass index, and medications (angiotensin-converting enzyme inhibitors/angiotensin receptor blockers, β blockers, and aspirin). Analyses were repeated after adjusting for Hb, MCV, and DASI. All statistical analyses were performed using R 2.15.1(Vienna, Austria).
Results
Table 1 lists the baseline characteristics of 1,579 patients with stable HF enrolled in this study. Mean Hb and MCHC were 12.6 ± 1.6 g/dl and 33.9 ± 1.2 g/dl, respectively (all normally distributed). About half of the patients (n = 785 [49.7%]) were nonanemic. Among this nonanemic group, the median MCHC was 34.3 g/dl (interquartile range of 33.6 to 35 g/dl). Patients with low levels of MCHC were more likely to be women, have lower creatinine clearance, and have less prevalence of smoking and coronary artery disease ( Table 1 ).
| MCHC levels, g/dL | Whole cohort | Non-Anemic population | p-value ∗ | ||||
|---|---|---|---|---|---|---|---|
| All Non- anemic | Quartile1 <33.6 | Quartile2 33.6-34.3 | Quartile3 34.3-35 | Quartile4 ≥35 | |||
| Number | 1579 | 785 | 196 | 195 | 197 | 197 | |
| Age (years) | 66±11 | 64±11 | 65±11 | 66±11 | 64±11 | 63±10 | <0.001 |
| Male sex | 65% | 65% | 50% | 57% | 71% | 82% | <0.001 |
| Body mass index (kg/m 2) | 30±7 | 31±7 | 32±9 | 31±8 | 31±7 | 30±6 | <0.001 |
| Systolic blood pressure (mmHg) | 131±22 | 131±21 | 134±23 | 131±21 | 131±21 | 128±19 | <0.001 |
| Diabetes mellitus | 39% | 34% | 38% | 35% | 29% | 34% | 0.311 |
| Hyperlipdemia | 83% | 82% | 81% | 77% | 83% | 86% | 0.182 |
| Smoker | 72% | 73% | 70% | 74% | 76% | 72% | 0.542 |
| Creatinine clearance (mL/min) | 83±4 | 94±43 | 87±45 | 91±40 | 98±43 | 98±44 | <0.001 |
| Coronary artery disease | 76% | 70% | 62% | 70% | 72% | 77% | 0.007 |
| Myocardial infarction | 58% | 56% | 50% | 54% | 56% | 64% | 0.058 |
| Ejection fraction (%) | 40 (25 – 55) | 35 (25-55) | 35 (20-55) | 40 (30-55) | 40 (30-55) | 35 (25-50) | 0.124 |
| Brain natriuretic peptide (pg/mL) | 310 (114-695) | 204 (91-499) | 398 (125-951) | 266 (107-686) | 173 (78-376) | 140 (73-371) | <0.001 |
| Heart failure with preserved EF | 37% | 36% | 35% | 42% | 38% | 28% | 0.048 |
| Angiotensin converting enzyme inhibitors/ angiotensin receptor blockers | 68% | 67% | 66% | 70% | 61% | 70% | 0.226 |
| Beta blockers | 67% | 66% | 64% | 63% | 68% | 68% | 0.644 |
| Aspirin | 66% | 66% | 59% | 66% | 61% | 76% | 0.003 |
| Hemoglobin (g/dL) | 12.6±1.6 | 13.8±1.1 | 13.7±1.1 | 13.6±1.1 | 13.8±1 | 14.1±1.1 | <0.001 |
| MCHC (g/dL) | 33.9±1.2 | 34.2±1.1 | 32.8±0.8 | 34±0.2 | 34.6±0.2 | 35.5±0.4 | <0.001 |
| MCV (fl) | 88.8±5.7 | 89±5 | 89.3±5.8 | 89.5±5.2 | 89±4.4 | 88.3±4.3 | <0.001 |
∗ p Value for the difference between MCHC quartiles in non-anemic population.
Anemic patients with HF showed increased risk of 5-year mortality (hazard ratio 2.2, 95% CI 1.8 to 2.7, p <0.001). Overall, patients with lower MCHC had increased mortality risk (quartiles 1 vs 4, hazard ratio 2.5, 95% CI 2.0 to 3.3, p <0.001). Among patients with normal Hb levels, patients with decreased MCHC levels have increased mortality risk in a graded pattern ( Figure 2 , Table 2 ). All results remained significant even after multivariate adjustments with traditional coronary risk factors and known prognostic cardiorenal, hematologic variables, and DASI ( Table 2 ). Furthermore, patients with low MCHC levels at baseline had significantly increased HF severity assessed by BNP levels (neurohormonal upregulation) and DASI (functional capacity) but not with LVEF ( Table 3 ).
| MCHC levels (g/dL) | Quartile 1 <33.6 | Quartile 2 33.6- 34.3 | Quartile 3 34.3-35 | Quartile 4 ≥35 |
|---|---|---|---|---|
| 5-year Death | 58/196=29.6% | 50/195=25.6% | 37/197=18.8% | 32/197=16.2% |
| Unadjusted Hazard ratio | 2.1 (1.4-3.3)** | 1.7 (1.1-2.7)* | 1.2 (0.8-2.0) | 1 |
| Adjusted Hazard ratio (Model 1) | 1.9 (1.2-3.1)* | 1.7(1.0-2.7)* | 1.3 (0.8-2.1) | 1 |
| Adjusted Hazard ratio (Model 2) | 1.9 (1.1-3.0)* | 1.7 (1.0-2.7)* | 1.3 (0.8-2.1) | 1 |
| Adjusted Hazard ratio (Model 3) | 1.7 (1.0-2.7)* | 1.5 (0.9-2.4) | 1.2 (0.7-1.9) | 1 |
| MCHC levels | All | Quartile 1 <33.6 | Quartile 2 33.6-34.3 | Quartile 3 34.3–35 | Quartile 4 ≥35 | P value |
|---|---|---|---|---|---|---|
| LVEF (%) | 35 (25-55) | 35 (20-55) | 40 (30-55) | 40 (30-55) | 35 (25-50) | 0.124 |
| BNP (pg/ml) | 204 (91-499) | 398 (125-951) | 266 (107-686) | 173 (78-376) | 140 (73-371) | <0.001 |
| DASI Score | 30 (18-43) | 24 (13-38) | 26 (17-43) | 35 (19-50) | 38 (23-50) | <0.001 |
| hsCRP (mg/L) | 3 (1-6) | 4 (3-8) | 3 (1-7) | 3 (1.3-5.8) | 2 (1-5) | <0.001 |
| Ceruloplasmin (mg/dL) | 25 (21-29) | 26.5 (23.6-30.9) | 25.8 (21.8-30.7) | 24.5 (20.5-28.3) | 23 (20-26) | <0.001 |
| Arylesterase activity (μmoles/min/mL) | 99 (81-117) | 89 (75-113) | 99 (86-114) | 103 (83-120) | 100 (81-117) | 0.118 |
Stay updated, free articles. Join our Telegram channel

Full access? Get Clinical Tree


