We introduce and evaluate strain mapping by multidetector computer tomography as a new noninvasive method for assessment of myocardial function. In patients (n = 16) with healed myocardial infarction, peak systolic radial strain was measured by automated pixel pattern matching analysis of multiple left ventricular 64-slice multidetector computer tomographic short-axis recordings. For comparison, radial strain and myocardial infarct extent were measured by tagged magnetic resonance imaging (MRI) and late enhancement MRI, respectively. In a linear mixed model analysis, myocardial infarct extent was a strong predictor of segmental strain by multidetector computer tomography (beta = −0.44, p <0.0001). Strain was significantly different among noninfarcted (0%), nontransmurally infarcted (0% to 50%), and transmurally infarcted (>50%) segments (p <0.001) and between infarcted and noninfarcted border zone segments (p <0.001). There was a close relation between strain by multidetector computer tomography and by tagged MRI (mean difference −7.4 ± 11.7%, r = 0.68, p <0.0001). Mean time-to-peak systolic strain was 324 ± 42 ms by multidetector computer tomography and 335 ± 56 ms by tagged MRI (mean difference 11 ± 40 ms). In conclusion, to our knowledge this is the first study to demonstrate that regional myocardial function can be quantified by multidetector computer tomographic imaging, indicating that assessment of radial strain by multidetector computer tomography might be a useful tool in the evaluation of patients with cardiovascular diseases.
Optimal evaluation of patients with cardiovascular disease is comprehensive and includes noninvasive assessment of cardiac anatomy and function. Multidetector computer tomographic (MDCT) imaging has emerged as a promising noninvasive clinical tool for assessment of cardiac and vascular anatomies, coronary calcium burden, coronary stenoses, and myocardial perfusion. Although studies have demonstrated that regional myocardial function can be evaluated visually from MDCT cines, quantitative assessment of myocardial function has not been feasible. In the present study we introduce and evaluate a new tracking algorithm originally developed for echocardiographic analysis that uses “on-screen” pixel information to track the motion of tissue contours by an automated frame-to-frame template matching technique. We hypothesized that due to the superb spatial resolution and high signal-to-noise ratio of MDCT images, left ventricular (LV) radial strain could be measured accurately by this multimodality tissue tracking (MTT) algorithm. To test our hypothesis, radial strain by multidetector computer tomography was compared to radial strain by tagged magnetic resonance imaging (MRI) and to extent of myocardial scarring assessed by late enhancement (LE) MRI, in patients with healed myocardial infarction.
Methods
Available MDCT data from patients with ischemic heart disease (n = 20, 7 women, mean age 56 ± 11 years) who participated in a previously performed study involving subjects with ischemic or idiopathic LV dysfunction were selected. These patients were referred for implantable cardioverter–defibrillator placement and scheduled to undergo MRI and MDCT imaging as part of a prospective study relating image patterns to implantable cardioverter–defibrillator firings. All subjects had given written consent and the patient study was approved by the Johns Hopkins institutional review committee.
Retrospective electrographically gated MDCT images were obtained by a Toshiba Aquilion 64-slice scanner (collimation 64 × 0.5; Toshiba Medical Systems, Otawara, Japan) using standard parameters for acquiring coronary angiograms (gantry rotation time 400 to 500 ms depending on heart rate, tube current 350 to 450 mA adjusted to patients’ body habitus, tube voltage 120 kV, field of view 180 × 180 mm, image matrix 256 × 256 pixels). No β-blocking agents were used. A bolus nonionic contrast medium (iopamidol, Isovue 370; Bracco Diagnostics, Inc., Princeton, New Jersey) was administered in an antecubital vein at a flow of 4 to 5 ml/min followed by a saline bolus chaser using a dual-head power injector (Stellant, Medrad, Indianola, Pennsylvania). Automated detection of peak enhancement in the descending aorta (SureStart, Toshiba Medical Systems) was used for triggering the scan. During 1 breath-hold, cardiac images from the carina to the apex of the heart were acquired. A navigation tool (SureCardio, Toshiba Medical Systems) for calculating the temporal resolution in the multisegmented reconstruction method was used to obtain the highest possible temporal resolution. Two to 5 consecutive heart beats were used to reconstruct a single image. MDCT image reconstruction was performed on the scanner’s workstation, dividing the RR interval into 20 to 33 phases with 2-mm effective slice thickness and 2-mm increment. Images were subsequently transferred to an off-line remote workstation, where dedicated software (Vitrea 2 version 3.9.0.1, Vital Images, Minnetonka, Minnesota) was used to reformat the images into LV 2-, 4-, and 5-chamber long-axis and 8 to 10 short-axis cine recordings. Image level window was adjusted to optimize the contrast between tissue and blood and the recordings were stored in the audio video interleave format.
MR images were obtained by a 1.5-T scanner (Sigma CV/I, GE Medical Systems, Waukesha, Wisconsin). Four-chamber, 2-chamber, and 8 to 10 short-axis cine loops covering the entire left ventricle were recorded during breath-hold (duration ∼15 seconds) using prospective electrocardiographically triggered segmented k-space steady-state free precession pulse sequence (imaging parameters, slice thickness 8 mm, interslice gap 2 mm, temporal resolution ∼40 ms, field of view 360 to 400 mm, image matrix 256 × 160). Multiple tagged short-axis recordings (8 to 10 slices) were obtained by prescribing parallel striped tags in 2 orthogonal orientations (0° and 90°) using electrocardiographically triggered fast gradient echocardiographic sequence with spatial modulation of magnetization (field of view 400 mm, slice thickness 10 mm, temporal resolution ∼37 ms, image matrix 256 × 128, tag distance 7 mm). Multiple LE short-axis images (8 to 10 slices) with a thickness of 10 mm were obtained 10 to 15 minutes after injection of a bolus of gadodiamide 0.2 mmol (Omniscan; Amersham Health, Princeton, New Jersey) per kilogram of body weight using an inversion-recovery fast gradient-echocardiographic pulse sequence.
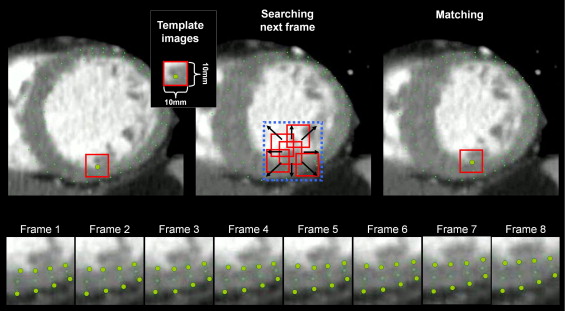
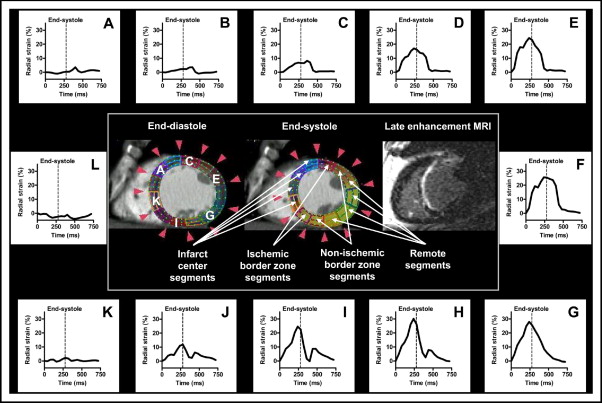
Radial strain analysis of MDCT cines was performed by an automated frame-to-frame pixel pattern-matching technique originally developed for analyses of echocardiographic cine recordings (Toshiba Medical Systems). Briefly, this MTT algorithm uses on-screen pixel information provided by cine loops stored in the audio video interleave format. After semiautomatic delineation of the endo- and epicardial borders, multiple tracking points (small pixel patterns representing tissue contours) are automatically located by the software and the motion vector for each tracking point is determined between consecutive frames by a template matching technique described as follows ( Figure 1 ). Around each tracking point a template image (10 × 10 mm) is assigned, and by searching in the following frame (within the square area of the template size) for the most similar template image, the new location of the tracking point is determined (to test for template similarity, a squared error function is used). Using a 2-dimensional interpolation algorithm, the motion vector of regions between tracking points is determined, and by calculating the change in distance between selected regions, 2-dimensional strain is quantified. Due to the high spatial resolution and signal-to-noise ratio of the MDCT cines, accuracy of the tracking can easily be determined visually. In case of inadequate tracking, border delineations are manually adjusted or drawn in a different frame until adequate tracking is achieved. After successful tracking radial strain is calculated as the change in endo- to epicardial thickness compared to its end-diastolic thickness. For regional strain analyses, the software allows mean values to be extracted according to a 6- or 12-segment cross-section model ( Figure 2 ).


In LV basal, mid, and apical short-axis MDCT cines the endocardial and epicardial borders were drawn in an early-systolic frame as previously described. The right ventricular inferior interventricular insertion point was used as reference for reproducible segmentation. Global end-systole was determined as the time of aortic valve closure. Segmental strain analyses were excluded from regions of inadequate tracking. After successful tracking, the magnitude and timing of peak systolic radial strain for each of 12 equiangular segments were extracted and used for further analyses. To compare strain measurements by multidetector computer tomography to those by tagged MRI, MDCT data were also regrouped according to 6-segment analysis by tagged MRI.
Radial strain and myocardial infarct extent by MRI were calculated using dedicated software (HARP Plus 1.06, Diagnosoft, Inc. Palo Alto, California). To ensure corresponding MRI and MDCT LV short-axis slices, we used LV dimensions (at matching LV intracavitary diameter and LV wall thickness) and anatomic landmarks. For assessment of radial strain by tagged MRI, endo- and epicardial LV borders were manually drawn in an early-systolic frame, and time-derived radial strain was automatically calculated according to the conventional 6-segment cross-sectional LV model. In case of poor tracking, segments were excluded unless adjustment of borders and retracking improved quality. To ensure corresponding segmentation, the same reference point was used as for multidetector computer tomography. In our analyses, 7 short-axes cines were excluded due to poor tag quality. Timing of aortic valve closure was used to determine global end-systole and peak and time-to-peak systolic strains were extracted from all segments. To assess myocardial infarct size by LE MRI, epicardial and endocardial borders were drawn manually. Areas with high pixel intensity were defined as infarcted, and the border between noninfarcted and infarcted myocardium drawn. Total LV myocardial infarct size was calculated by summation of all short-axis slices and expressed as percent total LV myocardial volume. Infarct extent of each of the 12 short-axis segments corresponding to the MDCT analysis was calculated as percent segment area. LV ejection fraction was calculated from multiple untagged short-axis images using dedicated software (QMass 4.2 Medis, The Netherlands).
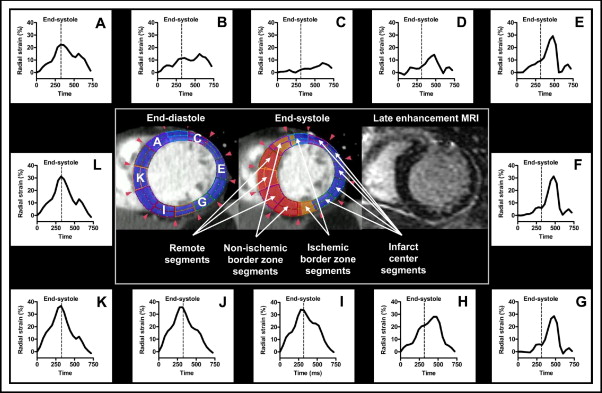
To determine whether radial strain MDCT analyses could detect infarct borders and differentiate between segments of various infarct extents, segments were grouped with reference to infarct location (remote segments, infarct center segments, and infarcted and noninfarcted segments on the 2 sides of the 2 infarct borders; Figures 2 and 3 ) and with reference to infarct extent (noninfarcted segments 0%, nontransmurally infarcted segments 1% to 50%, and transmurally infarcted segments >50%).

To determine inter- and intraobserver variabilities, 1 MDCT short-axis recording was randomly selected from each patient study and radial strain by MTT algorithm was independently analyzed in a blinded fashion (12-segment analysis). Reproducibility was expressed by intraclass correlation and mean difference.
Data are presented as mean ± SD. The relation between segmental radial strain and infarct extent was assessed separately for each patient and for pooled data by the least square linear regression model (SPSS 15.0, SPSS, Inc., Chicago, Illinois). We also used the linear mixed-model statistical method with random intercept to assess the significance of infarct extent in explaining radial strain variations. Different relevant covariance structures were tested and analysis with the lowest Akaike information score was selected. Radial strain data categorized according to transmural extent of infarct and location were also tested by mixed-model analyses. Radial strain measurements obtained by multidetector computer tomography and the reference method were compared by a least squares linear-regression method and by the Bland-Altman method. Statistical differences were considered significant at a p value <0.05.
Results
Because of poor MDCT image quality (implantable cardioverter–defibrillator lead and motion artifacts), 4 patients were excluded from the study. Of the remaining 16 patient recordings, 559 of 576 segments (97%) were analyzed (16 patients × 12 segments × 3 short axes = 576 segments). Mean time from myocardial infarction to MDCT scan was 5 ± 7 years. Mean MDCT radiation dose was 10.8 ± 2.4 mSv. Clinical characteristics and global LV MRI and MDCT data are presented in Table 1 .
| Patient Number | Demographics | Cardiac MRI Data | MDCT Data | Number of Segments According to Transmural Extent of Infarct | ||||||||
|---|---|---|---|---|---|---|---|---|---|---|---|---|
| Age (years)/Sex | Heart Rate (beats/min) | LVEF (%) | LVEDV (ml) | LVESV (ml) | LVSV (ml) | LV Mass (g) | LV Infarct Size (%) | Mean LV Strain (%) | 0% | 1–50% | >50% | |
| 1 | 28/F | 73 | 47 | 204 | 108 | 96 | 136 | 2.4 | 46 | 17 | 13 | 6 |
| 2 | 45/M | 61 | 41 | 234 | 137 | 97 | 221 | 15.1 | 28 | 18 | 10 | 8 |
| 3 | 46/F | 72 | 38 | 226 | 140 | 86 | 139 | 20.4 | 27 | 18 | 9 | 9 |
| 4 | 49/M | 75 | 33 | 275 | 185 | 90 | 182 | 22.8 | 26 | 24 | 12 | 0 |
| 5 | 53/F | 90 | 35 | 212 | 138 | 74 | 153 | 18.4 | 24 | 22 | 10 | 4 |
| 6 | 54/F | 80 | 35 | 200 | 130 | 70 | 143 | 18.5 | 26 | 27 | 3 | 6 |
| 7 | 58/F | 72 | 19 | 247 | 201 | 47 | 145 | 16.7 | 11 | 22 | 8 | 6 |
| 8 | 56/M | 67 | 41 | 205 | 121 | 85 | 148 | 22.5 | 31 | 17 | 10 | 9 |
| 9 | 58/M | 73 | 33 | 342 | 229 | 114 | 179 | 24.1 | 21 | 20 | 11 | 5 |
| 10 | 59/M | 89 | 41 | 256 | 150 | 106 | 242 | 16.6 | 23 | 22 | 9 | 5 |
| 11 | 60/M | 64 | 30 | 281 | 198 | 83 | 226 | 15.2 | 22 | 18 | 16 | 2 |
| 12 | 60/M | 78 | 13 | 317 | 277 | 40 | 185 | 24.9 | 6 | 18 | 14 | 4 |
| 13 | 60/F | 87 | 35 | 195 | 128 | 67 | 144 | 18.7 | 34 | 11 | 19 | 6 |
| 14 | 61/M | 73 | 36 | 217 | 140 | 78 | 152 | 12.1 | 31 | 30 | 6 | 0 |
| 15 | 70/F | 69 | 51 | 146 | 71 | 75 | 153 | 7.5 | 23 | 16 | 17 | 3 |
| 16 | 73/M | 64 | 16 | 323 | 272 | 51 | 200 | 12.0 | 8 | 19 | 10 | 7 |
| Mean ± SD | 56 ± 11 | 74 ± 9 | 34 ± 10 | 243 ± 54 | 164 ± 58 | 79 ± 21 | 172 ± 34 | 17 ± 6 | 24 ± 10 | 20 ± 5 | 11 ± 4 | 5 ± 3 |
Stay updated, free articles. Join our Telegram channel

Full access? Get Clinical Tree


