Coronary lesions of intermediate severity often cause ischemia, and fractional flow reserve (FFR)-guided revascularization for these coronary lesions is safe and effective. FFR derived from coronary computed tomography (FFR CT ) is a noninvasive method for diagnosis of lesion-specific ischemia, but its performance for intermediate stenoses has not been examined to date. We examined the performance of FFR CT versus FFR at the time of invasive angiography in 66 vessels of 60 patients who were identified as having an intermediate stenosis, defined by quantitative coronary angiographic percent diameter stenosis 40% to 69%. Ischemia for FFR CT and FFR was defined as ≤0.80. Diagnostic performance of FFR CT was determined compared to an invasive FFR standard. Mean age of the study group was 63.5 ± 8.1 years (81% men). Thirty-one patients (47%) demonstrated ischemia with an FFR ≤0.80, with 2 of 16 (12.5%), 21 of 37 (56.8%), and 8 of 13 (61.5%) lesions of 40% to 49%, 50% to 59%, and 60% to 69% stenosis causal of ischemia, respectively. At an FFR ≤0.80 cutoff for lesion-specific ischemia, accuracy, sensitivity, specificity, positive predictive value, and negative predictive value of FFR CT were 86.4%, 90.3%, 82.9%, 82.4%, and 90.6%, respectively, with an area under the receiver operator characteristics curve of 0.95 (p <0.001) and good correlation to FFR (0.60, p <0.0001). No biases between FFR CT and FFR were noted by Bland–Altman analysis (0.03 ± 0.12, p = 0.054). In conclusion, FFR CT is a novel noninvasive method for diagnosis of lesion-specific ischemia of coronary lesions of intermediate stenosis severity.
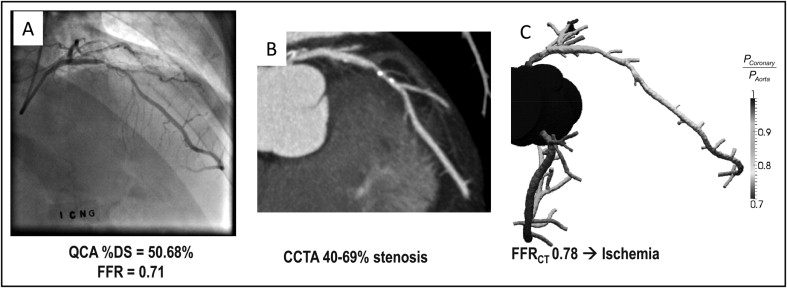
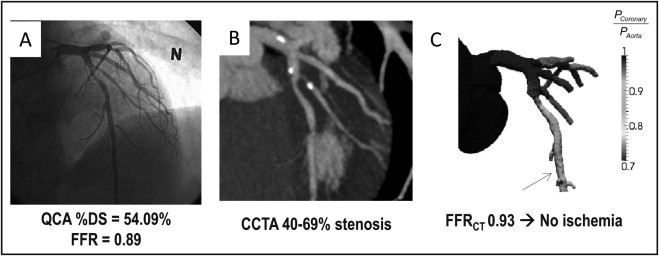
Recently, we reported the results of the Diagnosis of Ischemia-Causing Stenoses Obtained via Noninvasive Fractional Flow Reserve (DISCOVER-FLOW) trial, a prospective multicenter international study that examined the diagnostic accuracy of fractional flow reserve (FFR) derived from coronary computed tomographic angiography [FFR CT ]—a novel technique that applies computational fluid dynamics to coronary computed tomographic angiographic (CCTA) images for prediction of coronary blood flow and pressure—compared to CCTA anatomic stenosis severity for the diagnosis of lesion-specific ischemia, as measured by FFR at the time of invasive coronary angiography (ICA) ( Figures 1 and 2 ) The present study findings represents a subanalysis of DISCOVER-FLOW wherein we examined the performance of FFR CT for the diagnosis of ischemia-causing lesions that are of intermediate, 40% to 69%, stenosis severity, as determined by quantitative coronary angiography (QCA).
Methods
The rationale, design, and overall study results of the DISCOVER-FLOW study have been reported previously. Briefly, DISCOVER-FLOW was conducted on 159 vessels from 103 stable patients with suspected or known coronary artery disease at 4 sites (Seoul National University Hospital, Seoul, Korea; Pauls Stradins University Hospital, Riga, Latvia; Inje University Ilsan Paik Hospital, Goyang, Korea; Stanford University Medical Center, Palo Alto, California; http://www.clinicaltrials.gov , identifier NCT011893331 ). Study subjects underwent coronary computed tomographic angiography and clinically indicated ICA, QCA, and FFR CT . Important exclusion criteria included previous coronary artery bypass surgery and suspected in-stent restenosis.
In the present substudy of DISCOVER-FLOW, to avoid bias potentially introduced by CCTA measurements of stenosis, quantitative coronary angiographically determined intermediate stenosis was used to select patients for inclusion in the study. Intermediate stenosis was defined as a coronary lesion with diameter stenosis ranging from 40% to 69% by QCA. The study protocol was approved by the institutional review boards of each center. The study was funded by HeartFlow, Inc. (Redwood City, California).
Each center performed coronary computed tomographic angiography in accordance to societal guidelines using different vendors’ computed tomographic scanner platforms. Dose-decreasing strategies—including electrocardiographically gated tube current modulation, decreased tube voltage, and prospective axial triggering—were employed whenever feasible. Estimated radiation doses ranged from 3 to 15 mSv.
Coronary computed tomographic angiograms were analyzed by an independent core laboratory (CVCTA, San Francisco, California) blinded to patient characteristics, invasive coronary angiographic, FFR, and FFR CT results in accordance to Society of Cardiovascular Computed Tomography guidelines on CCTA interpretation. CCTA images were evaluated using 3-dimensional image analysis workstations (Vital Images, Minneapolis, Minnesota; Ziosoft, Redwood City, California; Advantage AW Workstation, GE Healthcare, Milwaukee, Wisconsin). Coronary computed tomographic angiograms were visualized by any to all available postprocessing image reconstruction algorithms including axial, multiplanar reformat, maximum intensity projection, cross-sectional analysis, and volume-rendered views. Coronary segments were scored visually in a semiquantitative manner for the presence of coronary plaque using an 18-segment Society of Cardiovascular Computed Tomography coronary artery model. In each coronary segment, coronary atherosclerosis was defined as tissue structures >1 mm 2 that existed within the coronary artery lumen or adjacent to the coronary artery lumen that could be discriminated from surrounding pericardial tissue, epicardial fat, or the vessel lumen. Coronary lesions were quantified for stenosis by visual estimation. Luminal diameter stenosis severity was scored as percent obstruction.
Selective ICA was performed by standard methods in accordance to societal guidelines. A minimum of 2 projections was obtained per major epicardial vessel (left main, left anterior descending, left circumflex, and right coronary arteries). Angles of projection for ICA were optimized for individual patients based on cardiac position. FFR was performed by site investigators. After administration of nitroglycerin, a pressure-monitoring guidewire (PressureWire Certus, St. Jude Medical Systems, Uppsala, Sweden; ComboWire, Volcano Corporation, San Diego, California) was advanced past the stenosis. Hyperemia was attained after administration of intravenous (140 μg/kg/min, n = 51) or intracoronary (50 μg, n = 9) adenosine. The exact position of the distal pressure sensor was recorded to enable the FFR CT to be calculated from the same point as the measured FFR. FFR was calculated automatically by dividing mean distal coronary pressure by mean aortic pressure during adenosine-mediated hyperemia. FFR was considered diagnostic of lesion-specific ischemia at a threshold of ≤0.80 or ≤0.75 on a per-patient and per-vessel basis in keeping with previous study methods.
Quantitative coronary angiograms were analyzed by an independent core laboratory (Yale University School of Medicine, New Haven, Connecticut) blinded to patient characteristics and FFR, CCTA, and FFR CT results. Quantitative analysis was performed using validated planimetry software (CMS, Medis, the Netherlands) for all vessels in which measured FFR and FFR CT comparison was performed, as previously described, with maximal luminal diameter stenosis reported a per-vessel and per-segment basis.
FFR CT was performed by core laboratory scientists at HeartFlow, Inc. (Redwood City, California) blinded to patient, quantitative coronary angiographic, CCTA, and FFR data. Three-dimensional computer models of the coronary artery tree and ventricular myocardium were reconstructed using custom image-processing methods applied to blinded CCTA data. Patient-specific models were built employing computational fluid dynamic analysis methods to simulate at-rest and hyperemic coronary artery blood flow and pressure. FFR CT was defined as computed mean coronary pressure distal to a lesion divided by computed mean blood pressure in the aorta under conditions of simulated maximum hyperemia. An FFR CT ≤0.80 or ≤0.75 was considered diagnostic of lesion-specific ischemia.
To ensure that the FFR CT was being measured at the same point as the FFR, FFR CT core laboratory scientists were instructed as to the anatomic location within a coronary artery where the FFR CT was to be reported; this instruction was given by an independent scientist who interpreted coronary computed tomographic and invasive coronary angiograms but was not involved in invasive coronary angiographic, FFR, or FFR CT analyses. FFR CT core laboratory scientists interpreted all coronary computed tomographic angiograms judged evaluable for luminal diameter stenosis severity by an independent blinded reader in an intent-to-diagnose fashion.
Categorical variables are presented as frequency and percentage and continuous variables as mean ± SD. For each patient and vessel for which FFR was measured, diagnostic performance measurements were determined including sensitivity, specificity, positive predictive value, negative predictive value, and accuracy. Area under the receiver operating characteristics curve was calculated for CCTA stenosis and FFR CT . Pearson rank correlation coefficient was calculated to determine the relation between FFR CT and FFR. Bland–Altman analysis was performed using FFR as the standard of reference. All statistical analyses were performed using SAS 9.2 (SAS Institute, Cary, North Carolina).
Results
Of the 103 patients in the DISCOVER-FLOW study, 60 patients (58%) had 66 lesions with quantitative coronary angiographically confirmed maximal diameter stenosis 40% to 69%. Baseline characteristics of the study population are presented in Table 1 . Mean percent diameter stenosis by QCA was 53.5 ± 7.0%. Among the 66 lesions interrogated by FFR, 31 (47%) were considered ischemic by FFR ≤0.80 and 34 (52%) were considered ischemic by FFR CT . Prevalence of lesions with 40% to 49%, 50% to 59%, and 60% to 69% stenosis and respective prevalence of lesion-specific ischemia at FFR ≤0.80 and ≤0.75 thresholds are listed in Table 2 .
| Variable (n = 60) | Mean ± SD or Frequency (%) |
|---|---|
| Age (years) | 64 ± 8 |
| Men | 46 (81%) |
| Caucasian | 18 (32%) |
| Hypertension | 41 (71%) |
| Hyperlipidemia | 37 (64%) |
| Diabetes | 15 (27%) |
| Current smoker | 14 (38%) |
| Previous myocardial infarction | 8 (14%) |
| Previous percutaneous coronary intervention | 7 (12%) |
| Previous coronary artery bypass grafting | 0 (0%) |
| Left ventricular ejection fraction (%) | 63 ± 5 |
| Systolic blood pressure (mm Hg) ⁎ | 138.8 ± 16 |
| Diastolic blood pressure (mm Hg) ⁎ | 80.1 ± 13 |
| Heart rate (beats/min) ⁎ | 61.7 ± 9 |
| Hemoglobin (g/dl) | 14.0 ± 2 |
| Hematocrit (%) | 41.4 ± 4 |
| Creatinine (mg/dl) | 1.0 ± 0.2 |
| Stenosis Category | All Lesions (n = 66) | Lesions With FFR ≤0.80 | Lesions With FFR ≤0.75 | ||
|---|---|---|---|---|---|
| Frequency (%) | Frequency (%) | p Value | Frequency (%) | p Value | |
| 40%–49% | 16 (24%) | 2/16 (13%) | 0.0061 | 1/16 (6%) | 0.0017 |
| 50%–59% | 37 (56%) | 21/37 (57%) | 13/37 (35%) | ||
| 60%–69% | 13 (20%) | 8/13 (62%) | 8/13 (62%) | ||
Stay updated, free articles. Join our Telegram channel

Full access? Get Clinical Tree


