Stroke prevention in atrial fibrillation (AF) is guided by clinical factors with inadequate predictive power. Most thrombi observed in AF are observed in the left atrial appendage (LAA). This study was designed to determine (1) the association between LAA and the incidence of AF-related stroke and (2) the power of LAA to predict stroke. Patients (n = 48) with a history of AF and stroke were compared with control subjects (n = 48) with a history of AF but no history of stroke. Magnetic resonance images from both case and control populations were manually segmented to determine LAA volume. Patients with a history of stroke had larger LAA mean volumes than control subjects (28.8 ± 13.5 cm 3 vs 21.7 ± 8.27 cm 3 , p = 0.002). Stroke risk is highest in patients with a LAA volume >34 cm 3 (multivariable OR 7.11, p = 0.003). In conclusion, larger LAA volume is associated with stroke in the setting of AF, and this measure can potentially improve risk stratification for stroke risk management in AF patients.
The purpose of this study was to determine if left atrial appendage (LAA) volume was related to an increase risk of previous stroke in the setting of atrial fibrillation (AF) and to further determine how LAA volume may influence therapeutic decision making. The specific aims of this study were to (1) determine the volume of the LAA among patients with AF and a history of stroke compared with AF patients without a history of stroke, (2) identify an LAA volume threshold that significantly increases the risk of stroke in AF patients, and (3) compare the relative predictive value of LAA size compared with the CHADS 2 (congestive heart failure [CHF], hypertension, age, diabetes, and stroke) and CHA 2 DS 2 -VASc (CHF, hypertension, age, diabetes, stroke, vascular disease and sex) models.
Methods
This study was approved by the Intermountain Medical Center institutional review board. The Intermountain Heart Collaborative Registry was crossed with the Intermountain MRI database to identify 48 patients with a history of AF and previous stroke who had undergone cardiac MRI between September 23, 2003, and May 11, 2011, and had sufficient image quality for analysis. The 48 stroke cases were compared with 48 control patients with a history of AF and appropriate MRI but without a history of stroke.
Risk factors for stroke were queried according to the CHADS 2 score criteria. Additional demographics collected from this database included: height and weight, which were used to calculate the body mass index (BMI); history of myocardial infarction (MI); history of peripheral vascular disease (PVD); and hyperlipidemia.
Imaging data was collected from patient magnetic resonance imaging (MRI) scans on a 1.5-T Signa HDxt MR scanner (GE Healthcare, Milwaukee, Wisconsin). The standard department protocol that was used for all MRI acquisitions began with initial cardiac localization from multislice axial scans using a FIESTA (fast imaging employing steady state acquisition) sequence. Next, a bolus tracker was placed in the ascending aorta just proximal to the aortic arch so that a test bolus of approximately 5 ml gadopentetate dimeglumine (Magnevist) could generate a time-intensity curve. Next, the MRI was focused on the left atrium and surrounding structures and performed during the administration of 30 ml gadopentetate dimeglumine (Magnevist). Each patient received a dose of 30 ml so that a brighter bolus rather than a weight-based bolus could be achieved. A recent glomerular filtration rate, within 6 weeks of scan, was used to evaluate contrast use if the patients were in the following criteria: diabetic, age >60 years, hypertensive, single kidney, or renal insufficiency. Contrast was not given to patients with a glomerular filtration rate <30 ml/min. Patients who did not receive contrast were not included in the analysis. Finally, a 3-dimensional fast time-of-flight spoiled gradient recalled pulse sequence with coronal slab volume imaging was acquired during held inspiration at bolus detection (approximately 22 to 24 seconds). Scan parameters included the following: field of view 46 cm, time to fractional echo 1.28 milliseconds, repetition time 4.602 milliseconds, receiver bandwidth 63.87 kHz, flip angle 45°, minimum echo time 1.3 milliseconds, and minimum repetition time 4.6 milliseconds. The scan typically contained 90 to 100 slices with z axis slice thickness of 2 mm and x and y axis pixel spacing of 0.8984 mm in a matrix size of 256 × 128.
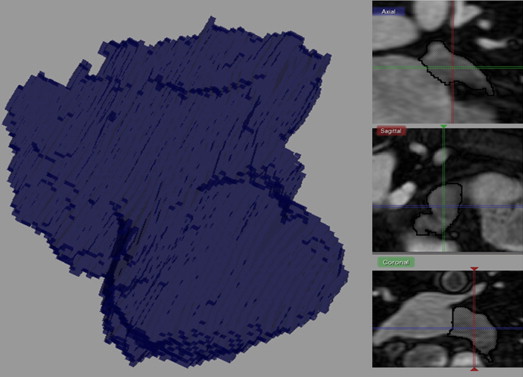
DICOM MRI data were imported into Seg 3D, a segmentation and processing tool developed by the National Institutes of Health Center for Integrative Biomedical Computing at the University of Utah Scientific Computing and Imaging Institute. A single technologist performed the rigorous tracing cursor method to manually segment volume filled views of the LAA using Seg 3D. The accuracy of the analysis was scrutinized using orthogonal slice view windows of each region of interest for the entire volume. The window center was varied by slice at approximately 600 and the window width at approximately 1,200. The ostium of the LAA was defined as the site of reflection of this structure with the surrounding left atrial wall. The proximal boundary was approximately aligned along the mitral valve plane. The total number of pixels selected was multiplied by the voxel dimensions (2.0 × 0.9 × 0.9 mm) to convert to units of volume (cubic centimeters). An example of the analysis technique is represented in Figure 1 .
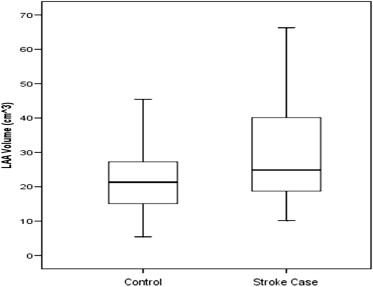
Patient baseline demographics were analyzed using the SPSS statistics software package (Version 15.0). The continuous variable, LAA volume, was expressed with means ± SD, and tests of normal distribution were performed to describe their frequencies and distributions. An unpaired t test was used to compare LAA volume differences and other continuous variables between the cases and controls ( Table 1 ). A box plot, of the volume means, was generated to compare the 2 groups ( Figure 2 ). Categorical variables were entered into 2 × 2 crosstab tables and compared with the Pearson chi-square test. A multiple logistic regression model was used to assess LAA volume as a predictor of stroke compared with CHADS 2 and CHA 2 DS 2 -VASc variables, and odds ratio (OR) were calculated for these variables ( Table 2 ). A receiver operator characteristic (ROC) curve was computed for the completed model, and a probability threshold was chosen for the likelihood of predicting stroke based on LAA volume ( Figure 3 ). The resulting sensitivity and specificity were also estimated. These results were used to create a bar graph comparing LAA volume by quintiles ( Figure 4 ).
| Variables | Cases (n = 48) | Controls (n = 48) | p Value |
|---|---|---|---|
| Previous stroke or TIA | 48 (100%) | 0 (0%) | — |
| Mean LAA Volume | 28.8 ± 13.5 | 21.7 ± 8.27 | 0.0024 |
| Age (yrs) | 70.0 ± 8.7 | 64.8 ± 8.7 | 0.0045 |
| Male | 31 (65%) | 29 (60%) | 0.67 |
| Female | 17 (35%) | 19 (40%) | |
| Heart failure | 38 (79%) | 31 (65%) | 0.11 |
| Hypertension | 44 (92%) | 38 (79%) | 0.08 |
| Diabetes mellitus | 11 (23%) | 11 (23%) | 1.00 |
| MI | 15 (31%) | 5 (10%) | 0.012 |
| BMI (kg/m 2 ) | 28.2 ± 4.5 | 31.0 ± 5.6 | 0.0069 |
| PVD | 25 (52%) | 12 (25%) | 0.006 |
| Hyperlipidemia ∗ | 39 (81%) | 33 (69%) | 0.16 |
| CHADS 2 | 4.29 ± 0.99 | 1.83 ± 1.06 | <0.001 |
| CHAD † | 2.29 ± 0.99 | 1.83 ± 1.06 | 0.031 |
| CHADS-VASc | 6.04 ± 1.66 | 3.04 ± 1.60 | <0.001 |
| CHAD-VASc † | 4.04 ± 1.66 | 3.04 ± 1.60 | 0.003 |
∗ Hyperlipidemia was defined as a total cholesterol level ≥200 mg/dl, a low-density lipoprotein level ≥130 mg/dl, or use of cholesterol-lowering medication.
| Variables | Univariable OR (95% CI) | p Value | Multivariable OR (95% CI) | p Value |
|---|---|---|---|---|
| Mean LAA volume > 34.1 cm 3 | 6.03 (1.85–19.67) | 0.003 | 7.11 (1.91–26.45) ∗ | 0.003 |
| Mean LAA volume (per +10 cm 3 ) | 1.82 (1.21–2.76) | 0.004 | 1.88 (1.18–2.94) † | 0.007 |
| BMI (per +5 kg/m 2 ) | 0.57 (0.37–0.87) | 0.010 | 0.60 (0.37–0.99) † | 0.043 |
| Age | ||||
| 65–74 yrs | 1.78 (0.70–4.51) | 0.23 | — † | — |
| ≥75 yrs | 3.62 (1.24–10.54) | 0.019 | 1.48 (0.46–4.74) † | 0.51 |
| MI | 3.91 (1.29–11.85) | 0.016 | 2.40 (0.68–8.48) † | 0.17 |
| PVD | 3.26 (1.37–7.74) | 0.007 | 2.34 (0.87–6.26) † | 0.09 |
| Hypertension | 2.89 (0.84–9.98) | 0.09 | 2.24 (0.54–9.40) † | 0.27 |
| Heart Failure | 2.08 (0.84–5.20) | 0.12 | — † | — |
| Hyperlipidemia | 1.97 (0.76–5.08) | 0.16 | — † | — |
| Gender (male) | 1.19 (0.52–2.73) | 0.67 | — † | — |
| Diabetes | 1.00 (0.39–2.59) | 1.00 | — † | — |
| CHAD (per +1 point) ‡ | 1.56 (1.03–2.35) | 0.034 | 1.52 (0.98–2.35) § | 0.06 |
| CHA 2 D-VASc (per +1 point) ‡ | 1.46 (1.12–1.91) | 0.005 | 1.41 (1.07–1.86) § | 0.016 |
Stay updated, free articles. Join our Telegram channel

Full access? Get Clinical Tree


