Novel high-sensitivity assay can detect very low levels of circulating cardiac troponin (hs-cTnT) in apparently healthy subjects. Within normal range, higher levels are associated with coronary artery disease (CAD) and cardiac abnormalities commonly associated to traditional risk factors (RFs) for CAD. Therefore, we investigated the relation between circulating hs-cTnT and CAD in patients with a spectrum of RF burden aiming to assess the added value of hs-cTnT to identify “outlier” patients with CAD despite a low RF burden. Hs-cTnT was measured in 525 stable patients without previous diagnosis of ischemic heart disease with 0 to 1 RF, excluded diabetes, (low-RF group, n = 263) or ≥2 RFs (multiple-RF group, n = 262) and without CAD (segment involvement score = 0) or diffuse CAD (segment involvement score >5) at coronary computed tomography angiography. Outlier patients with diffuse CAD despite low-RF burden had similar extent, severity, and plaque composition than patients with multiple RFs. Overall, hs-cTnT was measurable in 81% of patients with median value of 6.0 ng/L. In both groups, hs-cTnT concentration was higher in patients with CAD than in patients with normal coronary arteries (p <0.0001). Hs-cTnT was more accurate to detect patients with CAD in the low-RF group than in the multiple-RF group (p = 0.04). In multivariate analysis, higher level of hs-cTnT (>6 ng/L) was independently associated with CAD in low-RF group only. Despite very low circulating concentrations, hs-cTnT may identify with a good accuracy the outlier patients with diffuse CAD despite low-RF burden.
Coronary artery disease (CAD) is a leading cause of death, despite continuous improvement of prevention and treatment. The risk of coronary events is traditionally predicted by multifactorial stratification methods that integrate traditional risk factors (RFs). Such assessment is useful to estimate the mean cardiovascular risk in a population but it has limitations because of individual variability. Coronary computed tomography angiography (CCTA) is a comprehensive noninvasive diagnostic test that provides information about the presence, extent, and severity of CAD, vascular wall, remodeling process, and plaque characteristics. It enables to identify subjects with normal coronary arteries (high negative predictive value) or with subclinical disease and better define the global atherosclerotic process. An approach based on direct assessment of coronary atherosclerosis may compliment traditional RF-based assessment. Furthermore, CCTA allows to identify “outlier” patients with unexpected diffuse CAD despite a low RF profile and those who develop only mild or no coronary atherosclerosis with multiple RFs. These outlier populations have been specifically investigated in the Coronary Atherosclerosis in outlier subjects: Protective and novel Individual Risk factors Evaluation study, a hypothesis-generating study aimed at exploring novel protective and susceptibility factors of CAD to effectively identify subjects at high risk who may benefit of more personalized prevention strategy. Novel high-sensitivity assays for cardiac troponin (hs-cTnT) detect very low levels in apparently healthy subjects with CAD. Therefore, in the current analysis, we investigated the relation between circulating hs-cTnT and extensive CAD documented by CCTA in patient with different RFs burden to assess the independent predictive value of hs-cTnT for the identification of CAD in outlier patients who presented low traditional RF burden for cardiovascular disease and diffuse CAD.
Methods
From January 2011 to June 2013, 525 consecutive patients without acute coronary syndrome and with normal left ventricular ejection fraction were recruited. The population was enrolled in men and women aged 45 to 75 years who, in the absence of any previous clinical manifestations of ischemic heart disease, underwent 64-slice (or superior) CCTA for suspected CAD, according to current clinical indications. Based on CCTA result and risk profile, the population was divided into 4 groups:
- –
No-CAD/low RF: subjects with no CAD and 0 to 1 RF with the exclusion of patients with type 1 or type 2 diabetes mellitus as single RF;
- –
CAD/low RF: subjects with diffuse CAD extended to >5 of the 16 segments defined by the American Heart Association classification and 0 to 1 RF with the exclusion of patients with type 1 or type 2 diabetes mellitus as single RF;
- –
No CAD/multiple RF: subjects with no CAD and ≥2 RFs; and
- –
CAD/multiple RF: subjects with diffuse CAD extended to >5 segments and ≥2 RFs.
Patients were excluded if CCTA did not meet the quality control criteria, or in case of previous cardiovascular events (acute myocardial infarction, unstable angina, chronic stable angina, previous percutaneous or surgical coronary revascularization, and heart failure), dilated cardiomyopathy regardless of etiology, obstructive hypertrophic cardiomyopathy, atrial fibrillation, myocarditis, inflammatory vascular disease, previous documented acute or chronic peripheral vascular disease, active inflammatory, or neoplastic disease. The protocol was approved by local ethical committee of each participant site, and all patients provided an informed consent.
RFs included a family history of CAD (history of early manifestations of CAD in first-degree relatives, with onset <55 year old for men and <65 year old for women), systemic hypertension (history of arterial hypertension, ongoing antihypertensive treatment or recent observation of blood pressure values >140/90 mm Hg), hypercholesterolemia (total cholesterol values >200 mg/dl or <200 mg/dl with ongoing lipid-lowering medications), diabetes mellitus (fasting plasma blood glucose levels >126 mg/dl or 2-hour values in the oral glucose tolerance test of ≥200 mg/dl or isolated elevation of glycated hemoglobin ≥6.5% or current use of insulin or oral hypoglycemic agents), and cigarette smoking (current cigarette smoker or recent abstention [<1 year]).
The source of data for defining cardiovascular RFs was physical examination, anamnestic records and laboratory tests reported by the subject or documented before CCTA.
After the enrollment, a centrally performed biomarker profile including lipid profile and metabolic markers allowed to validate the local assessment of RFs such as diabetes or hypercholesterolemia.
Coronary atherosclerotic plaque was defined as any clearly discernible structure that could be assigned to the coronary artery wall and discriminated from surrounding pericardial tissue and epicardial fat. Normal coronary arteries were defined if no atherosclerotic plaque (including focal and eccentric calcified plaques) could be detected in any segment within the coronary artery wall or lumen. A cutoff of 5 coronary segments involved was established to define diffuse CAD in accordance with previous studies on the prognostic value of CCTA.
Patients satisfying the inclusion criteria had a structured interview concerning conventional RFs, medical history, previous cardiovascular examinations, and ongoing therapies. During the enrollment visit, anthropometric data and blood pressure were recorded as well as a rest 12-lead electrocardiogram, questionnaires on psychosocial factors (Hospital Anxiety and Depression Scale-Anxiety, Hospital Anxiety and Depression Scale-Depression, and Type D Scale-14) and dietary habits.
All patients had a peripheral venous blood sample taken at baseline and after 2 years of follow-up. The samples were immediately processed to obtain separate aliquots of whole blood, plasma, and serum and stored at −70°C in a dedicated biological bank (SAmples sTUdy Repository NEgri-1, Mario Negri Institute of Pharmacological Research, Milan).
All circulating biomarkers were measured in a central laboratory, in a single batch, by personnel unaware of patients’ characteristics. High-sensitivity cardiac troponin T (hs-cTnT) was measured on an automated platform (ECLIA Cobas e411; Roche Diagnostics, Rotkreutz, Switzerland) with a limit of blank of 3 ng/L. Plasma levels of pentraxin-3 were measured by in-house sandwich enzyme-linked immunosorbent assay as previously described. Detection limit was 0.1 ng/ml. High-sensitivity C-reactive protein was measured with an automatic immunoturbidimetric method (Beckman Coulter, Galway, Ireland). Serum creatinine and lipids were measured with standard, automated laboratory methods.
Continuous normally distributed variables were compared using the Student t test for independent samples and the analysis of variance for repeated measurements. When the distribution was not normal, the Mann–Whitney U tests for independent samples and Wilcoxon test for repeated measurements were used. The proportion of categorical variables was compared using a chi-square analysis or Fisher’s exact test. A p value <0.05 was considered statistically significant. Estimated odds ratios (ORs) with 95% CIs were presented for each class of the variables that were significant at the univariate analysis.
Multivariate logistic regression analysis was also performed to identify the independent predictors of CAD. The multivariate model was created including all the variables with a probability value of <0.05 in the univariate analysis. The calculated risk of CAD from multiple logistic model was compared with the observed outcome with the area under the receiver operating characteristic curve. Statistical analysis and graphics were produced with SAS, version 11 (SAS Institute Inc. 2013, Cary, North Carolina) and JMP software, version 11.0.0 (SAS Institute Inc., Cary, North Carolina). Comparison of area under the receiver operating characteristic curve was performed by MedCalc statistical software, version 12.3.0 (MedCalc Software bvba, 2013, Ostend, Belgium).
Results
The study population consisted of 525 patients: 263 in the low-RF group and 262 in the multiple-RF group. Age and gender distribution were similar in the 2 groups. Patients with low RF had lower body mass index, and concentrations of high-density lipoprotein (HDL)–cholesterol, triglycerides, and C-reactive protein ( Table 1 ).
| Variable | Low RF (n. 263) | Multiple RF (n. 262) | p |
|---|---|---|---|
| Age, mean (SD) (years) | 59.1 (8.7) | 60.0 (8.0) | 0.2 |
| Men | 60.1% | 56.1% | 0.37 |
| BMI, mean (SD) (Kg/m 2 ) | 25.5 (3.8) | 27.7 (4.3) | <0.0001 |
| Family History of CAD | 6.8% | 56.1% | <0.0001 |
| Systemic Hypertension | 23.6% | 81.7% | <0.0001 |
| Dyslipidemia | 46.8% | 96.6% | <0.0001 |
| Current smoker | 4.9% | 46.6% | <0.0001 |
| Diabetes Mellitus | 0% | 24.8% | <0.0001 |
| Systolic BP mean (SD) (mm Hg) | 125.8 (13.6) | 131.5 (16.3) | <0.0001 |
| Treated hypertension | 77.8% | 88.3% | 0.035 |
| Antiplatelets | 15.4% | 35.5% | <0.0001 |
| Statins | 9.8% | 51.9% | <0.0001 |
| Total Cholesterol, mean (SD) (mg/dL) | 193.5 (37.7) | 200.9 (45.7) | 0.04 |
| LDL-Cholesterol, mean (SD) (mg/dL) | 119.5 (31.6) | 124.1 (36.3) | 0.117 |
| HDL-Cholesterol, mean (SD) (mg/dL) | 52.8 (15.4) | 49.4 (14.2) | 0.0098 |
| Triglycerides, median (IQR) (mg/dL) | 76 (58-114) | 113 (80-172) | <0.0001 |
| Glycated Hemoglobin, median (IQR) (%) | 3.4 (3.1- 3.7) | 3.7 (3.3- 4.2) | <0.0001 |
| C-reactive Protein, median (IQR) (mg/L) | 1.2 (0.6-3.0) | 1.8 (0.8-4.6) | 0.0007 |
| Pentraxin 3, median (IQR) (ng/mL) | 3.3 (2.2-4.9) | 3.1 (2.0-4.9) | 0.17 |
| Serum Creatinine, mean (SD) (mg/dL) | 0.83 (0.18) | 0.83 (0.18) | 0.93 |
| hs-Troponin T, median (IQR) (ng/L) | 6.0 (4.8-7.7) | 6.0 (4.7-8.6) | 0.78 |
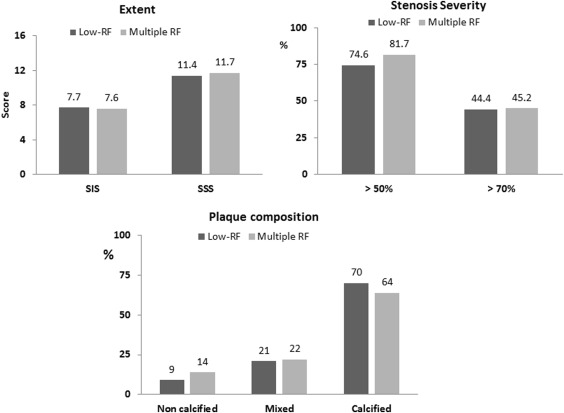
Extent of coronary atherosclerosis, stenosis severity, and plaque composition documented by CCTA were similar, regardless RFs ( Figure 1 ).

Table 2 lists the clinical characteristics and laboratory data of low-RF and multiple-RF groups stratified by CCTA-detected CAD. In the low-RF groups, RF distribution was similar in patients with or without CAD. Diabetes was more prevalent and mean systolic blood was higher in CAD/multiple-RF group than in patients with no CAD/multiple RF; the prevalence of arterial hypertension was similar. In both groups, patients with CAD were older and more frequently men, they had lower HDL cholesterol and higher serum creatinine levels. Total cholesterol and low-density lipoprotein values were dependent on the prevalence of statin treatment in each group. C-reactive protein and pentraxin-3 levels were similar in groups.
| Variable | Low RF | Multiple RF | ||||
|---|---|---|---|---|---|---|
| No CAD (n. 200) | CAD (SIS>5) (n. 63) | p | No CAD (n. 147) | CAD (SIS>5) (n. 115) | p | |
| Age, mean (SD) (years) | 57.6 ± 8.6 | 63.6 ± 7.6 | <0.0001 | 57.8 ± 8.1 | 62.9 ± 6.9 | <0.0001 |
| Men | 49.5% | 93.7% | <0.0001 | 42.2% | 73.9% | <0.0001 |
| BMI, mean (SD) (Kg/m 2 ) | 25.1 ± 3.7 | 26.8 ± 4.1 | 0.0031 | 27.1 ± 4.0 | 28.3 ± 4.5 | 0.025 |
| Family History of CAD | 7.0% | 6.4% | 0.86 | 59.2% | 52.2% | 0.26 |
| Systemic Hypertension | 21.0% | 31.8% | 0.09 | 77.6% | 86.9% | 0.06 |
| Dyslipidemia | 48.0% | 43.0% | 0.48 | 97.3% | 95.7 | 0.47 |
| Current smoker | 4.5% | 6.4% | 0.56 | 42.9% | 51.3% | 0.17 |
| Diabetes Mellitus | 0% | 0% | – | 19.7% | 31.3% | 0.031 |
| Systolic BP mean (SD) (mm Hg) | 125.1 ± 13.5 | 128.3 ± 13.4 | 0.09 | 128.1 ± 14.7 | 135.9 ± 17.3 | 0.004 |
| Statins | 9.0% | 12.3% | 0.43 | 46.3% | 59.1% | 0.038 |
| Total Cholesterol, mean (SD) (mg/dL) | 195.2 ± 39.3 | 188.0 ± 31.8 | 0.14 | 210.5 ± 44.5 | 188.7 ± 44.5 | 0.0001 |
| LDL-Cholesterol, mean (SD) (mg/dL) | 119.3 ± 32.5 | 120.0 ± 28.9 | 0.86 | 128.7 ± 34.9 | 118.3 ± 37.4 | 0.0227 |
| HDL-Cholesterol, mean (SD) (mg/dL) | 55.2 ± 16.0 | 45.0 ± 9.7 | <0.0001 | 52.5 ± 15.1 | 45.5 ± 12.1 | <0.0001 |
| Triglycerides, median (IQR) (mg/dL) | 73 (54-105) | 104 (72-142) | 0.0032 | 111 (76-178) | 115 (84-165) | 0.62 |
| Glycated Hemoglobin, median (IQR) (%) | 3.4 (3.2-3.8) | 3.4 (3.2-3.7) | 0.98 | 3.5 (3.2-3.9) | 3.9 (3.4- 4.4) | <0.0001 |
| C-reactive Protein, median (IQR) (mg/L) | 1.2 (0.5-2.7) | 1.5 (0.5-4.6) | 0.194 | 1.7 (0.8-4.4) | 2.4 (0.9-5.8) | 0.138 |
| Pentraxin 3, median (IQR) (ng/mL) | 3.2 (2.1-4.8) | 3.4 (2.5-5.7) | 0.39 | 3.0 (1.9-5.3) | 3.2 (2.1-4.9) | 0.96 |
| Serum creatinine, mean (SD) (mg/dL) | 0.80 ± 0.16 | 0.91 ± 0.2 | 0.0003 | 0.80 ± 0.18 | 0.87 ± 0.18 | 0.004 |
| hs-cTnT <3.0 ng/L | 29% | 4.8% | <0.0001 | 18.4% | 10.4% | 0.073 |
| hs-cTnT, median (IQR) (ng/L) | 5.7 (4.6-7.2) | 7.1 (5.7-9.8) | <0.0001 | 5.2 (4.3-7.7) | 6.7 (5.3-10.0) | <0.0001 |
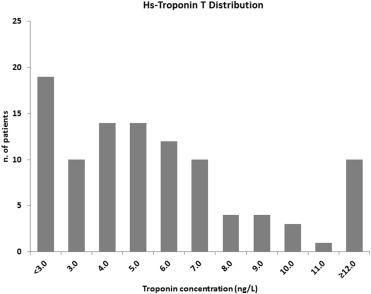
In the overall population, hs-cTnT was detectable in 425 patients (81%) with a median concentration of 6.0 ng/L, and a 99th percentile at 34 ng/L, close to the detection limit of 0.03 ng/ml of the conventional cTnT troponin assay ( Figure 2 ). Hs-cTnT <3 ng/L resulted in 23.2% of the patients in low-RF group and in 14.9% in multiple-RF group (p = 0.019); the median hs-cTnT concentrations did not differ between the 2 groups. Undetectable hs-cTnT was more frequent in the no-CAD/low-RF group than in the CAD/low-RF group (29% vs 4.8%, p <0.0001; OR 8.4, 95% CI 2.9 to 35.2). In the multiple-RF groups, the proportion of patients with undetectable hs-cTnT was similar; the median hs-cTnT values were significantly higher in patients with CAD/multiple-RF.

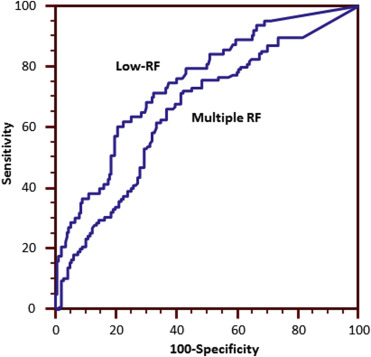
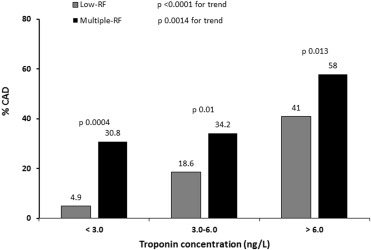
When considered as a continuous variable, hs-cTnT was more accurate to detect patients with CAD in the low-RF group than in the multiple-RF group (area under the curve, 95% CI 0.750, 0.60 to 0.80 vs 0.65, 0.59 to 0.71; respectively, p 0.04; Figure 3 ). Considering hs-cTnT as a categorical variable (undetectable, below and above the median level of 6 ng/L), the prevalence of patients with coronary atherosclerosis tended to significantly increase. Noteworthy, the prevalence of coronary atherosclerosis in patients with low RF and undetectable hs-cTnT was very low ( Figure 4 ).


In univariate analysis with undetectable hs-cTnT as a reference group, there was an increased risk for CAD in patients with troponin levels below or above 6 ng/L in the low-RF group, whereas in multiple-RF group, only values >6 ng/L were associated with significantly higher OR for coronary atherosclerosis.
The diagnostic value of measurable levels of hs-cTnT (>3 ng/L) to exclude the presence of CAD was significantly higher in the low-RF group (Negative predictive value 95.1% [86.3% to 99.0%]) than in the multiple-RF group (Negative predictive value 69.2% [52.4% to 83.0%], p <0.05; Supplementary Table 1 ).
As listed in Table 3 , age, gender, body mass index, HDL-cholesterol, hs-cTnT, and serum creatinine levels were associated with CAD and included in a multivariate logistic regression model. After adjustment, hs-cTnT remained independently associated with CAD only in low-RF group, whereas age and gender were independently associated with CAD in both groups.
| Variable | Low RF | Multiple RF | |||||||||||
|---|---|---|---|---|---|---|---|---|---|---|---|---|---|
| Univariate | Multivariate | Univariate | Multivariate | ||||||||||
| OR | 95% CI | P value | OR | 95% CI | p value | OR | 95% CI | p value | OR | CI | p value | ||
| Age (years) | |||||||||||||
| < 55 | Ref. | Ref | Ref. | Ref | |||||||||
| 55-64 | 3.61 | 1.61-8.54 | 0.0016 | 5.77 | 2.26-15.82 | 0.0002 | 4.23 | 2.17-8.58 | <0.0001 | 3.71 | 1.77-8.05 | 0.0004 | |
| ≥ 65 | 5.20 | 2.45-11.91 | <0.0001 | 7.29 | 2.81-20.46 | <0.0001 | 4.82 | 2.47-9.80 | <0.0001 | 6.20 | 2.83-14.27 | <0.0001 | |
| Gender | |||||||||||||
| Male | Ref. | Ref | Ref. | Ref | |||||||||
| Female | 0.07 | 0.02-0.17 | <0.0001 | 0.03 | 0.01-0.13 | <0.0001 | 0.26 | 0.15-0.43 | <0.0001 | 0.18 | 0.08-0.38 | <0.0001 | |
| BMI (Kg/m 2 ) | |||||||||||||
| < 25 | Ref. | Ref | Ref. | Ref | |||||||||
| 25-29.9 | 1.69 | 0.90-3.22 | 0.11 | – | – | ns | 2.10 | 1.16-3.91 | 0.015 | – | – | ns | |
| ≥ 30 | 2.65 | 1.18-5.85 | 0.018 | – | – | ns | 1.98 | 1.00-4.00 | 0.052 | – | – | ns | |
| HDL-cholesterol (mg/dl) | |||||||||||||
| ≤ 50 | Ref. | Ref | Ref. | Ref. | |||||||||
| > 50 | 0.25 | 0.13-0.46 | <0.0001 | 0.28 | 0.12-0.62 | 0.0017 | 0.51 | 0.31-0.85 | 0.0092 | – | – | ns | |
| hs-cTnT(ng/L) | |||||||||||||
| ≤ 3.0 | Ref. | Ref | Ref. | Ref. | |||||||||
| 3.0-6.0 | 4.43 | 1.43-19.45 | 0.0081 | 2.81 | 0.77-13.68 | 0.124 | 1.17 | 0.54-2.64 | 0.69 | – | – | ns | |
| > 6.0 | 13.44 | 4.55-57.64 | <0.0001 | 6.72 | 1.81-33.29 | 0.0035 | 3.11 | 1.46-6.97 | 0.003 | – | – | ns | |
| Serum creatinine ∗ (mg/dl) | |||||||||||||
| ≤ 0.73 | Ref. | Ref. | Ref. | Ref. | |||||||||
| 0.73-0.91 | 2.08 | 0.99-4.55 | 0.0546 | – | – | ns | 2.36 | 1.29-4.35 | 0.0050 | – | – | ns | |
| > 0.91 | 3.13 | 1.52-6.76 | 0.0018 | – | – | ns | 1.90 | 1.03-3.54 | 0.0385 | – | – | ns | |
Stay updated, free articles. Join our Telegram channel

Full access? Get Clinical Tree


