The aim of the present study was to evaluate, in patients with hypertrophic cardiomyopathy (HC), the association between late gadolinium enhancement and clinical end points, such as nonsustained ventricular tachycardia, arrhythmic risk factors, New York Heart Association class, symptoms, and left ventricular functional parameters. A total of 20 normal subjects (mean age 38 years, 16 men) and 100 patients with HC (mean age 46 years, 70 men) were enrolled in the present study. In the late gadolinium enhancement images, the extent of unenhanced, mildly enhanced, and higher enhanced myocardium was measured. Higher enhancement was present in 80% of the HC population and was significantly greater in patients with a New York Heart Association class >1. Mild enhancement was present in all the patients with HC. Receiver operating characteristic analysis revealed that a cutoff of >4.9% of mild enhancement had 100% sensitivity and 86% specificity to predict the occurrence of nonsustained ventricular tachycardia, and a cutoff of >2.4% of hyperenhancement had 77% sensitivity and 96% specificity. In conclusion, late gadolinium enhancement was associated with nonsustained ventricular tachycardia, arrhythmic risk factors, and worse New York Heart Association class.
Magnetic resonance imaging with late gadolinium enhancement (LGE) can identify areas of myocardial fibrosis in patients with hypertrophic cardiomyopathy (HC). The detection of myocardial fibrosis in patients with HC is clinically relevant, because it has been associated with the incidence of cardiac arrhythmias, coronary microvascular dysfunction, progression toward heart failure, and poor outcomes. The purpose of the present study was to evaluate the relation in HC between LGE and clinical end points, such as nonsustained ventricular tachycardia (NSVT), arrhythmic risk factors, and New York Heart Association (NYHA) class.
Methods
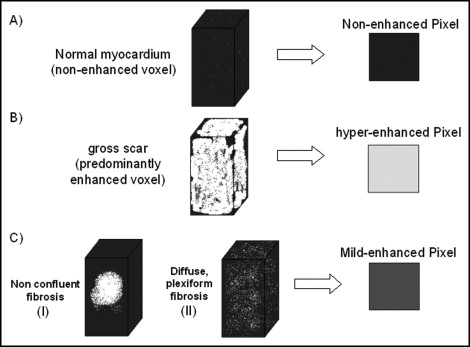
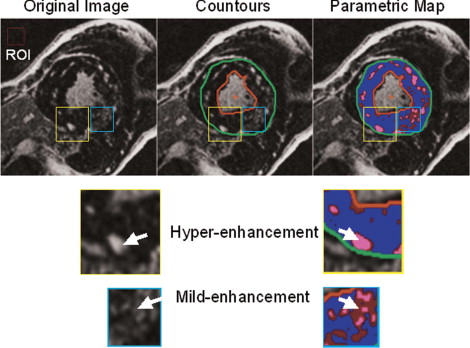
A total of 100 consecutive patients with HC (70 men, mean age of 46 ± 16 years) were enrolled in the present study. The diagnosis of HC was determined using previously reported criteria. An additional 20 healthy, normal subjects (14 men, mean age of 48 ± 10 years) were enrolled as a control group. The internal ethical committee of the institute approved the study. A number of clinical features generally accepted as markers of increased risk of sudden death in patients with HC were evaluated: family history of sudden death, extreme left ventricular (LV) wall thickness (≥30 mm), unexplained (nonvasovagal) syncope, and NSVT on ambulatory electrocardiographic Holter recordings (≥4 ventricular beats). By clinical interrogation, each patient was classified in a NYHA class on the basis of the presence and severity of dyspnea. The history of other symptoms (syncope, chest pain, palpitation) was also recorded. A 12-lead resting electrocardiogram was recorded on the day of the magnetic resonance imaging examination. The diastolic pattern of transmitral flow was evaluated by echocardiography. LV outflow tract obstruction (gradient ≥30 mm Hg) was evaluated by echocardiography. Magnetic resonance imaging examination was performed using a 1.5 T whole body scanner (CVi, HD release, GE Healthcare, Milwaukee, Wisconsin). An 8-element (4 anterior and 4 posterior) cardiac-phased array receiver surface coil was used for signal reception. The functional parameters of the left ventricle were obtained by acquiring short-axis views as steady-state free precession (FIESTA) images with the following parameters: 400 mm field of view, 8-mm slice thickness, no gap, 1 number of excitations, 12 views/segment, excitation time/repetition time 1.6/3.2 ms, flip angle 45°, and matrix 224 × 192. Delayed enhancement images were acquired with an inversion recovery gradient echo pulse sequence, 10 minutes after injection of contrast media (gadolinium-diethylenetriamine pentaacetic acid, 0.2 mmol/kg), in the short axis covering the entire left ventricle from the mitral valve plane to the ventricular apex. The following parameters were used: 400 mm field of view, 8 mm slice thickness, no gap between each slice, repetition time 4.6 ms, echo time 1.3 ms, flip angle 20°, acquisition matrix 224 × 192, and inversion time optimized to nullify normal myocardium (range 240 to 300 ms). The LGE myocardium was subdivided into 2 regions with different levels of enhancement: mild and higher enhancement. Myocardial fibrosis in HC is heterogeneous, consisting of both replacement fibrosis secondary to myocardial cell death (gross scar) and plexiform fibrosis (interstitial fibrosis) associated with fiber disarray. In terms of magnetic resonance imaging, gross scarring and interstitial fibrosis can generate different signals when the LGE technique is used. As shown in Figure 1 , higher enhancement is evident when the largest portion of the total voxel volume is occupied by enhanced tissue. Mild enhancement is observed in predominantly enhanced tissue in which a significant amount of the remaining volume is occupied by unenhanced tissue and potentially normal myocardium. Thus, mild enhancement could represent either a small island of confluent fibrosis inside unenhanced myocardium or a volume of tissue with plexiform fibrosis associated with disarray. This subdivision was performed by 2 independent expert investigators using the following method. A region of interest was selected in the background of the image. The mean signal intensity and SD of this region of interest were measured. The LV myocardium was delimited by endocardial and epicardial contours traced manually. LGE was defined as myocardium with a signal intensity of ≥6 SDs greater than the mean of the region of interest. The choice of 6 SDs as a fixed cutoff was made according to previously published findings. Inside the LGE region, the areas of mild and higher enhancement were marked with 2 colors to obtain a simplified parametric map of the original image ( Figure 2 ). Although the intensity cutoff for LGE was kept at a fixed value, the signal intensity cutoff between mild and higher enhancement was progressively increased from 7 SDs to 20 SDs, in 1-SD increments. We chose the optimal cutoff value when the areas of mild and higher enhancement in the parametric map best matched their interpretation of the original image. When the 2 investigators were in complete agreement regarding the chosen cutoff value, the extent of mild and higher enhancement was directly measured. Any discrepancies between the 2 investigators in the choice of the appropriate cutoff value were settled by a third independent investigator. This analysis was performed for each set of images acquired from any single patient. In the control group, higher enhancement was not detected, and mild enhancement was detected in 4 patients, with a mean extent of 0.2 ± 0.4%, probably owing to signal noise. Thus, mild enhancement was defined as undetected when it measured <0.5% of the LV mass, and higher enhancement was defined as undetected when it measured <0.1% of LV mass. The extent of mild and higher enhancement are expressed as a percentage of the LV mass to minimize variability linked to gender, age, and body weight. All data were analyzed using JMP software, version 4.0 (SAS Institute, Cary, North Carolina). The data are presented as continuous variables and proportions (percentages). Continuous variables are expressed as the mea ± SD. Two-way analysis of variance was used when appropriate. p Values <0.05 were considered statistically significant. Receiver operating characteristic curves were used to evaluate the specificity and sensitivity of mild enhancement and higher enhancement to predict NSVT in the population. Multiple regression analysis with a stepwise method was used to evaluate the independent predictors of NSVT and NYHA class >I.
Results
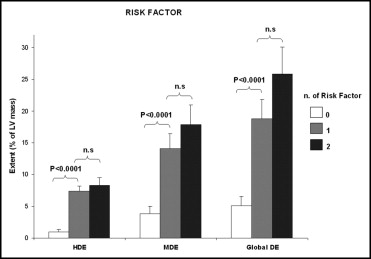
The clinical characteristics of the patients with HC and clinical results are summarized in Table 1 . Mild enhancement was detected in all the patients with HC, and higher enhancement was detected in 81 patients. Patients with 1 risk factor and those with ≥2 risk factors had a significantly larger extent of both higher enhancement and mild enhancement than did patients without risk factors ( Figure 3 ). Patients with NSVT had a larger extent of both higher enhancement and mild enhancement than those without NSVT ( Table 2 ). For multivariate analysis, the following parameters were included: LV mass index, maximal end-diastolic thickness, left outflow tract pressure gradient, extent of higher enhancement, extent of mild enhancement, and extent of global enhancement. Mild enhancement was the most important independent predictor of NSVT (regression coefficient 0.09, t = 4.98, p <0.0001). From the receiver operating characteristic curve analysis, including all the patients with HC, mild enhancement had 100% sensitivity and 86% specificity for predicting the occurrence of NSVT (cutoff 4.9% of LV mass, area under the curve 0.958), and higher enhancement had a sensitivity of 77% and specificity of 96% (cutoff 2.4% of LV mass, area under curve 0.895; Figure 4 ). Patients classified as having NYHA class II or greater had significantly more higher enhancement than did patients with NYHA class I (1.2 ± 2.6 vs 3.1 ± 5.1, p <0.02); however, no differences in mild enhancement were noted between these groups. The histograms in Figure 5 clearly show that the worse the patient’s clinical condition, the larger the extent of higher enhancement. For multivariate analysis, the following factors were evaluated as predictors of worse functional class (NYHA class II or more): higher enhancement, mild enhancement, left outflow tract pressure gradient, mitral regurgitant volume, maximal end-diastolic thickness, LV ejection fraction, and LV mass index. Higher enhancement (regression coefficient 0.03, t = 3.12, p = 0.0025) and left outflow tract pressure gradient (regression coefficient 0.007, t = 2.79, p = 0.0065) were the most important predictors. The relation between LV morphofunctional parameters and LGE is listed in Table 3 . LGE was associated with impaired diastolic relaxation, LV dysfunction, and atrial dilation. The interobserver agreement between the 2 investigators concerning the cutoff of signal intensity between mild and higher enhancement was good (kappa 0.826, standard error 0.06) A third expert observer was needed to settle discrepancies in interpretation in 6 patients.
| Variable | Value |
|---|---|
| Men | 70 |
| Age (years) | 46 ± 16 |
| Syncope/presyncope | 9 |
| Angina | 12 |
| Effort dyspnea | 32 |
| Palpitation | 2 |
| Arrhythmic risk factors: | |
| 0 | 73 |
| 1 | 17 |
| ≥2 | 9 |
| Nonsustained or sustained ventricular tachycardia | 17 |
| Atrial fibrillation (history) | 15 |
| Atrial dilation | 49 |
| Reduced ejection fraction (<50%) | 7 |
| Left ventricular outflow obstruction | 26 |
| Mitral regurgitation | 63 |
| Mild | 37 |
| Moderate | 22 |
| Severe | 4 |
| Magnetic resonance imaging findings | |
| Left ventricular mass index (g/m 2 ) | 107 ± 36 |
| Maximal end-diastolic thickness (mm) | 19 ± 4 |
| Ejection fraction (%) | 68 ± 10 |
| Higher enhancement (% of left ventricular mass) | 2 ± 4 |
| Mild enhancement (% of left ventricular mass) | 10 ± 10 |
| Therapy | |
| β Blockers | 43 |
| Calcium antagonist | 10 |
| Angiotensin-converting enzyme inhibitors | 11 |
| Diuretic | 10 |
| Amiodaron | 3 |
| Sotalol | 1 |
| Untreated | 51 |
| Variable | Groups | p Value | |
|---|---|---|---|
| Gender | Men | Women | |
| Patients (n) | 74 | 26 | |
| Higher enhancement (% left ventricular mass) | 2.1 ± 3.4 | 2.1 ± 4.6 | 0.9 |
| Mild enhancement (% left ventricular mass) | 9.6 ± 9.7 | 11.0 ± 3.0 | 0.4 |
| Family history of hypertrophic cardiomyopathy | Yes | No | |
| Patients (n) | 21 | 79 | |
| Higher enhancement (% left ventricular mass) | 2.56 ± 5.2 | 1.77 ± 3.4 | 0.4 |
| Mild enhancement (% left ventricular mass) | 14.3 ± 12.2 | 8.8 ± 9.2 | <0.03 |
| Nonsustained ventricular tachycardia | Yes | No | |
| Patients (n) | 17 | 83 | |
| Higher enhancement (% left ventricular mass) | 5.8 ± 5.5 | 1.1 ± 2.6 | <0.0001 |
| Mild enhancement (% left ventricular mass) | 21.0 ± 11.5 | 5.2 ± 8.1 | <0.0001 |
| Family history of sudden cardiac death | Yes | No | |
| Patients (n) | 8 | 92 | |
| Higher enhancement (% left ventricular mass) | 5.9 ± 7.7 | 1.6 ± 3.1 | <0.002 |
| Mild enhancement (% left ventricular mass) | 15.1 ± 14.5 | 9.4 ± 9.6 | 0.12 |
| Arrhythmic risk factor | 0 | ≥1 | |
| Patients (n) | 73 | 27 | |
| Higher enhancement (% left ventricular mass) | 0.9 ± 2.5 | 4.3 ± 2.5 | <0.0001 |
| Mild enhancement (% left ventricular mass) | 7.4 ± 8.4 | 15.7 ± 12.1 | 0.0003 |
Stay updated, free articles. Join our Telegram channel

Full access? Get Clinical Tree


