Cardiovascular magnetic resonance (CMR) of the superficial femoral artery (SFA) allows direct and noninvasive visualization of atherosclerotic plaque burden. We examined atherosclerosis in 3 groups of patients without history or symptoms of peripheral arterial disease with varying expected burdens: those with diabetes mellitus (DM) and known coronary artery disease (CAD) (n = 24), those with DM and a high prevalence of CAD risk factors (n = 20), and controls of similar age without DM or CAD and few CAD risk factors (n = 15). We also assessed the diagnostic accuracy of this technique to differentiate among these 3 groups. T1-weighted spin-echocardiographic images were used to measure mean wall thickness (WT) and total wall volume indexed to total vessel volume. Diagnostic accuracy was assessed by area under receiver operating characteristics curve analysis. Patients with DM plus risk factors and DM plus CAD had higher mean WT (1.28 and 1.37 mm) and mean indexed wall volume (0.53 and 0.56) compared to controls (mean WT 1.16 mm and mean indexed wall volume 0.45; p <0.010 for all comparisons). Mean WT and indexed wall volume showed good diagnostic accuracy in discriminating controls from those with DM plus CAD (areas under curve 0.85 and 0.87, respectively, p <0.001), whereas only indexed wall volume discriminated DM plus risk factors from controls (area under curve 0.82, p <0.001). Neither could discriminate between DM plus risk factors and DM plus CAD. In conclusion, patients with DM plus risk factors and DM plus CAD had significantly greater atherosclerotic burden in the SFA on CMR imaging than controls of similar age, with good diagnostic accuracy in differentiating these groups. The high reproducibility and reliability of CMR of the SFA may facilitate improved assessment of atherosclerosis prevalence and progression/regression in studies of novel therapies.
Presence and extent of peripheral arterial disease correlate closely with coronary atherosclerosis and cardiac events. Ankle–brachial indexes are specific for disease but are insensitive and fail to quantify the degree of peripheral atherosclerosis. This is especially true in patients with diabetes mellitus (DM) who frequently have stiff calcified vessels that can lead to a false-negative study result. Peripheral arterial disease has a high prevalence in diabetic patients, and those with DM and peripheral arterial disease have a 3.6-fold increase in cardiac events compared to those with DM alone. Cardiovascular magnetic resonance (CMR) can quantify atherosclerotic plaque volume in the superficial femoral artery (SFA) with high spatial resolution and excellent reproducibility. Accordingly, the purposes of this study were to (1) establish the extent of superficial femoral atherosclerosis in 3 asymptomatic cohorts with varying estimated atherosclerotic burdens and (2) determine the diagnostic accuracy of CMR of the SFA to differentiate among these 3 cohorts.
Methods
Study approval was obtained from the University of Virginia institutional review board in compliance with the Declaration of Helsinki, and written consent was obtained from all subjects before enrollment.
The study population consisted of 3 cohorts expected to have high, intermediate, and low atherosclerotic burdens: patients with DM and known coronary artery disease (CAD), subjects with DM and a high prevalence of risk factors for CAD but no known disease (DM plus risk factors), and a group of similarly aged controls without DM or CAD and a low prevalence of CAD risk factors. Study subjects were prospectively recruited from the University of Virginia diabetes and cardiovascular care clinic, general cardiovascular clinics, and general internal medicine clinics ( Figure 1 ). Consenting subjects 18 to 85 years old with DM were included unless they had a history of peripheral arterial disease, claudication, arterial insufficiency ulcers, or a contraindication to CMR (such as a pacemaker or an inability to lie flat). Similar proportions of subjects with and without CAD were sought. Ankle–brachial indexes were obtained in most subjects and those with an index <0.90 for either leg were excluded because this study was designed to assess global atherosclerotic burden rather than focal obstructive disease. Similarly aged controls without DM or CAD and a low prevalence of CAD risk factors were also recruited.

Extensive clinical information was prospectively collected from participants at the time of their CMR study including basic demographics, type and severity of DM, presence of vascular disease and its risk factors, medication usage, and relevant laboratory data such as lipids and hemoglobin A1c.
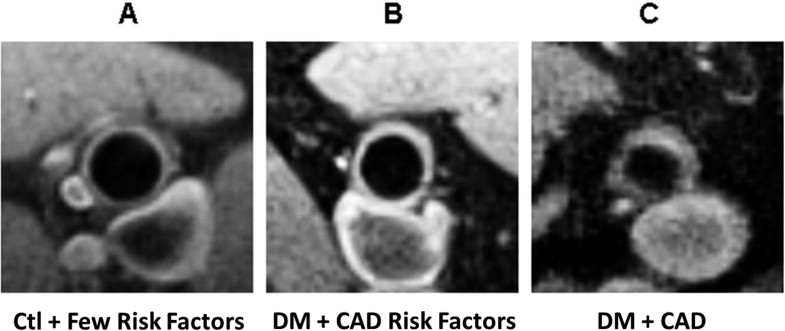
Subjects underwent CMR of the bilateral SFAs on a 1.5-T Siemens Avanto scanner using a linear, flexible, 4-element (10-cm ×10-cm 2 ) surface coil array (Nova Medical, Wilmington, Massachusetts). Contiguous, interleaved, ungated, 3.0-mm axial, black-blood, fat-suppressed, T1-weighted spin-echocardiographic images were obtained for each extremity ( Figure 2 shows representative images). Imaging parameters included a repetition time of 1,100 ms, an echocardiographic time of 7.6 ms, echocardiographic spacing of 7.5 ms, a turbo factor of 9, 4 signal averages, and a scan time of 1 minute 23 seconds for a 7-slice image set. Image resolution was 0.5 × 0.5 × 3.0 mm. Images were obtained for 15 to 20 cm of the SFA, starting at the femoral bifurcation and continuing through the adductor canal. Total imaging time for the 2 lower extremities was typically 60 minutes.
All images were processed by 1 of 2 operators using VesselMass 5.1 (University of Leiden, Leiden, the Netherlands). Interobserver agreement with this approach is excellent. Luminal and adventitial borders of the SFA were manually delineated in each 3-mm slice. Length of an interpretable SFA for each subject’s extremity was obtained by summing the thicknesses of the slices in which contours could be adequately drawn. Depth of the artery from the skin surface and signal-to-noise ratio were measured at the level of the first analyzed slice for each leg. Mean wall thickness (WT) and wall cross-sectional area for each axial slice were determined by VesselMass. Mean WT normalized to vessel cross-sectional area was also assessed. Vessel wall volume for each slice was calculated as cross-sectional area multiplied by slice thickness. Indexed wall volume was obtained by dividing the vessel wall volume of each slice by total vessel volume in the same slice. WT, normalized WT, and indexed wall volume values were averaged across all slices to produce mean values.
For data analysis, continuous variables were presented as mean ± SD or median with 25th and 75th percentiles, and categorical variables were presented as percentage. Baseline characteristics, medications, analyzed vessel length, artery depth, signal-to-noise ratio, mean WT, normalized WT, and mean indexed wall volume were compared using analysis of variance and Tukey–Student range testing for continuous variables and chi-square analysis or Fisher’s exact testing for categorical variables. Data from the left and right legs were combined when mean WT and indexed wall volume were calculated. For all testing, p values <0.05 were considered statistically significant. Receiver operating characteristics curves and associated areas under the curve were used to assess the diagnostic accuracy of mean WT and indexed wall volume to differentiate SFAs between patients with DM, DM plus CAD, and neither DM nor CAD. Values of WT and indexed wall volume between the left and right legs were compared using Pearson correlation coefficients. All analyses were prospectively designed and performed using SAS 9.1 (SAS Institute, Cary, North Carolina).
Results
The derivation of the study cohort is presented in Figure 1 . Consent was obtained from 47 subjects with DM (1 of whom was excluded for an ankle–brachial index <0.9) and 15 similarly aged controls. CMR was performed, and 2 subjects were subsequently excluded for incomplete data and uninterpretable images owing to patient movement. The remaining 59 patients made up the final study cohort.
Baseline characteristics of study subjects are presented in Table 1 , subdivided by presence or absence of DM plus CAD. As expected, the median (25th, 75th percentiles) number of CAD risk factors presented in Table 1 was highest in the high-prevalence DM group [median 6 (5,6)], intermediate in the low-prevalence DM group [median 4 (3, 4.5)], and lowest in the control group [median 2 (1, 2), p <0.001]. There was no difference between those with DM alone and those with DM plus CAD in mean hemoglobin A1c (8.2 vs 7.3, p = 0.264) or proportion treated with oral hypoglycemic agents or insulin. Mean duration of DM (93% type 2) was very similar (10.3 ± 9.8 years for DM alone vs 10.0 ± 7.8 years for DM plus CAD, p = 0.938). Mean low-density lipoprotein values were 128 for those with DM alone, 74 for those with DM plus CAD, and 109 for controls (p = <0.001); high-density lipoprotein values were 47, 41, and 53 mg/dl (p = 0.023) for these groups, respectively. The 2 diabetic groups had high rates of statin and angiotensin-converting enzyme inhibitor/angiotensin receptor blocker use, with no significant differences between them. Beta blockers and aspirin were taken more often by those with known CAD.
| Characteristic | Controls | DM Only | DM and CAD | p Value |
|---|---|---|---|---|
| (n = 15) | (n = 20) | (n = 24) | ||
| Age, median (25th, 75th percentiles) | 61.0 (58.0, 72.0) | 51 (57.5, 61.5) | 63.0 (59.0, 68.0) | 0.083 |
| Men | 11 (73%) | 9 (45%) | 18 (75%) | 0.083 |
| Caucasian | 13 (87%) | 10 (50%) | 23 (96%) | <0.001 ‡ |
| Hypertension ⁎ | 4 (27%) | 17 (85%) | 23 (96%) | <0.001 ‡ |
| Hyperlipidemia † | 8 (53%) | 15 (75%) | 24 (100%) | <0.001 ‡ |
| Current tobacco use | 0 (0%) | 3 (15%) | 8 (33%) | 0.025 ‡ |
| Body mass index ≥30 kg/m 2 | 1 (7%) | 13 (65%) | 14 (58%) | 0.001 ‡ |
| Cerebrovascular disease | 0 (0%) | 0 (0%) | 1 (4%) | 0.476 |
| Heart failure | 0 (0%) | 0 (0%) | 5 (21%) | 0.024 ‡ |
| Aspirin | 9 (45%) | 23 (96%) | <0.001 ‡ | |
| β Blocker | 3 (15%) | 19 (79%) | <0.001 ‡ | |
| Statin | 14 (70%) | 22 (92%) | 0.115 | |
| Angiotensin-converting enzyme inhibitor or angiotensin receptor blocker | 15 (75%) | 21 (87%) | 0.284 | |
| Oral hypoglycemics | 15 (75%) | 20 (83%) | 0.495 | |
| Insulin | 8 (40%) | 8 (33%) | 0.647 |
⁎ Defined as blood pressure ≥135/85 mm Hg or known history and treatment with antihypertensive medication.
† Defined as low-density lipoprotein >100 mg/dl for patients with diabetes mellitus or >130 mg/dl for those without diabetes mellitus.
‡ Analysis of variance testing. Statistically significant results have a p value ≤0.05.
Stay updated, free articles. Join our Telegram channel

Full access? Get Clinical Tree


