High-frequency mid-QRS (HFQRS) analysis was recently introduced as a tool for identification of stress-induced ischemia. The diagnostic performance of this electrocardiographic technique has not been determined in a large cohort of patients. This study compared the diagnostic performance of HFQRS analysis to conventional ST-segment analysis in detecting exercise-induced ischemia. The study included 996 patients (56 ± 10 years of age, 670 men) referred for exercise myocardial perfusion imaging (MPI), which served as the gold standard of ischemia. High-resolution electrocardiogram was used for computer analysis of HFQRS signals. Number of electrocardiographic leads with ≥50% decrease of HFQRS intensity (L 50% ) was used as an index of ischemia. Perfusion images were evaluated semiquantitatively. Receiver operating characteristic analysis demonstrated an L 50% ≥3 as the criterion that yielded optimal sensitivity and specificity for diagnosing moderate/severe ischemia. Compared to ST-segment analysis HFQRS analysis was more sensitive (69% vs 39%, p <0.005) and more specific (86% vs 82%, p <0.05). L 50% correlated with amount of MPI ischemia (R 2 = 0.75, p <0.0001). Multivariate logistic regression analysis demonstrated a significant incremental diagnostic value for the addition of HFQRS data to a model containing pretest and conventional exercise parameters. L 50% was the best predictor of mild or moderate/severe MPI ischemia. In conclusion, computerized HFQRS analysis improved the diagnostic performance of conventional stress electrocardiogram in detecting exercise-induced ischemia. Thus, this technique might aid in the noninvasive evaluation of coronary artery disease.
Exercise electrocardiography is widely used as the first test for detecting coronary artery disease, with >6 million tests performed annually in the United States. In this study we evaluated a new electrocardiographic (ECG) technique for detecting stress-induced ischemia by examining high-frequency QRS (HFQRS) components in the 150 to 250 Hz frequency band. Recent technologic breakthroughs have allowed for the first time the detection of depolarization changes during exercise, allowing for practical application in a clinical setting. Performance of this technique has not been reported in a large cohort of consecutive patients. The aim of this study was to compare the diagnostic performance and incremental value of HFQRS analysis to ST-segment analysis in detecting exercise-induced ischemia using myocardial perfusion imaging (MPI) as a gold standard.
Methods
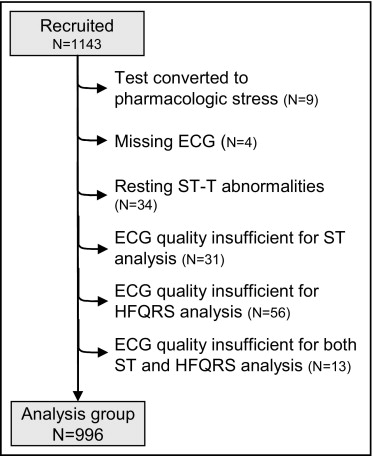
The study included 1,143 consecutive patients (55 ± 10 years of age, 782 men) referred for exercise myocardial perfusion single-photon emission computed tomography in 2 medical centers (888 patients, Assuta Medical Center, Tel Aviv Israel; and 255 patients, Sheba Medical Center, Tel Hashomer, Israel). Exclusion criteria were cardiac pacemaker, atrial fibrillation at time of testing, and QRS duration ≥120 ms. The study protocol was approved by the institutional review boards and all patients signed an informed consent. Of the 1,143 patients, 147 patients were excluded for various reasons ( Figure 1 ) and the remaining 996 patients were included in the analysis. In addition, reproducibility of ST-segment and HFQRS analyses was assessed in 10 patients who had repeat MPI and HFQRS analysis after 12 ± 9 days owing to insufficient image quality on the initial MP image (n = 9) or hospital admission (n = 1). Pretest likelihood of coronary artery disease was calculated using a model suggested by Pryor et al based on age, gender, smoking, diabetes, hyperlipidemia, baseline ECG abnormalities, type of chest pain, and history of myocardial infarction.

Beta blockers and calcium channel blockers were discontinued ≥48 hours before testing. A symptom-limited treadmill exercise test was performed using the Bruce protocol. High-resolution 12-lead electrocardiogram (HyperQ Stress System, BSP Ltd., Tel Aviv, Israel) was continuously recorded throughout the exercise test and used for off-line quantitative assessment of ST-segment changes and HFQRS analysis. Conventional ECG monitoring during the exercise test was extracted automatically from the high-resolution ECG traces or acquired using an additional ECG device (Q-Stress, Quinton, Inc., Bothell, Washington) using a second set of electrodes.
ST-segment level was measured 60 ms after the J point using commercial software (HyperQ Stress System). The ECG response was considered positive if horizontal (defined as ST-segment slope ≤0.5 mV/s) or downsloping ST-segment depression ≥1 mm was found in ≥2 leads. Leads that exhibited erratic or upsloping ST-segment depression in >60% of the exercise test were considered noisy and thus excluded from analysis. Diagnostic results were not possible in cases in which the patient had (1) ≥3 noisy leads, (2) ≥1 noisy lead and 1 lead with ST-segment changes, or (3) baseline nonspecific ST-T abnormalities. Cases not meeting these criteria for positive or nondiagnostic ST-segment changes were considered negative for ischemic ST-segment deviations.
Patients underwent technetium-99m sestamibi-gated single-photon emission computed tomography during stress and at rest (n = 668) or redistribution thallium-201 single-photon emission computed tomography during stress (n = 328). A dose of 10 mCi technetium-99m sestamibi was injected at peak stress and exercise was continued for 1 additional minute at peak stress and 2 minutes at 1 lower exercise level. Gated single-photon emission computed tomographic acquisition was initiated 15 to 30 minutes later using a 90° dual-detector gamma camera (Axis, Philips Medical Systems, Cleveland, Ohio; or Cardial, GE Healthcare, Haifa, Israel) equipped with low energy, high resolution collimators. Acquisitions were performed using 60 projections, 30 to 33 seconds/projection, over a 180° circular orbit using 8-frame ECG gating with a 100% acceptance window. Images at rest were acquired 3 hours later, 1 hour after injection of an additional technetium-99m sestamibi 30 mCi, for 23 to 26 seconds/projection. Alternatively, a dose of thallium-201 2.8 to 3.5 mCi (weight adjusted) was injected at peak exercise. Single-photon emission computed tomographic acquisition was started 8 to 12 minutes after stress; acquisitions of stress and redistribution images were performed over 10 to 14 minutes. Reinjection of thallium-201 0.5 to 1 mCi was administered whenever a severe perfusion defect was identified on stress images. Images were reconstructed using filtered back projection with a Butterworth postfilter. No attenuation or scatter correction was applied at the Assuta Medical Center; attenuation correction was applied at the Sheba Medical Center. Perfusion images were visually scored using a 20-segment model of the left ventricle and a 5-point scale by expert interpreters (T.S. or P.C.), overriding automatic segmental scores, obtained by commercial software (QPS, Cedars-Sinai Medical Center, Los Angeles, California). Summed scores during stress and at rest were calculated as the sum of individual segment scores for images during stress and at rest and converted to percent total myocardium (percent myocardium). Percent ischemic myocardium (IM) was calculated as the summed difference score converted to a percentage. Patients were classified as having no or equivocal ischemia (IM <5%), mild ischemia (IM ≥5% to <10%), or moderate/severe ischemia (IM ≥10%).
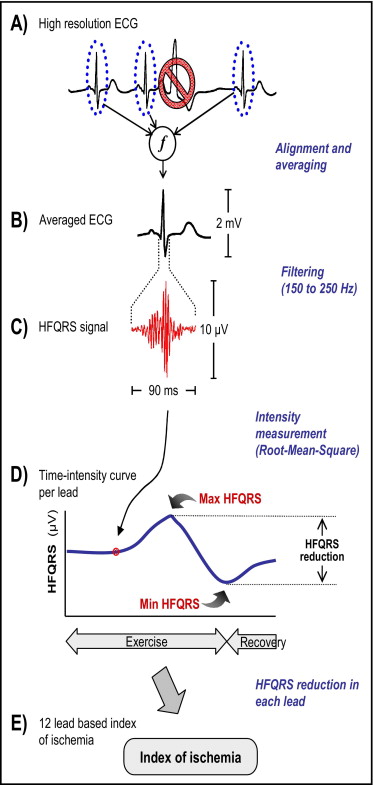
HFQRS data were extracted from high-resolution 12-lead electrocardiogram using a multistage algorithm (HyperQ Stress System) shown in Figure 2 . Level of noise in the HFQRS signal was calculated as the root mean square of high-frequency components in the ST segment. HFQRS data were not included in analysis if noise at that specific time point exceeded 1 μV. The absolute decrease in HFQRS intensity (difference between maximal and minimal values) and relative decrease in HFQRS intensity (percent decrease compared to maximal HFQRS intensity) were calculated for each lead ( Figure 2 ). Based on preliminary results indicating up to 1 μV variations in HFQRS intensity during conditions at rest, an absolute HFQRS intensity decrease <1 μV was considered nonsignificant regardless of the associated relative decrease.

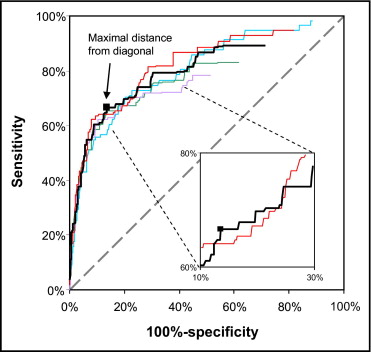
Receiver operator characteristics curves were used to determine (1) the threshold to define a significant relative decrease in HFQRS intensity in a specific lead and (2) number of leads with significant HFQRS intensity decrease required for diagnosis of ischemia ( Figure 3 ) . Receiver operator characteristics curves were constructed using different values of relative HFQRS decrease for increasing the number of ECG leads. The gold standard used was moderate/severe MPI ischemia (IM ≥10%) to minimize the inclusion of false-positive MPI findings. For this analysis data from all patients with valid HFQRS data (n = 1,130) were used regardless of ST-segment abnormalities at rest. Threshold values were determined as the point in the receiver operator characteristics curve with maximal distance from the diagonal. This analysis indicated that the best criterion of HFQRS analysis for diagnosis of moderate/severe ischemia was the combination of ≥50% relative HFQRS decrease in ≥3 leads. The threshold of 3 leads was chosen over a value of 2 leads because the receiver operator characteristics curve calculated using a cut-off value of 2 leads was concave in the range of sensitivity and specificity values of interest ( Figure 3 ). The number of ECG leads with ≥50% decrease in HFQRS intensity was denoted as L 50% .

Comparisons between groups were performed using analysis of variance and post hoc tests using t test, chi-square test, or Fisher’s exact test, as appropriate. HFQRS and ST-segment analyses were compared to the diagnostic end point, moderate/severe ischemia, using the McNemar chi-square test. A p value <0.05 was considered statistically significant, with a false discovery rate adjustment for multiple comparisons. Multivariate logistic regression analysis was performed using 2 end points, IM ≥5% and IM ≥10%. The model was built using backward/forward logistic regression with the Wald chi-square as the criterion for exclusion/inclusion for 3 variable groups: (1) pretest score, (2) exercise and conventional electrocardiogram (exercise duration, exercise stage, heart rate at rest, maximal heart rate, percent maximum age-predicted heart rate, exercise-induced chest pain, and magnitude of ST-segment depression), and (3) HFQRS data (L 50% ). Reproducibility was calculated using the Wilcoxon signed-ranks test for L 50% and kappa value for the HFQRS results.
Results
Table 1 presents clinical characteristics of the 996 patients included in the analysis categorized as having no ischemia (IM <5%), mild ischemia (IM 5% to 10%), and moderate/severe ischemia (IM ≥10%). Compared to patients with no ischemia, patients with mild or moderate/severe ischemia were significantly older, were more likely to be men, and had a higher rate of hypertension, previous myocardial infarction, previous percutaneous coronary intervention, or coronary artery bypass surgery. Rate of typical angina was higher in patients with moderate/severe ischemia compared to those with mild or no ischemia, whereas rate of nonanginal chest pain was higher in those with no ischemia. A comparison of exercise, ST-segment changes, MPI, and HFQRS variables in patients with no ischemia, mild ischemia, versus moderate/severe ischemia is presented in Table 2 . In the 2 ischemia groups, maximal ST-segment depression and presence of significant ST-segment changes during exercise were higher compared to patients with no ischemia. Perfusion abnormality at stress and rest was greater in patients with mild and moderate/severe ischemia compared to patients with no ischemia. IM was larger in patients with ischemia consistent with its use as a criterion for patient subgrouping.
| Myocardial Ischemia | All (n = 996) | p Value | |||
|---|---|---|---|---|---|
| No Ischemia (IM <5%) (n = 901, 90%) | Mild (IM ≥5%–<10%) (n = 46, 5%) | Moderate/Severe (IM ≥10%) (n = 49, 5%) | |||
| Age (years) | 55 ± 10 | 60 ± 9 § | 62 ± 11 § | 56 ± 10 | <0.0001 |
| Men | 582 (63%) | 43 (94%) § | 45 (92%) § | 670 (67%) | <0.0001 |
| Body mass index | 27.9 ± 9.9 | 27.5 ± 4.0 | 27.8 ± 3.5 | 27.8 ± 9.5 | 0.99 |
| Diabetes mellitus | 157 (17%) | 9 (20%) | 14 (29%) | 180 (18%) | 0.18 |
| Hypertension ⁎ | 366 (41%) | 27 (59%) ‡ | 31 (63%) ‡ | 424 (43%) | 0.001 |
| Hyperlipidemia ⁎ | 514 (57%) | 39 (85%) § | 36 (74%) | 589 (59%) | 0.0001 |
| Smokers | 191 (21%) | 8 (17%) | 6 (12%) | 205 (21%) | 0.38 |
| History of coronary artery disease † | 158 (18%) | 31 (67%) § | 24 (49%) § | 213 (21%) | <0.0001 |
| History of myocardial infarction | 43 (5%) | 15 (33%) § | 8 (16%) § | 66 (7%) | <0.0001 |
| Previous percutaneous coronary intervention | 158 (18%) | 26 (57%) § | 22 (45%) § | 206 (21%) | <0.0001 |
| Previous coronary bypass surgery | 47 (5%) | 8 (17%) § | 10 (20%) § | 65 (7%) | <0.0001 |
| Pretest probability | 0.26 ± 0.24 | 0.27 ± 0.22 | 0.37 ± 0.27 ‡ | 0.27 ± 0.24 | <0.05 |
| Typical anginal chest pain | 32 (4%) | 2 (4%) | 11 (23%) § ¶ | 45 (5%) | <0.0001 |
| Atypical anginal chest pain | 141 (16%) | 10 (22%) | 9 (18%) | 160 (16%) | 0.55 |
| Nonanginal chest pain | 328 (36%) | 5 (11%) § | 8 (16%) ‡ | 341 (34%) | <0.0001 |
| Dyspnea | 69 (8%) | 3 (7%) | 6 (12%) | 78 (8%) | 0.56 |
⁎ Patients diagnosed by referring physician and treated medically.
† Patients had documented myocardial infarction, previous percutaneous coronary intervention, or coronary bypass surgery.
§ p <0.005 versus no ischemia.
| Myocardial Ischemia | All (n = 996) | p Value | |||
|---|---|---|---|---|---|
| No Ischemia (IM <5%) (n = 901) | Mild (IM ≥5%–<10%) (n = 46) | Moderate/Severe (IM ≥10%) (n = 49) | |||
| Heart rate at rest (beats/min) | 79 ± 13 | 76 ± 14 | 81 ± 15 | 79 ± 13 | 0.14 |
| Exercise duration (minutes) | 9 ± 2 | 9 ± 2 | 8 ± 3 ⁎ ‡ | 9 ± 2 | 0.006 |
| Maximum heart rate (beats/min) | 153 ± 14 | 147 ± 11 † | 144 ± 13 † | 152 ± 14 | <0.0001 |
| Maximum heart rate (percent age-predicted maximum heart rate) | 93 ± 7.1 | 92 ± 5 | 91 ± 6 | 93 ± 7 | 0.34 |
| Exercise-induced chest pain | 44 (5%) | 8 (17%) † | 11 (24%) † | 63 (6%) | <0.0001 |
| Exercise stopped because of chest pain | 12 (1%) | 2 (4%) | 4 (8%) ⁎ | 18 (2%) | 0.007 |
| ST-segment analysis | |||||
| Maximum ST-segment depression (mm) | 0.7 ± 0.9 | 1.2 ± 1.2 ⁎ | 1.4 ± 1.1 † | 0.8 ± 0.9 | <0.0001 |
| Significant ST-segment deviation | 154 (17%) | 13 (28%) † | 19 (39%) † | 186 (19%) | 0.0009 |
| Myocardial perfusion imaging | |||||
| Abnormal myocardium during stress (%) | 0.1 ± 0.7 | 6.6 ± 1.5 † | 18 ± 7.5 † § | 1.3 ± 4.4 | <0.0001 |
| Abnormal myocardium at rest (%) | 0.5 ± 0.2 | 1.3 ± 2.3 ⁎ | 3.1 ± 6.5 ⁎ | 0.7 ± 2.8 | <0.0001 |
| Ischemic myocardium (%) | 0.5 ± 0.2 | 5.9 ± 4.5 † | 16.8 ± 12.4 † § | 1.7 ± 5.2 | <0.0001 |
| High-frequency QRS data | |||||
| Number of leads with ≥50% high-frequency QRS decrease | 0.9 ± 1.8 | 1.5 ± 2.2 | 4.9 ± 3.9 † § | 1.1 ± 2.1 | <0.0001 |
| Positive high-frequency QRS (≥3 electrocardiographic leads with ≥50% decrease of high-frequency QRS intensity) | 120 (13%) | 10 (22%) ⁎ | 34 (69%) † § | 164 (17%) | <0.0001 |
† p <0.005 versus no ischemia.
Stay updated, free articles. Join our Telegram channel

Full access? Get Clinical Tree


