Fig. 1
Patients enrollment scheme
Clinical features (body temperature on admission, time for defeverscence, heart rate, breath rate, capillary blood saturation, length of antibiotic course and hospital stay), as well as serum inflammatory markers (CRP, PCT, white blood cell count, and neutrophil percentage) were used to assess the CAP severity. Because of physiological age-dependent differences in cardio-respiratory functions, breath frequency and heart rate were analyzed separately in children under and over 1 year of age. Likewise, white blood cells count and neutrophil count were analyzed separately in children under and over 4 years of age.
To describe continuous variables, means ±SD, for normally distributed data, and medians with interquartile range (IQR), for skewed data, were used. The Shapiro-Wilk test was used to determine the data distribution. A t-test or Mann-Whitney U test was performed for data comparisons as required. Correlations between suPAR and clinical markers were assesses with Spearmann’s rank correlation coefficient. p < 0.05 was defined as the level of statistical significance. A commercial STATISTICA ver. 10 (StatSoft) package was used for data elaboration.
3 Results
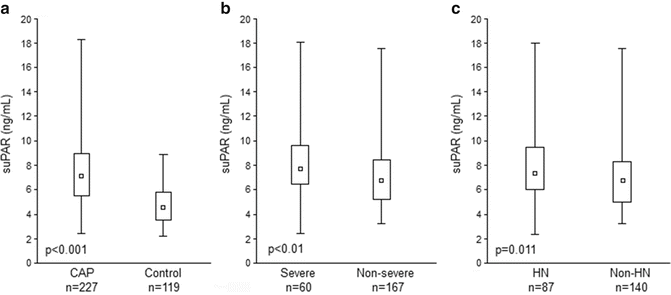
The median suPAR concentration in children with CAP was 7.11 ng/mL (IQR: 5.47–8.95), while in healthy individuals it was 4.68 ng/mL (IQR: 3.68–5.91); the difference was statistically significant (p < 0.001) (Fig. 2a). When the groups were broken down by the severity of CAP and by the presence of hyponatremia, suPAR levels were significantly greater in the severe and hyponatremic subgroups. The median suPAR in severe vs. non-severe CAP were 7.79 ng/mL (IQR: 6.55–9.69) vs. 6.87 ng/mL (IQR: 5.28–8.53) (p < 0.01) (Fig. 2b) and in CAP complicated by hyponatremia it was 7.57 ng/mL (IQR: 6.20–9.64) vs. 6.92 ng/mL (IQR: 5.10–8.42) (p = 0.01) in non-hyponatremic children (Fig. 2c).


Fig. 2
suPAR in children with community acquired pneumonia (CAP) compared with healthy individuals (a), in CAP broken down by the severity of disease (b) and by the level of natremia (c). n number of patients, box plots with lower quartile (LQ) and upper quartile (UQ) bars, HN hyponatremic, non-HN non-hyponatremic patients; differences assessed with Mann-Whitney U test
There was a positive correlation between suPAR and clinical as well as laboratory markers of disease severity, such as fever, time for defeverscence, and length of hospital stay (r = 0.21, r = 0.31, and r = 0.21, respectively). A negative correlation was between suPAR and capillary blood saturation (r = −0.16), which also reflects the pneumonia severity. The correlations remained irrelevant for breath rate, heart rate, or length of antibiotic treatment (Table 1). However, the level of suPAR correlated positively with CRP and PCT (r = 0.15 and r = 0.29, respectively) and with the white blood cell count in children under 4 (r = 0.25), and negatively with the sodium concentration (r = −0.23). There was no association between suPAR and neutrophil or lymphocyte percentage, nor was there any between suPAR and the white blood cell count in children over 4 years old.
Table 1
Characteristics of children with pneumonia and Spearmann’s correlation rank coefficient (r) between the suPAR and selected parameters
Characteristics | Median | LQ–UQ | r |
|---|---|---|---|
Length of hospitalization (days) | 7.0 | 5.0–9.0 | 0.21 |
Fever (°C) | 38.4 | 37.3–39.0 | 0.21 |
Defeverscence (h) | 36.0 | 12.0–60.0 | 0.31 |
Breath rate (per min) | 30.0 | 20.0–44.0 | NS |
Capillary blood saturation (%) | 96.0 | 94.0–97.0 | −0.16 |
Heart rate (per min) | 120.0 | 100.0–135.0 | NS |
Antibiotic treatment (days) | 10.0 | 8.0–10.0 | NS |
CRP (mg/dL) | 22.9 | 7.0–66.8 | 0.15 |
PCT (ng/mL) | 0.2 | 0.1–0.9 | 0.29 |
Sodium (mmol/L) | 136.0 | 135.0–138.0 | −0.23 |
WBC (×103/μL) | 12.5 | 8.5–17.5 | NS |
Neutr. (%) | 61.0 | 48.0–71.0 | NS |
Lymph. (%) | 27.0 | 19.0–39.0 | NS |
Under 4 years old | |||
WBC (×103/μL) | 13.3 | 9.6–17.8 | 0.25 |
Neutr. (%) | 56.0 | 41.0–67.0 | NS |
Lymph. (%) | 32.0 | 22.0–48.0 | NS |
Over 4 years old | |||
WBC (×103/μL) | 10.4 | 7.4–15.7 | NS |
Neutr. (%) < div class='tao-gold-member'>
Only gold members can continue reading. Log In or Register to continue
Stay updated, free articles. Join our Telegram channel
Full access? Get Clinical Tree
 Get Clinical Tree app for offline access

|