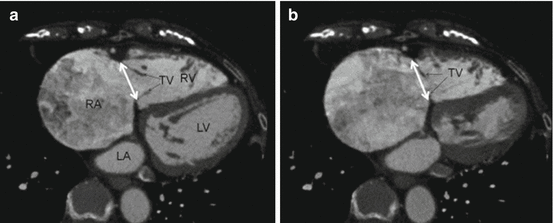
Fig. 9.1
Arrhythmogenic RV dysplasia on cardiac CT. Reprinted with permission from “Value of Cardiac CT in Patients with Heart Failure” by Deepa Mangalat et al., J Curr Cardiovasc Imaging Rep. 2009 Dec; 2(6): 410–417. Springer Science and Business Media, LLC 2009
Computed Tomography Acquisition Techniques for the Right Side of the Heart
As mentioned before, due to the fact that standard injection techniques are optimized for the left side of the heart, to acquire images of the right side of the heart the injection protocol has to be modified [1]. In order to acquire images of the right side of the heart, adequate contrast quantity has to be maintained in this area. By adjusting the amount of contrast medium and the flow, prolongation of the length of administration of the entire bolus can be achieved [4], and adequate contrast quantity can be maintained on the right side of the heart. To prevent streak artefacts and to achieve clear depiction of the endocardial contour, the multiphasic infusions technique instead of monophasic injection of contrast medium can be used [1]. Furthermore, the use of different combinations of contrast material can contribute to improve the homogeneous enhancement profile. Including saline contrast mixture or saline flush [5].
Different studies have assessed the optimum protocol and modes for the delivery of contrast material [6–9]. For RV functional analysis, biphasic infusion of contrast medium followed by a contrast saline mixture was found to be optimal, mainly due to the better delineation of the ventricular wall [6]. Furthermore, for the depiction of the right side of the heart, including the valves, split bolus infusion seemed to be the optimal method [7, 9]. For additional imaging of surrounding blood vessels, these injections parameters have to be adjusted, in order to have the optimal enhancement profile.
Clinical Utility of Cardiac CT
Although, MRI is the most accurate in assessing RV volumes and function [10], CT can be used to assess a variety of cardiopulmonary conditions and detect important prognostic markers [1]. Table 9.1 lists cardiac diseases in which the assessment of RV function is highly important. In patients with an acute pulmonary embolism (Fig. 9.2) the RV/Left ventricle (LV) diameter ratio is associated with higher mortality rates [11]. In addition, RV/LV diameter ratio score greater than 1.5, estimated through CT, indicates severe RV dysfunction [3]. Furthermore, both right- and left sided valvular diseases can lead to RV dysfunction [1]. However, TV regurgitation (TR) can also occur because of RV dysfunction and subsequent annular dilatation [12]. CT can provide an anatomical delineation of the right atrioventricular junction and the RV outflow tract, in order to depict dilation or enlargements. Finally, CT can be used to rapidly asses the RV function and ejection fraction in acute settings such as RV infarction, and in chronic diseases such as heart failure [1].

Table 9.1
Computed tomography assessment of the right heart
Condition | Impact | CT measurements/findings |
|---|---|---|
Acute pulmonary embolism [3] | • ↑ RV afterload • RV dysfunction • ↑ RV end-systolic volumes • Leftward septal bowing • LV Compression • ↓ CO | • RV/LV ratio • Maximum distance between inner surface of the free wall and the endocardial surface of the interventricular septum |
Valvular heart disease | • RV dysfunction • RA enlargement • Dilated RVOT | • RAJ & RVOT size • RV function • Morphologic changes |
RV cardiomyopathy [13] | • RV dilatation • RVOT enlargement • RV intramyocardial fat deposition • Wall thinning | • RVOT size • Morphologic changes • LV assessment • Subendocardial fatty tissue |

Fig. 9.2
Computed Tomography in a patient with acute pulmonary embolism. (a) Four-chamber view reconstruction with septal flattening (arrows). (b) Grade 4 reflux of contrast into the inferior vena cava (long arrow) and proximal hepatic veins (short arrows). (c) The maximal diameter on axial sections of (c) right and (d) left ventricular diameter. (e) The maximal diameter on four-chamber view of the right and (f) left ventricle. Right and left ventricle volumetric depicted on (g) axial section and (h) sagittal reformation. Reprinted with permission from “CT Signs of Right Ventricular Dysfunction: Prognostic Role in Acute Pulmonary Embolism” by Doo Kyoung Kang et al., JACC Cardiovasc Imaging 2011; Volume 4:8:841–849. Copyright (2017) by Elsevier Inc.
Comprehensive Assessment of Tricuspid Valve and Surrounding Structures by CT
Advanced TV disease such as severe TR is associated with increased morbidity and mortality [14, 15]. TR might not be recognized clinically until fairly late in its natural history. Early stages of TR are therefore often asymptomatic and are often observed on echocardiography. Transthoracic echocardiography (TTE) is most often used to diagnose and to assess the cause and the severity of TR. When TTE images are inadequate, transoesophageal echocardiography (TEE) can be considered, although visualization of the anteriorly located TV can be difficult [16].
In advance of TV interventions, a detailed knowledge of the complex surgical anatomy of the TV is fundamental. The information gained through imaging may help to plan and guide surgical decision-making and transcatheter TV interventions. Different imaging techniques have been used for the assessment of the TV and the surrounding structures. However, due to the complex anatomy of TV apparatus a 3D imaging modality is often needed. Cardiac magnetic resonance (CMR) imaging and real-time three-dimensional techniques can provide 3D information as well as accurate quantification of TR severity [10, 17–19]. However, CMR is not widely available and often contraindicated due to the presence of pacemaker leads. On the other hand, 3D echocardiography suffers often a low spatial and temporal resolution. CT on the other hand has acquired an increasing importance in planning transcatheter interventions because of its accurate 3D information as well as high spatial and temporal resolution. CT can be used therefore to assess TV and the surrounding structures such as the RV and adjacent blood vessels [20, 21]. In this section we discuss the assessment of the TV and the surrounding structures with CT and the clinical utility of CT in preplanning for TR interventions.
The Tricuspid Valve
The most common abnormality of TV is TR, which is often due to incomplete leaflet coaptation or incomplete closure due to dilated annulus and dilated RV. Increasing TR severity is associated with poor survival [22]. Therapeutic decisions for TR often require 3D imaging modality to unravel its mechanism [14].
The normal tricuspid apparatus (Fig. 9.3) has been described previously in Chap. 1. In brief, the TV apparatus consist of three leaflets, a partly fibrous annulus, and a supporting tension apparatus. The supporting tension apparatus consist of the chordae tendinae and papillary muscles . The leaflets include anterior, septal and posterior [23, 24]. The PMs include anterior, inferior and medial. The commissure between the septal and anterior leaflets is located over the membranous septum and divides it into the atrioventricular and inter-ventricular components [24, 25]. The chordae to the anterior and septal leaflets, provided by the medial PM of the conus or RV septal wall, represents an important surgical landmark for the location of the right bundle branch [20].


Fig. 9.3
Normal appearance of tricuspid valve . (a) Four-chamber CT image shows the septal (S) and anterior (A) leaflets. (b) Two-chamber CT image shows septal (S) and posterior (P) leaflets. (c) Short-axis CT image shows all the leaflets (S, A, P). (d) MRI appearance of the tricuspid annulus, with the short-axis steady-state free precession (SSFP) image showing all the leaflets (S, A, P). Reprinted with permission from Shah et al. [26] Insights Imaging. 2016 Oct;7(5):649–67
Tricuspid Annulus
The normal tricuspid annulus is an ellipsoid, non-symmetrical, saddle-shaped structure and appears nonplanar, with the posteroseptal part the most towards the RV apex. It becomes more circular as it dilates in an anterior-posterior direction in response to RV enlargement (Fig. 9.4) [14]. Among other reasons, the TV annulus differs from the mitral annulus because of the lack of extensive fibrous elements in the peripheral (mural) part of the valve to support its leaflets [25]. Measurements of TV annulus on CT can be performed in the four-chamber views by measuring maximum and minimum diameters.


Fig. 9.4
Measurements of the tricuspid valve annual diameter. Presented are the measurements of the (a) maximum and (b) minimum tricuspid valve annual diameter on electrocardiogram gated 320-slice computed tomography. Reprinted with permission from “Relationship of maximum and minimum tricuspid valve annular diameter determined by 320-slice computed tomography with right atrial and ventricular volume and estimated right ventricular systolic pressure” by Nobusada Funabashi et al., IJC 2013;168(4):4578–81. Copyright (2017) by Elsevier Inc
CT Assessment of the Tricuspid Valve and Adjacent Anatomical Structures
In detail visualization of the right atrioventricular junction can be challenging. Clear depiction of this region requires homogenous enhancement of the structures around the TV annulus. ECG gated or triggered cardiac CT angiography (CTA) techniques can provide good-quality motion-free images of the RV outlet and trabeculated portions [20]. However, the quality may not be high enough to show the details of the RV inlet [27], partially because of streaming artefacts.
Advantages
Advantages of CT use in the assessment of the TV includes, its ability to show the extent of calcification, a complete overview of the complex anatomy, good spatial and temporal resolution, it enables evaluation of the TV annuloplasty ring dislodgement, it helps to identify inappropriate positioning of the RV pacemaker lead at the TV level, and, measurements are generally simple on good-quality four-chamber cardiac CT images [20, 21]. Moreover, CT can evaluate associated extra-cardiac lesions, for example in carcinoid heart disease. Advantages and limitations are summarized in Table 9.2.
Table 9.2
Advantages and limitations of the use of computed tomography
Advantages | Limitations |
|---|---|
• Only modality for reliable assessment of calcification • Good spatial/temporal resolution • Complete overview of anatomy • Multiplanar reconstruction capabilities • Identifies inappropriate positioning of leads | • Radiation • Potentially nephrotoxic contrast agents • Limited in detecting small vegetation’s and small valve perforations • Limited in patients with high/irregular heart rates |
Limitations
The use of CT has certain limitations. It is associated with ionizing radiation, its related risks and with use of potentially nephrotoxic contrast agents [26]. Furthermore, dynamic evaluation or ventricular functional evaluation is possible in retrospective ECG-gated scans. However, this is associated with a higher radiation dose [26]. The use of CT is limited in patients with high or irregular heart rates and also in the characterization of tissues [26]. Finally, CT has limited value in the assessment of the valve function or for the detection of small vegetation’s (<4 mm) and small valve perforations. [26, 28].
The CT is technically limited in showing all TV leaflet positions at a specific time frame of the cardiac cycle in one short-axis plane, therefore, when assessing TV leaflets, a combination of different views is required. The four-chamber view is the most appropriate view to assess the septal leaflet, and in some cases, only in this projection small defects of the membranous septum can be seen [20]. Furthermore, the septal isthmus width, visualization of its relation with the coronary sinus orifice and the atrioventricular node artery can be measured with the four-chamber view [20]. The relationship of the anterior and posterior leaflets can be depicted with the two-chamber CT of the right heart, and, this is the optimum view to measure the cavotricuspid isthmus superior to the hinge of posterior TV leaflet, which might be difficult to visualize trough TTE. The long-axis views can be used for the evaluation of TV prolapse. Furthermore, when there is tethering of the leaflets and regurgitation due to incomplete coaptation of the leaflets, the distance and area of tethering (tenting) can be measured by CT. The dimensions of the TV annulus can be measured through the reconstructed short-axis view, by measuring the maximal antero-posterior and septal-lateral diameter of the annulus [21]. The perimeter and annulus area can be assessed by planimetery after the CT is performed [21].
The Right Coronary Artery
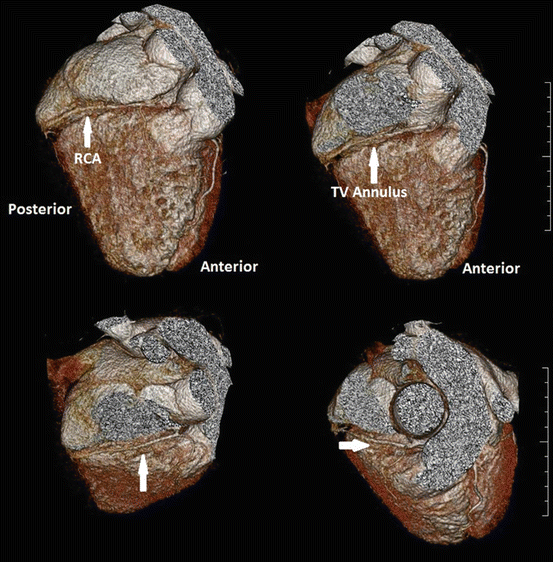
The distance of the right coronary artery (RCA) to the TV annulus and the course of the RCA through the right atrioventricular groove may vary in humans [29]. Information regarding the course of the RCA may be of added value when planning patients for transcatheter interventions that target the TV annulus, due to the risk for impingement of the RCA [30]. CT analysis can be used to determine detailed characterization of the spatial relationship between the RCA and the TV annulus (Fig. 9.5). The mid-diastolic phase volume rendered reconstructions, the two- and four-chamber long-axis and the short-axis views can be evaluated to determine the course and position of the RCA relative to the TV annulus [31]. The position of the RCA relative to the TV annulus can be classified as superior, inferior or at the same level as the TV annulus. The short-axis view can be used to measure the distance between the RCA and the TV annulus at the level of the anterior and posterior tricuspid leaflets insertions, if the RCA courses at the same level as TV annulus [31].


Fig. 9.5
Computed Tomography analysis of the right coronary artery. 3D reconstructions with computed tomography showing the relationship between the right coronary artery and the tricuspid valve annulus
The Right Ventricular Apex
Certain devices, like the Forma Repair System (Edwards Lifesciences, Irvine, California) interact directly with the tricuspid leaflets. Therefore, the TV annulus dimensions and the distance from the annulus to the RV apex should be evaluated, when planning patients for these interventions [32]. To measure the maximal distance between the TV annulus and the RV apex, the long-axis four-chamber view can be used [31].
The Vena Cava
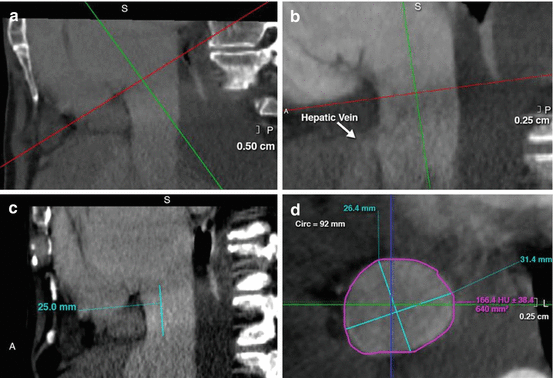
Patients selected for transcatheter caval valve implantations (CAVI) require pre-CAVI imaging with contrast-enhanced, electrocardiogram-gated CTA to assess the IVC dimensions and the distance between the junction of the right atrium and IVC to the first hepatic vein (Fig. 9.6) [33].


Fig. 9.6
Computed Tomography for Caval Valve Implantation. (a) Assessment of the right atrium-inferior vena cava junction plane. (b, c) Depiction of the hepatic vein and (d) Sequential measurements of the horizontal planes for the assessment of the optimal valve size (1 cm below the right atrium-inferior vena cava junction plane and 1 cm above the identified first hepatic vein). Reprinted with permission from “Transcatheter Caval Valve Implantation Using Multimodality Imaging. Roles of TEE, CT, and 3D Printing,” by Brian O’Neill et al., JIMG 2015;8:221–225. Copyright (2015) by Elsevier Inc
The axial view with the multi-planar reformation planes oriented along the RV apex and the coronary sinus can be used to assess the dimensions of the IVC at the transition level with the right atrium down to the level of the first hepatic vein [31, 33]. To reconstruct the double oblique transverse plane parallel to the transition level of the right atrium with the IVC, single oblique and coronal views can be used while aligning the multi-planar reformation planes to the basal part of the coronary sinus [33]. Furthermore, the diameter, perimeter and area of the IVC can be assessed at this level [31]. To assess the dimensions of the IVC at the first hepatic vein, these measurements can be repeated on the double oblique transverse plane at the level of the first hepatic vein (Fig. 9.7) [31].


Fig. 9.7
Vena Cava dimensions assessed through computed tomography. Computed tomography assessment of the inferior vena cava (IVC) dimensions using the Orthogonal axial view (a), single oblique sagittal view (b, f) and the Coronal view (c, g). In order to reconstruct a transverse plane of the entrance of the IVC into the right atrium (d), multi-planar reformation planes were aligned along the transition of right atrium and IVC. Panel (e) depicts the distance between the first hepatic vein and the IVC. The maximal and minimal diameter, perimeter and area of the IVC are measured in h, using a double oblique transverse plane
Surgical Interventions for the Tricuspid Valve
Functional TR is the most common abnormality of TV. When indicated, surgical repair or replacement of the TV is the only currently approved treatment option. There are two surgical options for the TV, it can be either repaired or replaced. In symptomatic patients or patients with sings of RV remodelling and primary TR, surgery is recommended. Furthermore, it is recommended in patients undergoing surgery for the left sided valves with concomitant functional TR. The preference for one of these two techniques depends on the underlying cause of the TV disease. In patients with damaged leaflets due to rheumatic or carcinoid valve disease, as in patients with extreme annulus dilatation, valve replacement is favoured [34]. However, patients require chronic anticoagulation after valve replacement, and in addition, valve replacement is associated with an increased mortality [35]. Therefore, the preferred option is valve repair (Fig. 9.8), which consists of several techniques. Incomplete band or De Vega’s suture annuloplasty and Kay bicuspidization are the most frequently used techniques in patients undergoing left sided valve surgery to treat functional TR [36]. A suture repair has the advantage that it can be performed easily and quickly. However, due to the higher incidence of recurrent TR after suture repair compared to the use of an annuloplasty band, the latter one is more favoured. Detailed surgical TV repair and replacement techniques are presented in Chap. 17.


