1 Transthoracic Three-Dimensional Echocardiography
Background
• Because the heart is three-dimensional (3D), it has been recognized that imaging the heart in three rather than two dimensions can be advantageous for the detailed evaluation of cardiac anatomy and function and better understanding of its pathophysiology.
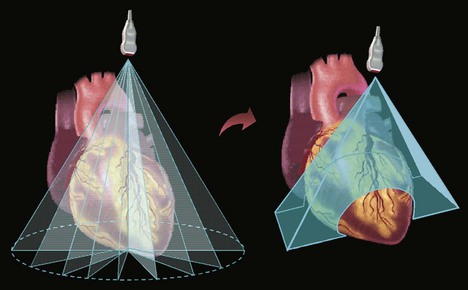
• After a decade of research using time-consuming off-line 3D reconstruction from cumbersome acquisition of multiple two-dimensional (2D) planes, today’s imaging technology has evolved to near real-time three-dimensional (RT3D) ultrasound imaging of the beating heart (Fig. 1-1).
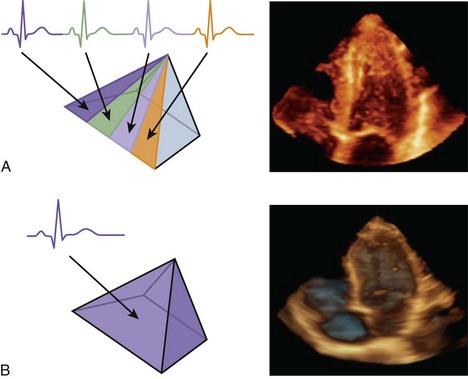
• To overcome the technological challenges associated with the motion of the beating heart, two approaches have been implemented to create a dynamic 3D image throughout the cardiac cycle (Fig. 1-2) by (A) combining subvolumes that are scanned during consecutive cardiac cycles; (B) acquiring the entire heart in a single cardiac cycle by reducing the number of frames.
• While approach B may be problematic in this regard because fast motion appears “choppy,” it is advantageous over approach A in patients with irregular heart rhythms because it circumvents “stitch artifacts” and creates cohesive images at any phase of the cardiac cycle.
• Approach A is difficult to use with stress testing because of rapid changes in the inotropic and chronotropic state of the heart, which frequently result in stitch artifacts.
Key Points
• There are two general approaches to RT3D echocardiography (RT3DE): combining subvolumes that are acquired from consecutive cycles (approach A) and acquiring the heart volume in single cardiac cycle (approach B).
• Approach A has better temporal resolution but is limited by linear artifacts where the subvolumes are joined (stitch artifacts), particularly when the heart rhythm is irregular or where cardiac function is changing quickly (stress echo).
Left Ventricular Volume
• The evaluation of left ventricular (LV) volumes is an integral part of clinical echocardiography, since accurate estimates of LV volumes provide important information for multiple clinical scenarios.
• The accuracy of the traditional 2D techniques for LV volume quantification is limited by their reliance on geometric modeling and by foreshortening of apical views of the left ventricle (LV).
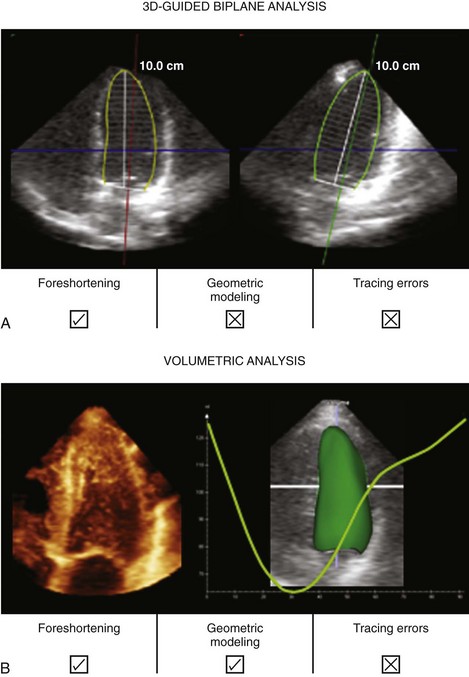
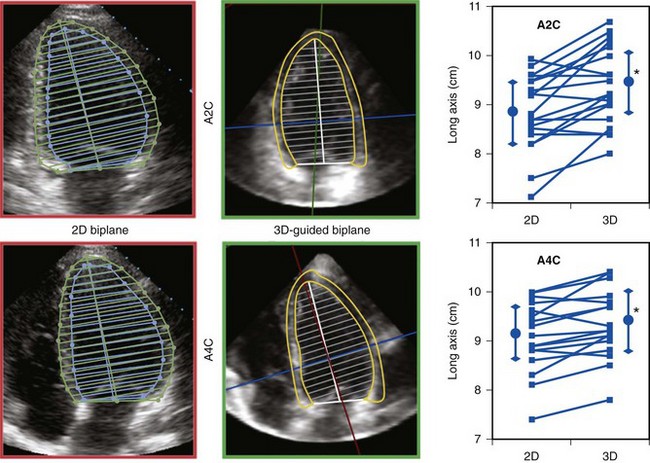
• There are two approaches that are commonly used for LV quantification from RT3DE datasets (Fig. 1-3): (A) 3D-guided biplane technique—by selecting from a pyramidal dataset two anatomically correct non-foreshortened 2D views, from which LV volumes are calculated using a biplane approximation, and (B) direct volume quantification—based on semi-automated detection of LV endocardial surfaces followed by calculation of the volume contained within this surface.
• When compared with conventional 2D echocardiographic measurements, RT3DE-derived LV volumes and ejection fraction (EF) show higher levels of agreement with the respective reference technique, such as radionuclide ventriculography or cardiac magnetic resonance imaging (MRI).
• The improved accuracy and reproducibility of RT3DE-based LV volume and EF measurements is of vital importance because clinical decision making relies heavily on these measurements.
• Despite the improved accuracy and reproducibility, recent studies have reported that RT3DE consistently underestimates LV volumes.
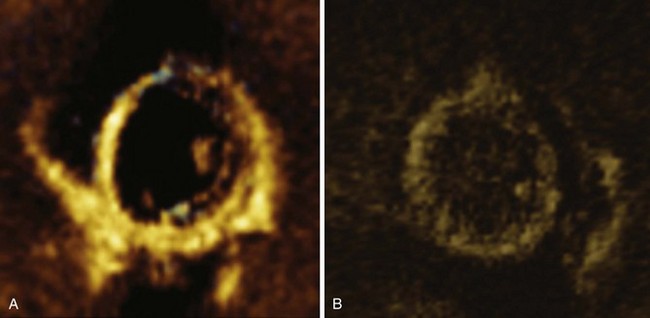
• Tracing errors were identified as the main cause of volume underestimation, since the spatial resolution of RT3DE images may not be sufficiently high to differentiate between the myocardium and endocardial trabeculae in all patients (Fig. 1-4).
Technical Considerations
• While the 3D-guided biplane technique (A) can minimize LV foreshortening, it still relies on geometric modeling to calculate volumes, and is thus likely to be inaccurate in distorted ventricles.
• Because direct volumetric quantification (B) is not affected by LV foreshortening and does not rely on geometric modeling, this approach is more accurate even in the presence of wall motion abnormalities and distorted ventricular shape.
• While volumetric quantification requires specialized software, the 3D-guided biplane technique is a reasonably accurate alternative for LV volume measurements.
Left Ventricular Mass
• LV mass is an important predictor of morbidity and mortality, especially in patients with systemic hypertension.
• However, similar to the accuracy of 2D echocardiographic measurements of LV volume, measurements of LV mass are also limited by the frequent inability to obtain anatomically correct apical views and geometric modeling of asymmetrical ventricles.
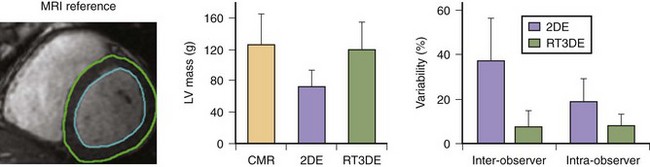
• In addition to accurate detection of the endocardial boundaries, LV mass measurements rely on accurate detection of the epicardium (Fig. 1-5, left and middle), which in most patients is extremely challenging.
• LV mass can also be measured using either one of the two approaches utilized to measure LV volumes from RT3DE datasets: the 3D-guided biplane technique or volumetric analysis (see Fig. 1-3).
• RT3DE-derived LV mass measurements avoid the use of foreshortened apical views (see Fig. 1-5, right).
• As a result, RT3DE-derived LV mass measurements are more accurate than the conventional biplane 2D techniques (Fig. 1-6, left).
• Also, RT3DE-derived LV mass measurements are more reproducible (see Fig. 1-6, right), because they are less view dependent.
Technical Considerations
• To obtain accurate LV mass measurements from RT3DE datasets, the same guidelines for endocardial tracing as for LV volume measurements (see above) should be strictly followed to avoid underestimation of LV mass.
• In addition, epicardial boundaries should be carefully initialized and adjusted when necessary in multiple views.
• While volumetric quantification requires specialized software, the 3D-guided biplane technique is a reasonably accurate alternative for LV mass measurements.
Key Points
• There are two approaches to using 3D echocardiography to determine LV volumes and mass: the 3D-guided biplane or the volumetric technique.
• Both approaches provide measures of volume and mass that are more reproducible and correlate better with gold standard (MRI) values than those derived with 2D echocardiography, in part because they avoid foreshortening the apex.
Left Ventricular Wall Motion
• Echocardiography is the most widely clinically used imaging modality for the evaluation of regional LV function. This is usually achieved by visual inspection of the beating ventricle in multiple cross-sectional planes that depict all 17 myocardial segments.
• The ability to capture the complete dynamic information of the LV in a single heartbeat lends itself to the analysis of regional wall motion.
• RT3DE allows visualization and evaluation of LV wall motion in different planes. Once the 3D dataset is acquired, image planes can be extracted in any desired orientation.
• Importantly, the ability to visualize the same LV segment in multiple planes can help in determining the extent and severity of the wall motion abnormality.
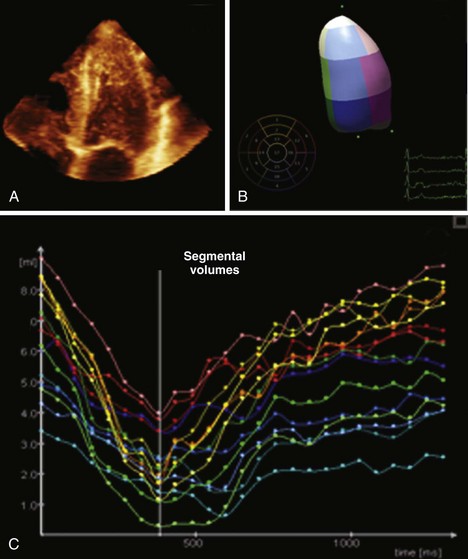
• Beyond visual interpretation, dynamic RT3DE datasets can be analyzed to obtain objective quantitative measurements of regional LV function. One such measure is segmental EF, which can be accurately calculated from segmental volumes (Fig. 1-7).
• All these features translate into improved accuracy of the echocardiographic diagnosis of ischemic heart disease.
Stress Testing
• Although stress echocardiography has become a widely used technique for the diagnosis and risk stratification of patients with suspected or known coronary artery disease, 2D stress echocardiography has methodologic limitations.
• 2D image acquisition during peak exercise may be impaired by: (1) probe positioning errors resulting in inadequate image planes; (2) reduced quality of transthoracic images with poor visualization of LV walls; (3) time-consuming acquisition of multiple imaging planes that need to be acquired within a narrow time window, while wall motion abnormalities are still present; and (4) subjectivity of image interpretation leading to poor interobserver agreement.
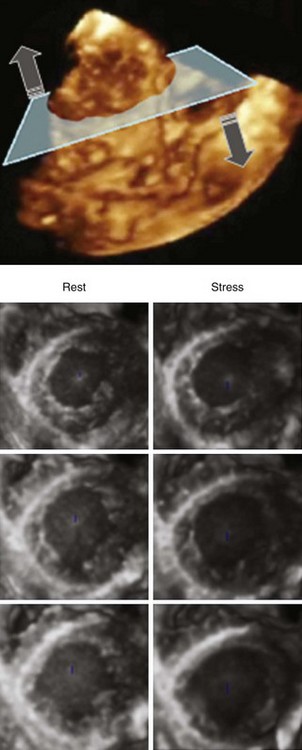
• Several of these limitations can be solved using RT3DE, which allows simultaneous visualization and evaluation of LV wall motion in different planes at different levels of the LV. Besides the conventional two-, three- and four-chamber views, multiple parallel short axis slices can be used for systematic assessment of regional wall motion, including side-by-side comparisons of rest and stress (Fig. 1-8).
• While acquisition of a complete pyramidal dataset greatly reduces the time required to capture a complete set of views during a stress test, serial acquisition of subvolumes during consecutive heartbeats is not ideal because of the rapid changes in heart rate.
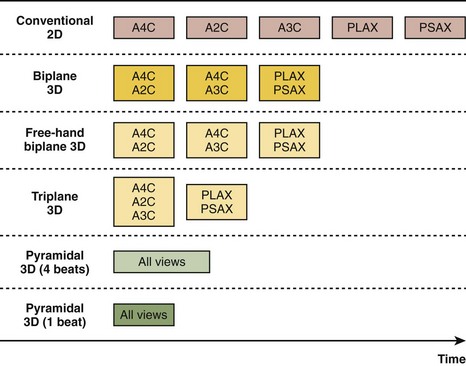
• The alternative of simultaneous acquisition of multiple planes using either biplanar imaging (two orthogonal or nonorthogonal views) or triplanar imaging (three planes at 60-degree increments) also represents an improvement over 2D imaging (Fig. 1-9).
• Both exercise stress (either bicycle or treadmill) and pharmacological stress (mainly dobutamine plus atropine), which improves image quality and increases the available time for imaging during peak stress, have been used with RT3DE techniques.
• To improve endocardial delineation when necessary, left heart contrast agents have been used with stress RT3DE as well (Fig. 1-10).
• One advantage of contrast-enhanced biplane or triplane imaging for stress testing is that conventional 2D harmonic settings can be used, while acquisition of pyramidal volume datasets with contrast enhancement relies on settings that are not yet well defined and optimized.