Fig. 19.1
The Philips X7-2t 3D TEE probe. (a) Shows the handle of the probe; it has identical controls as a standard 2D TEE probe. When used for 2D TEE imaging, the multiplane angle control (shown) rotates the imaging plane between 0° and 180°. (b) Is a photo of the Philips adult transesophageal (TEE) 3D and 2D probes side by side. Note that the 3D TEE probe is slightly larger than its 2D counterpart
The typical 2D multiplane TEE probe consists of a phased array transducer containing 64 piezoelectric crystals (elements) placed side by side in a rectangular row (Fig. 19.2a). As described in Chap. 1, sequential activation of these crystals produces a beam that is steered to obtain a flat, pie-shaped scanning plane. This creates the standard tomographic 2D images customarily seen with the TEE systems currently in use. In a 2D multiplane TEE probe, the rectangular array of elements is physically rotated (electronically or mechanically) in a semicircular manner between 0° and 180° (Fig. 19.2a), thereby obtaining the various 2D TEE tomographic images commonly seen in this and other sources. In contrast, the 3D TEE probe contains a matrix array of 2,500+ piezoelectric crystals arranged in a square 10 × 10 mm grid (Figs. 19.1b and 19.2b). The individual elements are electrically independent, allowing for generation of scan lines than can vary both azimuthally (laterally) and elevationally (Fig. 19.2b). Thus a pyramidal 3D “wedge” of acoustic raw data information can be obtained and subsequently processed into Cartesian coordinates using a 3D scan converter; each discrete point in the scan converter is known as a voxel (“volumetric pixel”), which is cubic in shape and carries a discrete coordinate in 3D space as well as a value for echo intensity [14–16]. This is analogous to the pixels (picture elements) used to form a 2D image. Voxels therefore constitute the basic components used to construct a 3D dataset [5]. Since voxels represent discrete data points, interpolation is used to fill in the gaps between the voxels, using adjacent data of similar characteristics [15].The resultant 3D image depends upon the size and density of the voxels. Analogous to 2D imaging, smaller voxels and increased number of scan lines lead to a higher voxel count and less data interpolation, which in turn enhances the spatial resolution of the 3D image. However the tradeoff is temporal resolution. There is a large volume of data (several thousand scan lines) that needs to be collected and processed for a single 3D volume dataset, and if the processing of this dataset were performed in a manner akin to standard 2D echocardiography, the time required would result in unacceptably low frame rates. To address this, parallel beamforming (parallel processing) is utilized. In this technique, the system transmits one wide beam and receives multiple narrow beams in parallel [17], which enables much faster 3D image processing, thereby permitting the motion of the 3D images to be displayed at clinically acceptable frame rates. Nonetheless as a result of the greater data processing requirements, the current frame rates for live 3D imaging are still much less than those achievable by conventional 2D imaging. Also, parallel beamforming comes at a cost: there is an accompanying increase in the amount of electronics, as well as size, cost, and power consumption of the system [17].
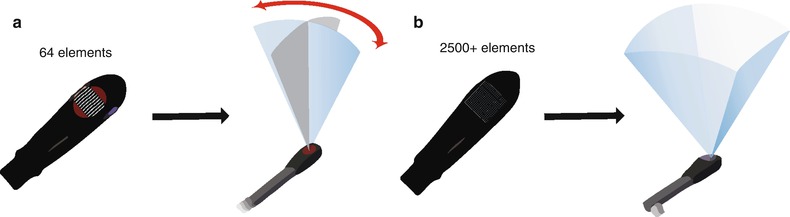
Fig. 19.2
Diagram of adult transesophageal (TEE) 2D and 3D probes. (a) Illustrates a standard multiplane 2D TEE probe, which uses a linear phased array containing 64 piezoelectric elements. Using a control on the TEE probe handle, the array is physically rotated either electronically or mechanically to obtain a multiplane angle between 0° and 180°. (b) Illustrates a 3D TEE matrix array probe with over 2,500 elements arranged in a square grid. Scan lines are generated both azimuthally (laterally) and elevationally, thus a pyramidal volume can be obtained, enabling the acquisition of a 3D volume dataset
The process of displaying a 3D data set on a 2D computer screen is known as rendering, and can be performed by one of several different methods. The first method, known as wireframe rendering, shows the surface of a structure as a series of lines connected together to form a mesh of interconnected polygons that altogether form a cage-like, wireframe 3D model of the surface of the heart (Fig. 19.3a). This method was originally designed for computer-assisted design and manufacturing (CAD/CAM), and is well suited for ventricular wall motion although it cannot display more complex internal structures such as valvular structures [5]. The second method is known as surface rendering. Similar to wireframe rendering, surface rendering displays the details of a structure’s surface but defines more points to present a solid appearance (Fig. 19.3b). Both wireframe and surface rendering utilize manual tracing or semiautomatic border detection algorithms (identification of blood-tissue boundary) to trace the endocardium in cross-sectional images derived from segmentation of the 3D dataset; these are then used to generate a 3D model of the surface and shape of the structure in question (usually a ventricle). This 3D/4D volume “cast” can then be used for quantification of ventricular volume, synchrony and function [14]. The third method of rendering, known as volume rendering, is the method used most frequently in real-time 3D imaging, particularly for the evaluation of structural abnormalities such as those seen in CHD. This method preserves all 3D information within the dataset, and rendering is performed to provide a realistic 3D depiction of all the anatomic details within the heart. This is achieved by using different algorithms to cast a light beam through the voxels, and weighting the voxels to obtain a voxel gradient intensity. A variety of digital shading and lighting techniques (perspective, light casting, and depth color-coding) are used to achieve the perception of 3D depth and texture on a 2D computer screen (Fig. 19.3c) [18]. Using tools available both on the echocardiography machine as well as offline, these volume datasets can be sectioned (cropped) from any number of different viewpoints, and rotated to reveal the spatial relationships of atrioventricular/semilunar valves and complex intracardiac anatomy. Also, the source of the light beam (and therefore shading/lighting) is projected to maintain a sense of depth and three dimensionality, even while the 3D volume dataset is rotated and sectioned. Volume rendered datasets can be displayed in four principal modes:
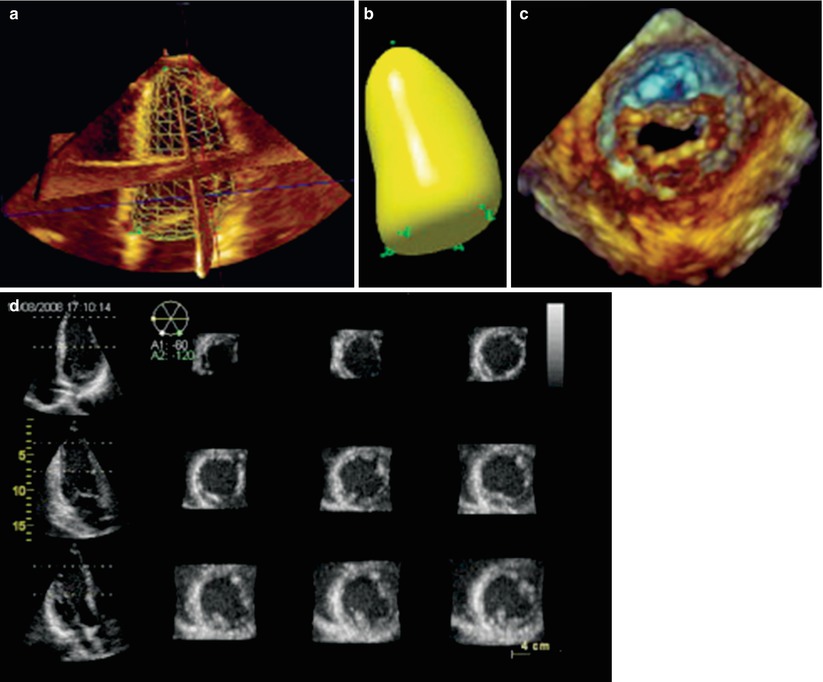
Fig. 19.3
Examples of different modes in which 3D echocardiographic data sets can be visualized and rendered. The techniques used to display the images can be divided into four broad categories: wireframe (a), surface rendering (b), volume rendering (c), and 2D tomographic slicing (d). These displays were obtained from transthoracic 3D imaging, but the principles of image rendering and display apply equally with 3D transesophageal imaging (Reprinted from Lang et al. [18]; with permission from Elsevier)
Real–time (Live) 3D. This mode, activated by a single button, provides true live, real-time 3D imaging of the beating heart. However only a portion of the heart is contained in 3D dataset. It is obtained in such a manner that the “front” portion of the dataset (nearest the observer) automatically displays a tomographic slice identical to the 2D image that was shown prior to 3D activation, but with rendered volumetric imaging behind the slice to provide additional information and a 3D perspective (Figs. 19.4a and 19.5, Video 19.1). This 3D mode yields a narrow pyramidal volume with dimensions 30° × 60°. Since the “live” format is truly real-time, no gating to respiration or electrocardiogram (ECG) is necessary. However because the structure(s) in question has been “sectioned” to mimic the 2D tomographic image for visualization and orientation, the resultant 3D dataset will not include the entire structure. This mode has a temporal resolution (frame rate) of 20–30 Hz, which is sufficient for monitoring real-time motion and guiding interventional procedures.
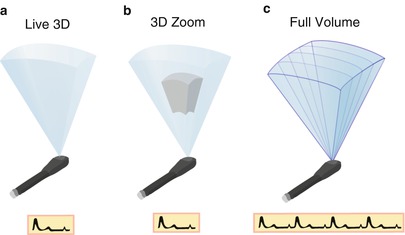
Fig. 19.4
The different modes of volume rendering. (a) Is an illustration showing a Live 3D volume, acquired in one beat and without the need for gating. (b) Shows 3D zoom mode: only data within a small region of interest are acquired, the data are collected in one beat, and no gating is required. (c) Shows a full volume dataset in which four subvolumes that have been sequentially acquired and “stitched” together to form one large volume. Creation of a full volume requires gating to the electrocardiogram
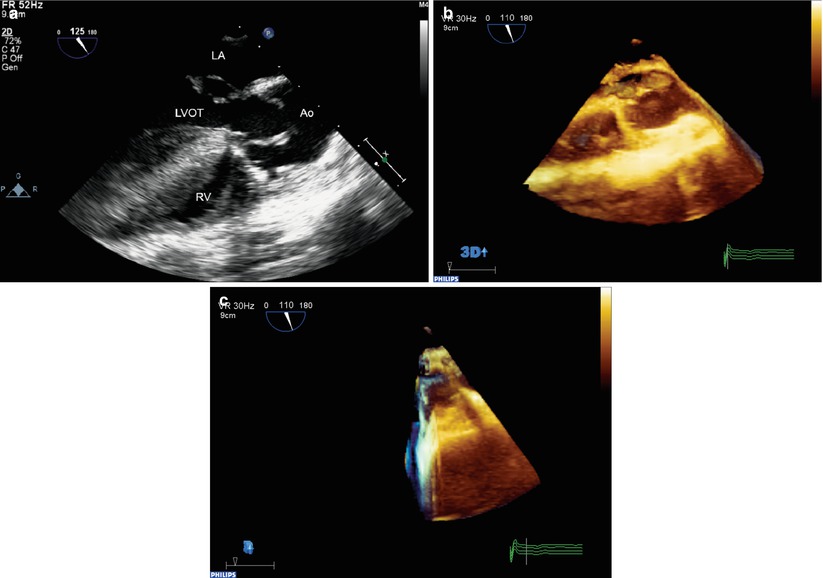
Fig. 19.5
Example of three-dimensional “Live 3D” format in a patient with repaired tetralogy of Fallot and an abnormal aortic valve. A standard mid esophageal aortic valve long axis view (a) was used to position and orient the probe. (b) Shows the “Live 3D” mode volume dataset. Note that the front portion of the dataset displays the tomographic image similar to the standard 2D image, which helps to orient the echocardiographer. (c) Shows the dataset rotated to show the thickness of the volume. Note that volumetric data is obtained behind the image, but the entire aortic valve is not contained in the dataset. Ao aorta, LA left atrium, LVOT left ventricular outflow tract, RV right ventricle
3D Zoom. This mode is also a “live” mode. A specific region of interest (e.g. the mitral valve) is identified, and a smaller volume dataset positioned to provide a focused, magnified, complete 3D visualization of the region as a smaller and narrower pyramid (Fig. 19.4b). The pyramid angles can vary from 20° × 20° to 90° × 90°, with a dimension of 30° × 30° commonly used. By reducing the volume size and focusing solely upon the structure of interest, the entire structure can be contained in the dataset, and the lateral resolution can be improved by increasing the number of scan lines, while still maintaining acceptable frame rates. The live images can still be cropped and rotated in multiple orientations. However progressive increasing of the magnification can produce deterioration in both spatial and temporal resolution (sometimes down to 5–10 Hz) [18].
3D Full Volume. This is a gated acquisition mode in which a large 3D volume dataset is assembled from several adjacent wedge-shaped 3D subvolumes that are collected rapidly and sequentially using ECG-gating. A total of 4–7 subvolumes are obtained and then digitally reassembled or “stitched” into a large pyramidal digital dataset, which is then available for viewing and manipulation (Figs. 19.4c and 19.6, Video 19.2). Strictly speaking, a full volume dataset is not real-time since it represents an ECG-gated assemblage of subvolumes collected sequentially over a matter of seconds, but for all practical purposes it is nearly so because of the very short acquisition and display time. This mode provides excellent spatial and temporal resolution (20–50 Hz, depending upon number of beats captured), and because of the wide dimensions of the volume dataset (90° × 90°), entire structures can be completely captured within the dataset. However due to the gating, full volume datasets can be subject to “stitch” artifact (imperfect alignment of subvolumes) if there is significant respiratory motion or any ECG abnormality.
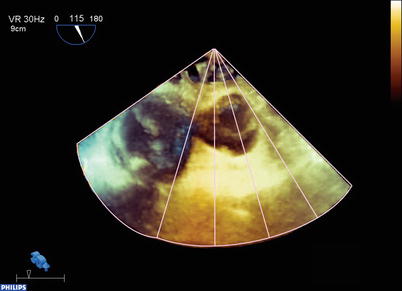
Fig. 19.6
Example of the three-dimensional full volume dataset acquired in the patient from Fig. 19.4. Four subvolumes were collected and rapidly stitched together to form a pyramidal dataset. Now a significant portion of the heart, including the whole aortic valve, is contained in this dataset. The volume has been rotated from its initial acquisition display, and lines have been drawn to illustrate the manner in which the subvolumes are collected and stitched together
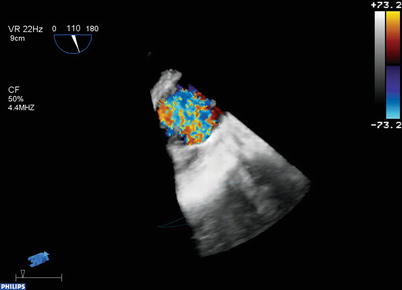
3D Color Doppler. 3D color flow Doppler volume datasets can also be obtained, with the 3D color Doppler information superimposed upon the 3D image information (Fig. 19.7, Video 19.3). These 3D color flow volume datasets are assembled from 7 to 14 thin ECG-gated subvolumes in the same manner as the full volume datasets described above, although they smaller than the full volume datasets. Due to the many subvolumes required, some degree of stitch artifact is not uncommon with these datasets. Also, temporal resolution tends to be reduced (<10 Hz). During post-acquisition review, the dataset can be viewed as only imaging, only color Doppler, and with color Doppler superimposed upon the image, similar to standard 2D/color flow imaging.
Newer 3D software now enables a larger volume of scanning while performing live 3D imaging; often the size of the volume approaches that of the stitched full volumes detailed above. This is termed “single beat” full volume scanning, and does not require ECG-gating; hence it is not subject to artifacts from arrhythmias. However there is a tradeoff, as less information (due to lower frame rates) is available for this single beat. For improved resolution, more data must be obtained over several successive ECG-gated beats (2, 4, or 6), thus replicating the process of the stitched full volume acquisition. The newer software also allows real time 3D color Doppler scanning to be performed, though frame rate decreases appreciably. Again, this can be improved with acquisition over multiple ECG-gated beats. With both the single beat full volume imaging as well as color flow Doppler modes, the selection of an increasing number of ECG-gated beats produces incremental improvements in frame rates, but the potential for stitch artifact also increases.
In addition to its 3D capabilities, the 3D TEE matrix transducer can also function as a standalone 2D multiplane probe, with full 2D, color flow and spectral pulse/continuous Doppler as well as M-mode capabilities (tissue Doppler imaging is available in later software releases). Like a standard 2D TEE probe, the tomographic plane position can be steered between 0° and 180° using a control on the probe handle (Fig. 19.1a). However, unlike a 2D TEE probe, no physical motion of the elements actually occurs at the probe tip—instead the tomographic plane is electrically steered by coordinated activation of the matrix elements to vary scan lines and obtain a multiplane angle between 0° and 180°. Moreover, one of the unique features of the matrix array is that several different 2D tomographic planes can be displayed simultaneously from the same volume dataset, a feature variously known as biplane, triplane, or multiplane imaging (Fig. 19.3d). These can be displayed as equidistant parallel slices (as shown in Fig. 19.3d), three orthogonal planes together, or slices rotated around a common axis. For example, with the Philips 3D TEE system, two different live 2D images can be displayed next to each other using the xPlane mode, as shown in Fig. 19.8, Video 19.4. In this example, mid esophageal four chamber and long axis views are shown simultaneously. Multiplane imaging from a 3D volume dataset has been shown to be useful when evaluating CHD [19].
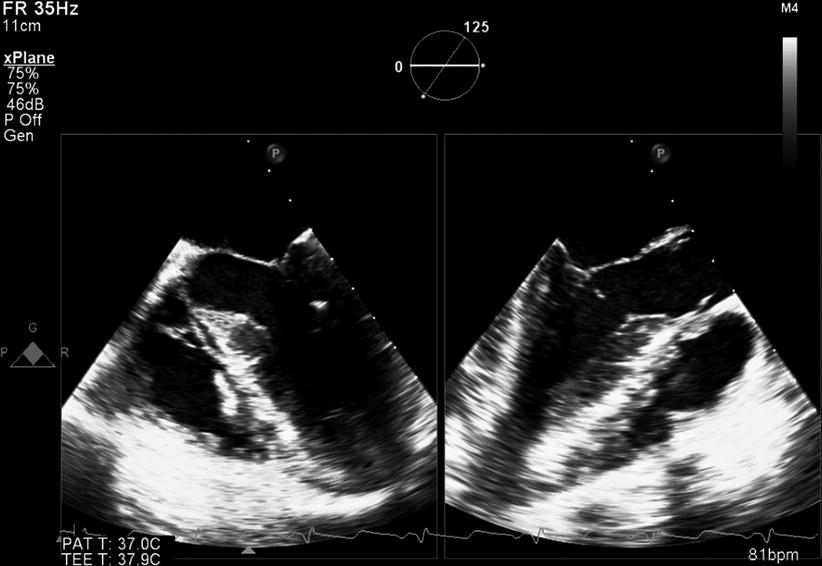
Fig. 19.8
xPlane mode from the Philips X7-2t 3D TEE probe. Two different 2D planes are shown simultaneously in this patient with mild subaortic stenosis. On the left is a mid esophageal four chamber view, on the right a mid esophageal long axis view. The circle on the display indicates the relationship of the two planes
Advantages of Real-Time 3D TEE
With conventional 2D imaging, the tomographic planes, once acquired, cannot undergo further alteration of the views. Instead, further images must be collected by various TEE probe maneuvers and multiplane angles (Chap. 4) to provide additional visualization of a structure in question. The advantage of real time 3D TEE is the immediate manner in which the volume datasets are available for analysis, and the multiple ways in which a dataset can be manipulated to yield novel anatomic perspectives not visible by 2D imaging. Two important maneuvers are used to evaluate a rendered 3D dataset; these maneuvers are unique to 3D imaging, and not used for 2D imaging. The first maneuver is cropping, in which a flat plane can be used to section the heart from any desired angle or perspective (Fig. 19.9, Video 19.5). This maneuver “crops away” a portion of the heart adjacent to the structure of interest, thereby enabling enhanced visualization of the structure, often in a manner or from a vantage point that cannot be provided by conventional 2D imaging. Examples of this include an en face view of the atrioventricular valves, or an en face view of an atrial or ventricular septal defect. The second maneuver is rotation: the dataset can be rotated (cropped or uncropped) in any direction to provide different views of the structure in question from a number of perspectives, e.g. visualization of an atrial septal defect, first from right atrium, then from the left atrium. Rotation enhances the understanding and appreciation of the 3D layout of the cardiac structures. Together, cropping and rotation enable the examiner to perform a “virtual dissection” of the heart. For those observers less familiar with the more unconventional cropped views, a 3D volume dataset can also be cropped and rotated to provide images that resemble their analogous (and more recognizable) standard 2D TEE images. Moreover, the multiplane 2D mode allows production of simultaneous high quality 2D TEE images, which are sometimes more familiar to viewers (Fig. 19.8, Video 19.4). Dataset viewing and manipulation can be performed directly on the echocardiography machine, or subsequently offline on a computer workstation equipped with 3D rendering/analysis software.
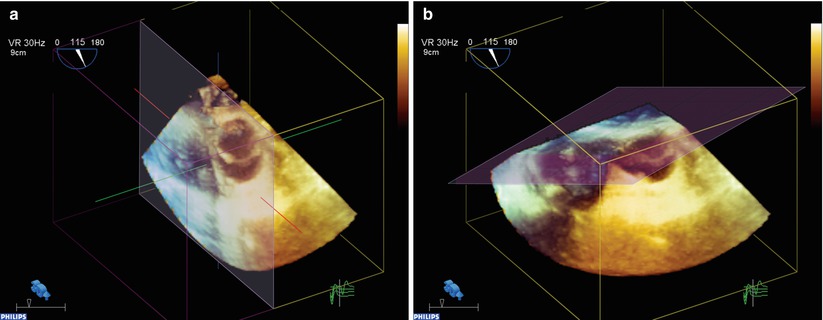
Fig. 19.9
Example of cropping of a full volume dataset in the patient from Figs. 19.4 and 19.5. (a, b) Show the full volume dataset cropped in different planes: one of the standard perpendicular (x,y,z) cropping planes (a), and an “anyplane” cropping mode that can be performed from any angle (b). The latter can be used to visualize the intracardiac anatomy from a multitude of different perspectives
At our center, we first evaluate the area of interest in a “live” 3D TEE format. This mode allows for changes in threshold and gain settings with immediate feedback. Using the live data sets for transducer orientation, the full volume data sets are then obtained. Respiration is suspended by the anesthesiologist during the acquisition phase. This acquisition phase is short, i.e. four to eight cardiac cycles, and does not create respiratory/cardiac compromise. With experience, the echocardiographer can perform rapid manipulation and analysis of both live and full volume 3D TEE datasets at the bedside; specific cardiac abnormalities can be immediately segmented and displayed for the surgeon. The full volume acquisitions in particular provide a broad, encompassing display of large portions of the heart. This can enable an excellent display of the anatomy and spatial relationships of the various cardiac structures.
3D Image Display
At our center we have developed specific anatomic displays of the 3D images. We have found this to be important for several reasons. First, this establishes the underpinnings of the anatomic display to enhance understanding and communication between the surgeon, cardiologist and anesthesiologist. In particular, we strive to portray the 3D images similar to the view or perspective of the cardiovascular surgeon. Second, with experience we have learned the specific cut planes that best depict the optimal imaging information for the specific defects. Third, with time, we believe this will establish a more universal or ubiquitous imaging display orientation to enhance understanding and communication with other imaging centers, cardiologists and surgeons.
As mentioned above, the imaging planes have been established to simulate the surgeon’s perspective of the anatomic defect. For example, if displaying the mitral valve from above, i.e. atria, the anterior aspect is to the top of the screen and the more superior aspect to the left. This will place the anterior leaflet to the superior/leftward aspect of the monitor screen, and the mural or posterior leaflet to the right/inferior aspect of the monitor, (Fig. 19.10, Video 19.6).
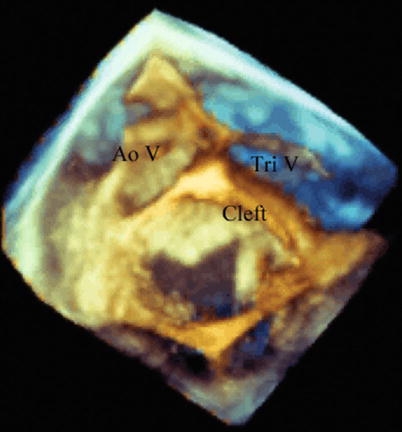
Fig. 19.10
Left atrial view imaging the superior surfaces of the left atrioventricular valve in a 23 year old woman who had previous closure of a primum atrial septal defect and had progressive left atrioventricular valve regurgitation. The aortic valve or superior aspect of the heart is to the left, and the anterior aspect, tricuspid valve, is to the top of the screen. During diastole a significant residual cleft in the anterior leaflet is easily seen, with thickened leaflet edges. Ao V aortic valve, Tri V tricuspid valve
Again, to establish conventional imaging planes, the aortic valve is displayed similar to the surgeon’s view as if looking from the aortic root onto the superior aspects of the valve (Fig. 19.11, Video 19.7a and 19.7b). Thus, the right coronary leaflet is to the top, and the left coronary leaflet is to the left and inferior. The non-coronary cusp is to the right and inferior. Creating these specific-anatomic orientations is essential for optimal communication with the surgeon.
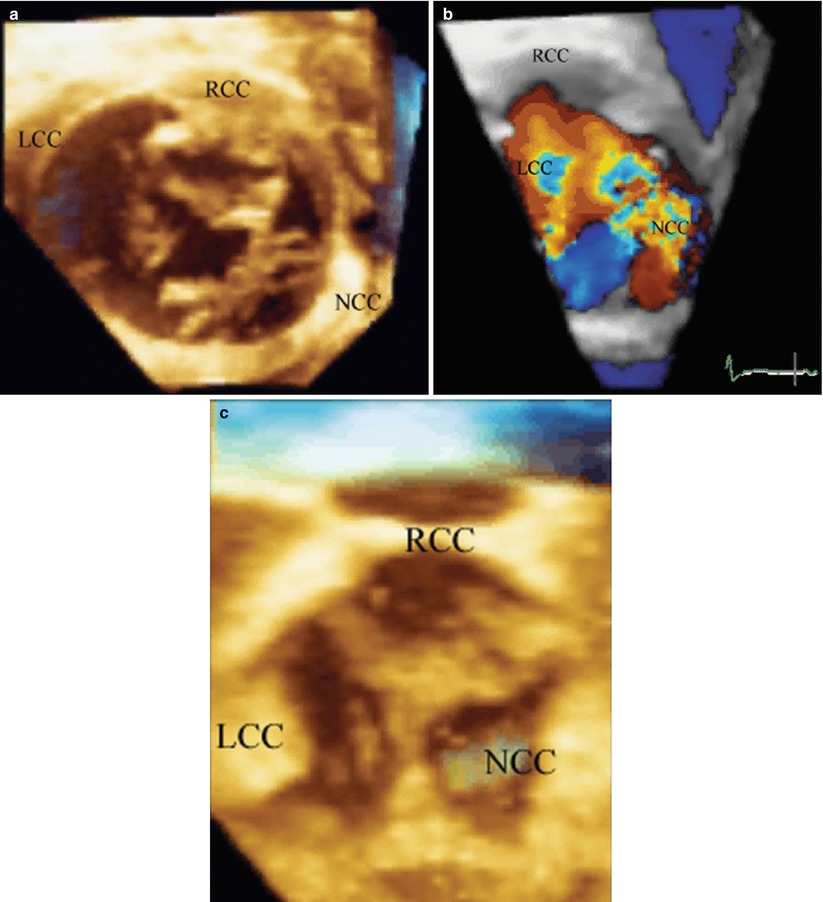
Fig. 19.11
A 12 year old with severe aortic regurgitation. Images are constructed to view the superior surface of the aortic valve as if looking from the aorta down on to the leaflets. To the top is the right coronary cusp, to the left the left coronary cusp, and to the right is the non-coronary cusp. (a) Is obtained during the pre-bypass period and shows the marked lack of coaptation and resulting area of regurgitation due to the retracted, scarred non-coronary cusp. (b) Verifies color protruding through the region on the regurgitant orifice area of the non-coronary cusp. The patient had pericardial replacement of the non-coronary cusp, and pericardial extension of the right and left coronary cusps. The resultant post bypass 3D echo, (c) shows excellent coaptation of all three leaflets. LCC left coronary cusp, NCC non-coronary cusp, RCC right coronary cusp
The transducer orientation depends on the specific anatomic abnormality. Naturally for the aortic valve the transesophageal imaging plane is set to obtain good short and long axis views. Both live and full volume gray scales, as well as color flow full volume acquisitions, are obtained in both the short axis and corresponding orthogonal imaging planes. One might argue that orthogonal image acquisitions would not seem to be necessary in that all the information should be within the full volume data set. If optimal temporal and spatial gating is met, imaging artifacts should not be present regardless of the segmentation planes. Nonetheless spatial artifacts can be present, and some will be more apparent depending upon the acquisition orientation.
3D TEE for CHD Evaluation
Considerations for 3D TEE in the Evaluation of CHD
One of the most often asked questions is: which patients should get a 3D echocardiographic study, in addition to standard 2D imaging? This is especially germane to 3D TEE imaging, which requires some additional effort compared to 2D TEE imaging. At our center, the surgeon most often requests 3D echocardiographic imaging especially for valve repairs [20–23]. Beyond this straightforward answer, 3D imaging is applied to particular congenital heart abnormalities in which a 3D perspective would provide important additional information in addition to 2D imaging. Another 3D TEE application includes imaging in certain congenital defects that have often required multiple re-operations. Hence any imaging that might be useful in providing information to the surgeon to enhance the repair and prevent re-operation would be advantageous. This certainly would apply to congenital heart defects such as complex atrioventricular canal defects [6], complex left ventricular (LV) outflow tract obstructive lesions [24], or repair of Ebstein anomaly of the tricuspid valve [25]. As discussed below, 3D TEE has proven application for catheterization closure of atrial and ventricular septal defects [26–29]. It provides important spatial imaging that can significantly enhance anatomic assessment of these defects. Furthermore, it can provide real-time information during the device deployment procedure, thereby guiding more precise device placement, and helping to reduce fluoroscopic imaging time.
The currently available real-time 3D TEE probes are relatively large, and their use in pediatric patients is limited by patient size. They are suitable primarily for older children and adolescents >25–30 kg, although successful probe insertion down to 15.5 kg has been reported [13]. Nonetheless even in older patients with CHD, 3D TEE has found widespread utility in a number of different clinical settings. For example, 3D TEE imaging is readily applicable in the catheterization laboratory. This applies not only for visualization of the atrial and ventricular septal defects for device closure, but also for detection of thrombus formation for patients considered for electrical cardioversion. In the ambulatory setting, 3D TEE can be used for the adolescent or adult patient in whom surgery is contemplated, when transthoracic imaging is suboptimal and cardiac MRI imaging either not feasible or contraindicated. Thus, a patient may undergo a 3D TEE study to determine the feasibility of either catheterization or surgical based intervention. Naturally, 3D TEE is also used in the operative setting. Often 3D TEE has better imaging resolution than transthoracic 3D echocardiography, hence the preoperative study serves a vital role by providing important imaging planes for the surgeon to aid in the planning of the operation. Postoperatively, this imaging can be applied during separation from bypass to evaluate the success of the surgery.
Clinical Application for 3D TEE in the Evaluation of CHD
Much of the published literature on the subject of 3D echocardiography for CHD evaluation is based upon extensive experience with real-time transthoracic (and even fetal) 3D echocardiography [30–36]. However, the matrix array technologies for real-time transthoracic and transesophageal 3D echocardiography are very similar, and therefore one can expect considerable overlap between the two modalities in terms of clinical applications. The major advantage of 3D TEE is the enhanced resolution of the 3D images, particularly in larger patients with poor transthoracic windows. Furthermore TEE is typically performed in more controlled clinical settings (often intubated patients undergoing general anesthesia), thus permitting better acquisition of full volume datasets. Thus there is a growing body of literature documenting the expanding clinical applications of 3D TEE for CHD evaluation [13, 36–39]. Up to the present time, most of these applications focus upon structural/morphologic evaluation of CHD, primarily in the intraoperative and interventional catheterization settings (as befits the most common venues for TEE in this setting). In this section, some of the more common clinical applications will be discussed. Not all applications of 3D TEE can be presented; however, examples of specific CHD abnormalities most commonly evaluated will be discussed below.
Evaluation of Atrioventricular Valves
Evaluation of the atrioventricular valves represents one of the most well-established indications for 3D echocardiography in adults and children. A number of studies have documented the utility of both transthoracic and transesophageal 3D echocardiography, especially for mitral valve disease in adults [18, 20, 40, 41]. In particular, 3D echocardiography enhances the anatomic visualization of all levels of the atrioventricular valve—leaflets, chordae, and papillary muscles. Moreover 3D echocardiography is able to display the valve in a manner unavailable by 2D echocardiography, including the en face “surgeon’s view” as described above. In adults, 3D TEE provides a realistic and detailed en face visualization of the individual mitral valve anterior leaflet segments and posterior leaflet scallops [40]. The same holds true for congenital atrioventricular valve abnormalities, in which 3D echocardiography (primarily transthoracic, but also TEE) has proven very useful, particularly for endocardial cushion defects (atrioventricular septal defects) and Ebstein anomaly of the tricuspid valve [6, 25, 42, 43]. A number of studies have also discussed the use of 3D echocardiography for evaluation of mitral valve disease due to parachute mitral valve [44], double orifice mitral valve [45, 46], mitral valve arcade [47], and congenital mitral regurgitation as well as other mitral valve anomalies. There have also been some recently published studies evaluating the utility 3D echocardiography (both transthoracic and TEE) for more precise evaluation of the pathology of congenital atrioventricular valve abnormalities, specifically in regard to mechanisms and sites of valve regurgitation [32, 47]. Some examples of 3D TEE for assessment of congenital atrioventricular valve abnormalities will be discussed below.
Despite excellent surgical results for endocardial cushion defects, a disquieting number of patients require re-operation for left atrioventricular valve stenosis or regurgitation. In patients that require re-operation for valve regurgitation, 3D imaging provides an excellent perspective of residual regurgitation via clefts in the anterior leaflet, (Fig. 19.10, Video 19.6). The length and position of the residual cleft can be depicted, as well as the precise zones of leaflet prolapse. Intraoperative 3D TEE imaging is used pre and post bypass to evaluate the anatomic extent of residual cleft and associated potential stenosis or regurgitation. Figure 19.10 shows the 3D display, similar to the surgeons viewing, i.e. imaging the superior surfaces of the left atrioventricular valve from the left atrium.
Our center has recently embarked on the “Cone” procedure to improve surgical repair of Ebstein malformation of the tricuspid valve [48]. Previous types of valve repair for this anomaly have been associated with variable success [49, 50]. In part, this has been predicated on preoperative imaging that has, to date, not clearly depicted the anatomic abnormalities. The very complex and variable anatomy of Ebstein malformation does not allow for optimal imaging in a standard 2D display. For example, in the most severe form of Ebstein malformation the leaflet structures are displaced anterior and superiorly towards the right ventricular (RV) outflow tract. The long and ample anterior leaflet envelops the RV as it attaches to the infundibulum. This is often unappreciated by 2D imaging, but can readily be appreciated from full volume 3D echocardiographic data sets obtained from 3D TEE studies (Fig. 19.12, Video 19.8a and 19.8b) [25]. Moreover, unusual clefts, and attachments from the RV free wall to the anterior leaflet are well appreciated with 3D TEE (Fig. 19.12a, Video 19.8a). Often a large zone of the regurgitant orifice area can readily be depicted from short axis planes oriented from apex to base (Fig. 19.12b, Video 19.8a). Similar to aortic and mitral valve repairs, a more dynamic and complete depiction of tricuspid valve leaflet structure and coaptation can readily be seen from 3D TEE after separation from bypass in the operating room (Fig. 19.12c, Video 19.8b).
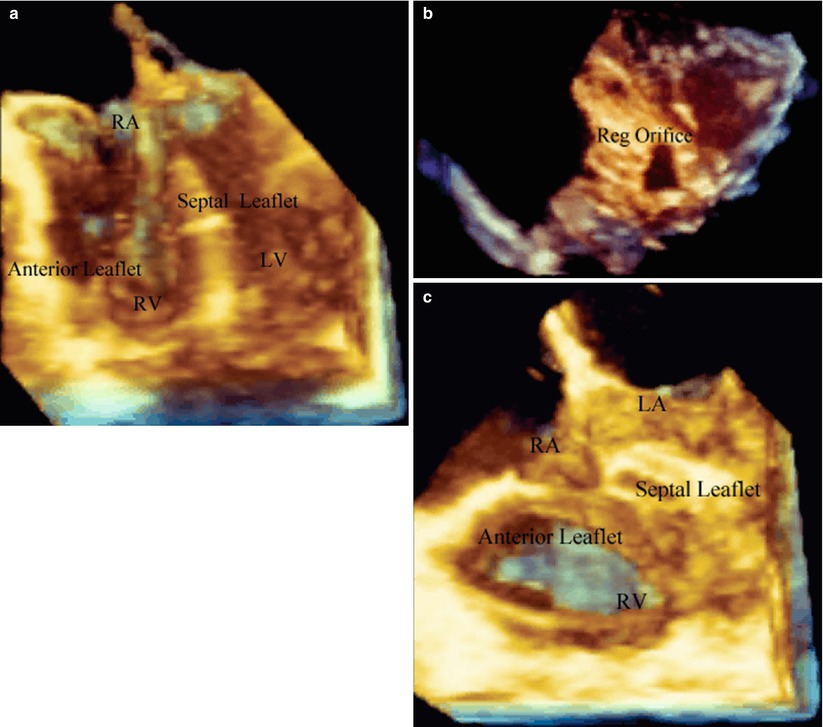
Fig. 19.12
Ebstein malformation of the tricuspid valve. (a) Is a four chamber view of the heart oriented anteriorly and shows a very large anterior leaflet and severely tethered septal leaflet. (b) Is a short axis plane oriented from the RV apex to base of the heart demonstrating a very large zone of non-coaptation (Reg Orifice). (c) Is a post-bypass image in the same patient in (a) after the cone operation. The entire leaflet structure now folds together during systole without a region of non-coaptation. LA left atrium, LV left ventricle, RA right atrium, Reg Orifice regurgitant orifice, RV right ventricle
In addition to native atrioventricular valve pathology, 3D TEE has been found to be useful for the evaluation of prosthetic atrioventricular valves (primarily prosthetic mitral valves) [51]. It allows detailed assessment of valve dehiscence and clot formation. 3D color is especially helpful when evaluating for perivalvar leaks [15, 52].
Evaluation of Semilunar Valves
Aortic valve repair rather than replacement is often preferred in the pediatric patient for obvious reasons. Transesophageal and epicardial 3D echocardiography have become useful for the pre-operative assessment of the pediatric or adolescent patient with aortic valve disease being considered for valve repair [7, 13]. 3D TEE provides important information to determine the precise etiology of valve regurgitation (Fig. 19.11a, Video 19.7a). The specific anatomic defect can be seen, and 3D color flow can be applied to further confirm the abnormality (Fig. 19.11b, Video 19.7a). 3D imaging provides not only for more precise depiction of commissural fusion, but also the more exact site and extent of lack of leaflet coaptation. More importantly, 3D imaging can provide a perspective as to the depth of the valve leaflet, and hence effective areas of leaflet coaptation. 3D TEE can be immediately applied during separation from cardiopulmonary bypass to analyze the integrity of the aortic valve repair (Fig. 19.11c, Video 19.7b). This modality demonstrates the effectiveness of leaflet coaptation and opening, visualizing the depth of leaflet integrity. As seen in Fig. 19.11a–c and Video 19.7a and 19.7b, the 3D echocardiographic images were oriented to simulate the surgeons view, depicting the valve as looking inferiorly (from the examiner’s perspective) onto the superior surfaces of the aortic valve leaflets as if viewed from the aorta.
In adult patients with aortic valve stenosis and/or regurgitation, 3D TEE has been shown to provide anatomic detail regarding valve leaflet morphology and function [41, 53, 54]. Furthermore, the ability to obtain en face views of the valve (both above and below the valve) enables the direct planimetry of the aortic valve orifice area [55] in cases of stenosis, or vena contracta/regurgitant orifice area in aortic valve regurgitation [56]. The information from 3D TEE can be used to complement that from 2D TEE imaging, 2D color flow, and spectral Doppler assessment of the aortic valve (Chap. 11). Combining Doppler velocities of the LV outflow tract (obtained from transgastric or deep transgastric views) with the cross-sectional area of the outflow tract obtained by direct planimetry of the 3D TEE image enables a more accurate calculation of aortic valve area when using the continuity equation. A number of investigators have found the LV outflow tract to be ellipsoid rather than circular in shape, when directly measured by 3D echocardiography (transthoracic or TEE) [18, 57–59]. Thus the use of 3D echocardiography likely results in a more accurate calculation of aortic valve area than the method commonly used with 2D echocardiography [60].
There is little information currently available in either the pediatric or adult literature on the use of 3D echocardiography (transthoracic or TEE) for the evaluation of congenital pulmonary valve pathology. One report using transthoracic 3D echocardiography in adult patients with congenital RV outflow tract abnormalities demonstrated that the pulmonary valve could be visualized in 70 % of patients, but the RV outflow tract in only 40 %. However the anatomic findings, when visible, were useful [61].
Evaluation of Atrial and Ventricular Septal Defects
Evaluation of atrial and ventricular septal defects represents a very important clinical application for 3D echocardiography. This is especially true because of the unique en face views of the atrial and ventricular septa that are provided by cropping the 3D datasets; these views can greatly enhance the understanding of the morphology and extent of the cardiac defects [29, 62–67]. This information is invaluable when planning and performing (monitoring) interventional catheterization procedures [11, 28, 68, 69]. Because of the proximity of the TEE probe to the atrial and ventricular septa, 3D TEE often provides a significantly greater amount of detail compared to transthoracic 3D imaging. Thus 3D TEE is a natural “fit” for interventional catheterization procedures involving the atrial and ventricular septa. As mentioned, 3D TEE imaging can be applied to atrial septal defect closure in the catheterization laboratory. The full circumference of the atrial septal defect can be imaged from the left and right atrium. These en face views allow for depiction of the defect, surrounding rims, as well as the spatial orientation to other anatomic structures (Fig. 19.13a, b; Video 19.9a and 19.9b). In conjunction with live transesophageal imaging, the procedure of closing the defect can be seen from a 3D perspective. This includes the placement of the sheath in the left atrium as well as unfolding of the device in the left atrium. Under simultaneous visualization, the orientation of the disc to the left atrial surface can be seen in a 3D perspective as the device is maneuvered to the left atrial surface (Fig. 19.13c, Video 19.9c). The surface of the disc to the left atrial surface can be depicted prior to deployment. After the left and right atrial discs are deployed, a direct en face view of the disc can be seen to verify the appropriate position (Fig. 19.13d, Video 19.9d).
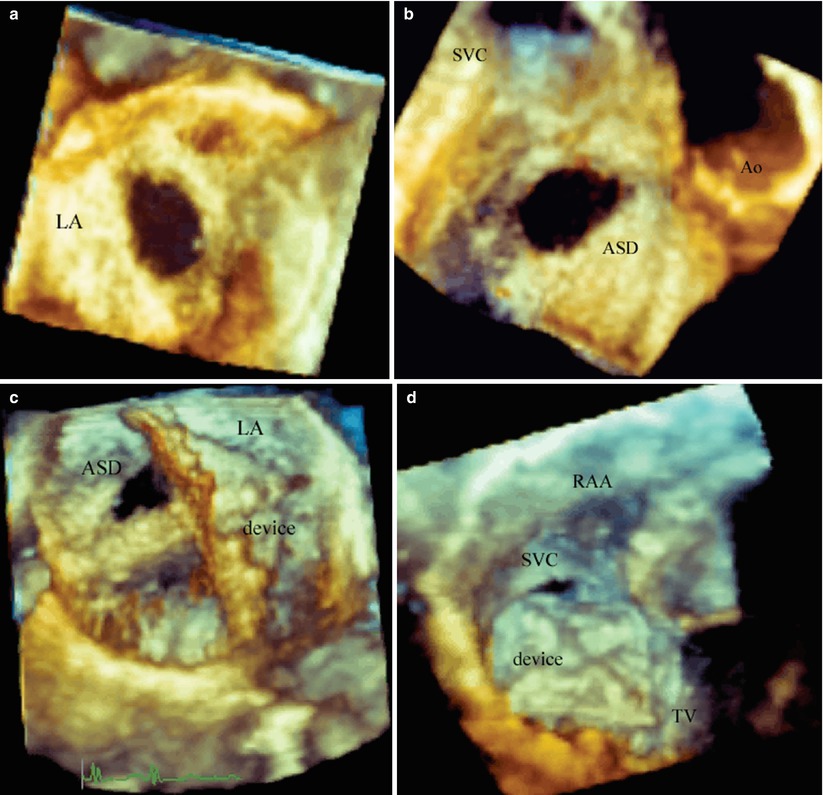
Fig. 19.13
Catheterization device closure of a secundum atrial septal defect. (a) Is a Full volume acquisition displaying an en face view of a secundum atrial septal defect from the left atrium. (b) Is a Full Volume acquisition of the atrial septal defect from the right atrial side demonstrating the relationship to the aorta and superior vena cava. (c) Is a live acquisition from the left atrial view demonstrating the sheath placed through the defect and the left atrial disc deployed within the left atrium. (d) Is an en face view of the right atrial disc after being deployed. ASD atrial septal defect, Ao aorta, LA left atrium, RAA right atrial appendage, SVC superior vena cava, TV tricuspid valve
The advantages that 3D TEE confers to atrial septal defect closure also apply to device closure of ventricular septal defects (both percutaneous and perventricular). 3D TEE assists in all phases of the intervention: from pre-procedure evaluation of defect morphology, to catheter positioning and monitoring of device delivery, to relationship of the deployed device to ventricular septum prior to release, and finally device evaluation following complete release. Only a few studies have yet been published on the use of 3D echocardiography (transthoracic and TEE) for ventricular septal defect device closure [33, 70, 71]. However, given that standard 2D TEE is already an integral part of these procedures [72–78], it seems likely that 3D TEE can only serve to provide additive value in those patients of sufficient size to accommodate the larger probe.
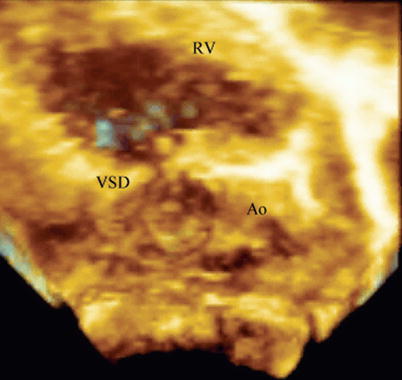
In the intraoperative setting, 3D TEE can provide incremental value in the preoperative assessment of ventricular septal defects prior to surgery. As noted above, 3D TEE enables visualization of ventricular septal defects in unique en face imaging planes not available by standard 2D imaging (Fig. 19.14, Video 19.10). Although 3D TEE might not seem to add significant additional clinical information for surgical closure, certain unusual defects may need a better definition of the spatial relations of the defect to other anatomic structures. Figure 19.15 is taken from a young adolescent followed for many years with a restrictive ventricular septal defect. Although suspected by 2D imaging, 3D TEE provided additional imaging projections to improve understanding of the hemodynamic abnormalities. Figure 19.15 and Video 19.11 show the 3D TEE aspects of severe prolapse of the right coronary cusp of the aortic valve through a doubly committed subarterial ventricular septal defect. The prolapse was so severe that it created moderate RV outflow tract obstruction.