29
Traffic-related urban air pollution
There is widespread recognition that pollution of the air we breathe, by cumulative products of human activity, adversely affects health. Studies of air pollution find evidence for health effects at ever-lower ambient concentrations, leading to continual tightening of air quality standards in developed countries. While these developed countries work to minimize emissions in order to improve air quality, many developing countries are experiencing massive increases in air pollution as a result of economic growth in the absence of emissions controls. Studies over the last two decades show that current pollution levels in cities around the world worsen the burden of lung and heart disease, increase mortality and may affect fetal and newborn growth and development.
Traffic-related emissions represent a major contribution to the burden of ambient air pollution. The role that traffic pollution plays in air pollution health effects, relative to other emission sources such as industry and power generation, remains uncertain. However, the public health impact of traffic-related air pollution is not inconsequential. Künzli et al. [1] studied the overall public health impact of traffic-related air pollution in three European countries: Austria, France and Switzerland. While the individual risk for a significant health related impact of air pollution was small, the public health impact was significant. In the three countries, more than 40,000 deaths (6% of total mortality) were attributable to increases in particulate air pollution, with about 20,000 deaths attributable to traffic-related pollution. The costs associated with the increased mortality and morbidity amounted to 1.7% of the gross domestic product, a cost exceeding that for traffic accidents [2].
Considerable effort is being expended to reduce engine emissions, with some notable success. However, the potential benefits of reduced emissions are often negated by the increased number of vehicles on the road, increased miles traveled by those vehicles, and the persistence of older, high-emitting vehicles. It is anticipated that traffic-related emissions, and their health effects, will increase most dramatically in developing countries. The growth of vehicle sales in Asia is likely to far outstrip that of the rest of the world in the coming decades. Emission and pollution controls have not received a major priority in many developing countries, and thus marked increases in trafficrelated emissions are expected.
The goal of this chapter is to provide a perspective on our current understanding of the health hazards associated with exposure to traffic related air pollution. We will begin with a historical overview, describe the nature of traffic emissions, review current evidence that traffic emissions adversely affect health and finally identify key knowledge gaps and future approaches to the problem.
29.2 History of traffic-related air pollution
Traffic-related air pollution started with the invention and widespread use of gasoline and diesel-powered motor vehicles. Automobiles were first developed in the nineteenth century, and were predominately powered by steam or electric engines. In 1876, Nicolaus Otto developed the first practical four-stroke internal combustion engine,and used itto powera motorcycle.GottliebDaimler constructed the first fourwheel automobile powered by a gasoline engine in 1886. Rudolf Diesel, who was born in Paris, discovered that fuel could be ignited in an engine without a spark. He was granted a patent in 1898 for the first diesel engine. Mass production of gasolinepowered automobiles was underway by the early 1900s, with Henry Ford pioneering assembly-line mass production, and making the automobile available to the masses. The increasing use of the automobile meant that people no longer had to live and work in the city. The past 50 years has seen a steady migration out of cities to the suburbs as improved roadways made this practical, especially in the USA. Commuting to work has contributed to an increased dependence on motor vehicle transport and marked increases in miles traveled.
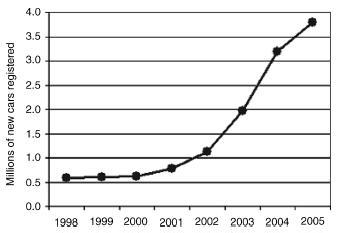
The numbers of cars on the road is increasing in many parts of the world. Automobile traffic in Europe is increasing much more rapidly than other modes of transportation (Figure 29.1). China is experiencing an explosion in the number of automobiles (Figure 29.2), with the number of registered vehicles increasing from about 600,000 in the year 2000, to 3.8 million in 2005. As the number of motor vehicles and the number of miles they travel increases around the world, vehicle emissions will be a growing international concern.
Figure 29.1 Volume of passenger transport in the 15 countries belonging to the EU before May 2004, in 1990, 1998 and 2010 (projection). From World Health Organization [34], reproduced by permission of World Health Organization
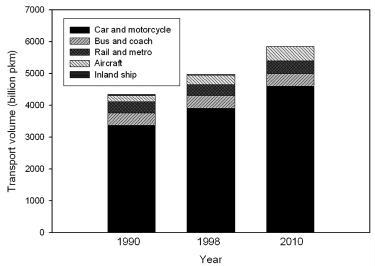
Figure 29.2 New car registrations in China, 1998-2005. From: http://www1.eere.energy.gov/vehiclesandfuels/facts/2006_fcvt_fotw438.xhtml, accessed 2 April 2008
The realization that traffic-related emissions have adverse health effects is a fairly recent phenomenon. Historical air pollution events in the Meuse Valley in Belgium in 1930, Donora, Pennsylvania in 1948, and London, UK in 1952 demonstrated unequivocally that air pollution can kill. The London Fog episode ranks as one of the worst natural disasters in history. During four days of stagnant air and temperature inversion over London, concentrations of particulate matter and sulfur dioxide soared, and more than 4000 people died. These episodes made it starkly clear that air pollution was more than just a nuisance, and spurred efforts to control emissions and establish air pollution standards, including the passage of the Clean Air Act by the US Congress in 1970.
The pollution causing these historical air pollution episodes predominantly represented emissions from industrial processes and coal burning for home heating, not traffic. In developed nations, such ‘point source’ emissions have decreased, in part through improved emission control technology and air pollution regulation, but also as a consequence of outsourcing of industrial production and changing home heating from coal burning to natural gas and electric. In contrast, traffic emissions continue to increase. Today, in developed countries, most human exposure to outdoor air pollution comes from traffic.
Traffic has long been acknowledged as a major contributor to air pollution in major US cities. Table 29.1 summarizes the efforts and milestones in controlling traffic related pollution in the USA. Deterioration of air quality in Los Angeles and other cities in the 1950s and 1960s, and the growing recognition of health risks associated with air pollution, spurred the US Congress to pass sweeping air pollution legislation in 1970. The Clean Air Act established the new US Environmental Protection Agency (EPA) and promulgated an aggressive plan to reduce automobile emissions. The subsequent story of efforts to reduce traffic related air pollution is one of success mixed with compromise and delay. For example, the Clean Air Act emissions standards targeted for 1975 were
Table 29.1 A brief history of US traffic air pollution control measures
| Year | Action |
| 1970 | Congress passes Clean Air Act US Environmental Protection Agency (EPA) established EPA directed to set.National Ambient Air Quality Standards. for six pollutants A 90% reduction in emissions from new automobiles required by 1975 |
| 1974 | Congress delays the hydrocarbon and carbon monoxide standards until 1978 Corporate Average Fuel Economy (CAFE) program: more stringent fuel economy standards |
| 1975 | Catalytic converters introduced Unleaded gasoline introduced |
| 1977 | Congress amends Clean Air Act Hydrocarbon, carbon monoxide and nitrogen oxides standards delayed again |
| 1981 | New cars meet amended Clean Air Act standards for the first time |
| 1982 | EPA lowers the amount of lead allowed in gasoline |
| 1983 | Inspection and Maintenance programs established |
| 1985 | EPA adopts stringent diesel emission standards |
| 1986 | Phase-out of leaded gasoline is completed |
| 1989 | EPA sets fuel volatility limits aimed at reducing evaporative emissions |
| 1990 | EPA limits diesel fuel sulfur content |
| 1990 | Congress amends Clean Air Act: further reductions in emissions, gives EPA authority to regulate nonroad vehicles |
| 1992 | Oxygenated gasoline introduced in cities with high carbon monoxide levels |
| 1996 | EPA regulations target marine engines |
| 1997 | Emission standards for diesel-powered locomotives |
| 1998 | Emission standards for nonroad diesel engines |
| 1999 | Reduced emission standards for new large marine diesel engines Reduced emission standards for SUVs and light-duty trucks |
| 2000 | Plans to reduce sulfur in on-road diesel fuel by 97% by mid-2006 EPA identifies 21 mobile source hazardous pollutants (air toxics) and regulates toxic emissions |
| 2001 | Japanese electric–gasoline hybrid cars hit market |
Modified from: http://www.epa.gov/otaq/invntory/overview/solutions/milestones.htm.
Table 29.2 Strategies for reducing motor vehicle emissions
| More stringent regulation of vehicle emissions Technological advances in engine design | |
| Inspection and maintenance of vehicles | |
| Reduced sulfur in fuels | |
| Increased fuel prices | |
| Reduction in miles traveled: | |
| Carpooling | |
| Increased use of public transport | |
| City planning |
not actually met until 1981. Nevertheless, regulatory efforts overall have been successful in reducing vehicle emissions in the nearly 40 years since the passage of the Clean Air Act. However, much of the benefits related to reduced vehicle emissions have been negated by increased numbers of vehicles and miles traveled. Table 29.2 lists approaches to limiting vehicular travel and emissons.
In order to understand traffic emissions, we must first learn about the various types of combustion engines. Modern combustion engines are internal or external. Diesel and gasoline engines, the two major sources of traffic-related air pollution, are both internal combustion engines. External combustion engines include steam and Stirling engines. Since they do not contribute significantly to traffic-related air pollution, we will not discuss them further in this chapter.
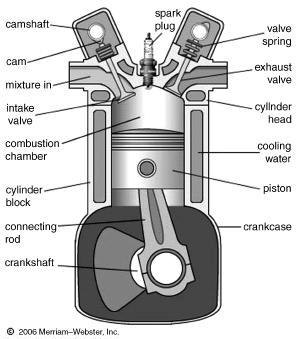
Internal combustion engines have been widely used to power modern vehicles, including almost all automobiles, trucks, motorcycles, boats and aircraft. Their advantages include high power-to-weight ratios and excellent fuel energy density. In internal combustion engines, the combustion of fuel and oxidizer occurs in a combustion chamber (a closed system). Thus, gases are generated at high temperature and pressure and are permitted to expand. This expansion of hot gases applies force to the solid parts of the engine, such as pistons and rotors. Figure 29.3 shows a representative design of an internal combustion engine.
Figure 29.3 Internal combustion engine. The cross section shows one cylinder of a four-stroke internal-combustion engine. In the first stroke (shown), a cam (left) compresses a valve spring, opening the intake valve to admit the fuel-air mixture to the cylinder. Both valves then close, the mixture is compressed by the piston, and current is sent to the spark plug. Ignited by the spark plug, the burning mixture forces the piston down, producing power to turn the crankshaft and run the car. Another cam (right) opens the exhaust valve and the burned exhaust gases exit. From MerriamWebster’s Collegiate Encyclopedia, 2000 by Merriam-Webster Inc. Reproduced by permission of Merriam-Webster. Available from: http://www.britannica.com/eb/art-66070/Cross-section-showing-one-cylinder-of-a-four-stroke-internal (accessed 28 April 2008)
A commonly used internal combustion engine is the diesel engine. In this type of engine, combustion is initiated by the process of self-ignition of the fuel, which is injected after the air is compressed in the combustion chamber. A diesel engine is more efficient than a gasoline engine of equivalent power, resulting in lower fuel consumption. This greater efficiency leads to production of less carbon dioxide (CO2) and carbon monoxide (CO) per unit distance, compared with the gasoline engine.
The second type of internal combustion engine is the gasoline (petrol) engine. In gasoline engines, the fuel and air are pre-mixed before the compression stroke, and combustion is ignited with a spark plug. Gasoline alone has a tendency to ignite early when used in high compression internal combustion engines, so additives are almost always used to retard ignition. Lead was historically used as an additive, but fell out of favor and was removed in the 1980s, because of the discovery of its adverse environmental and health effects. Lead has been replaced by other additives, such as methylcyclopentadienyl manganese tricarbonyl (MMT), aromatic hydrocarbons, ethers and alcohol (ethanol or methanol).
In this section, we will discuss some of the potential environmental issues created by diesel and gasoline engines. Diesel engines can contribute to traffic air pollution, because the exhaust contains large numbers of ultrafine particles containing elemental and organic carbon – so-called ‘black soot’. This may increase the risk for asthma and cancer. Diesel exhaust also includes gaseous pollutants such as nitrogen oxides (NOx), which contribute to the photochemical production of ozone. Because of the potential health risks associated with diesel exhaust, the EPA has enforced the 2008 Locomotive and Marine Diesel Rule, which mandated that all new diesel engines sold in the USA, starting on 1 January 2007, must meet more stringent emission standards with particulate matter (PM) reductions of about 90% and NOx reductions of about 80%, compared with engines meeting the previous standards.
As a result of this regulation, the newer diesel engines have been designed with addition of some of the following features: (1) a diesel particulate filter to filter out PM from the exhaust system; (2) diesel oxidation catalysts to break down pollutants into harmless gases; (3) exhaust gas recirculation, selective catalytic reduction, and NOx absorber technologies to reduce NOx emissions; (4) utilization of ultra-low sulfur diesel fuel; and (5) a new combustion chamber to maximize power output, fuel efficiency and reduce combustion emissions (Figure 29.4). However, because diesel engines generally have a long road life, years must pass for the new emission reductions to have a beneficial effect.
Like diesel engines, gasoline engines are also important sources of air pollution. Lead additive in gasoline is an important example. Although leaded gasoline was eliminated in the USA in 1986, vehicles running on leaded gasoline prior to that time released a significant amount of lead into the atmosphere, with the potential for adverse health effects, including reduced cognitive abilities, lethargy, impaired hearing acuity, hyperactivity, hypertension, abdominal symptoms, impaired hemoglobin synthesis, male infertility and developmental delay in children.
Combustion of unleaded gasoline can still lead to air pollution with the release of many compounds, such as CO, CO2, NOx, hydrocarbon (HC) and PM. Furthermore, gasoline vapors evaporating from the tank react in the sunlight to produce photochemical smog in the atmosphere.
The emissions from road transport can be categorized into four main classes: (1) hot emissions; (2) cold-start emissions; (3) emissions from fuel evaporation; and (4) nonexhaust PM emissions. In this section, we will discuss each of the four emission patterns in detail.
Hot exhaust emissions are those that occur when the engine has warmed up to its normal operating temperature. Parameters that affect hot emissions include: mean vehicle speed, driving dynamics, vehicle type, fuel and road type. For instance, high vehicle speed demands higher power output, which can in turn increase emissions. On the other hand, when automobiles travel at slow speeds in city traffic, the frequent stopand-go conditions, with increased frequency and intensity of vehicle acceleration and deceleration, can also enhance emissions.
Cold-start emissions are pollutants generated immediately after engine start-up, before reaching normal operating temperature. A vehicle engine generally emits at a higher rate when it is cold than when it has warmed up to the designed operating temperature. For this reason, a decrease in ambient temperature will increase cold-start exhaust emissions. Other dependent parameters for cold-start emission include vehicle technology and distance traveled when the engine is cold. Cold-start emission of pollutants is concentrated mainly in urban areas, where the average trip distance is short, and car engines are turned on and off at high frequency. This leads to relatively high emissions per distance driven, compared with long-distance driving on roads outside of urban areas.
Emissions also originate from evaporative losses, which consist of diurnal loss, hot soak loss and running loss. The diurnal rise in ambient temperature increases the volatility of the fuel and expansion of vapor in the tank. Hot soak loss is the evaporation of fuel when the hot engine is turned off, arising from the transfer of heat from the engine and hot exhaust to the fuel system where fuel is no longer flowing. Running loss occurs when the vehicle is in motion. Evaporative losses depend on the ambient temperature variation, fuel volatility, and mean trip distance.
Emissions are also generated from nonexhaust sources through wear on vehicle components, such as tires, brakes and clutch, and through road abrasion. The above emissions often consist of PM with a diameter of 3-10 μm, with primary composition of metals, organic materials, rubber and silicon compounds.
Some brake pads, linings and clutches may still contain asbestos, even though there has been significant international effort to ban the use of asbestos in all industries, including automobile manufacturing, due to the potential health hazards of asbestos exposure. Some countries, such as China, Russia, India, Kazakhstan, Ukraine, Thailand, Brazil and Iran, remain large consumers of asbestos, and produce asbestos-containing automobile parts. Asbestos is currently banned in the European Union, Japan and Australia. However, it has been reported that many Japanese automakers continued to use asbestos-containing components in new automobiles from 1996 to 2005.
In the USA, the industrial use of asbestos has not been completely eliminated. In 1989, the EPA issued the Asbestos Ban and Phase Out Rule, but this was subsequently overturned in 1991. Asbestos use continues in the production of some automobile parts in the USA. In addition, some vehicles imported into the USA have asbestos-containing components.
29.4 Traffic-related air pollutants
The main pollutants emitted from traffic include: PM, elemental carbon (EC), carbon monoxide (CO), carbon dioxide (CO2), nitrogen oxides (NOx), sulfur dioxide (SO2) and polycyclic aromatic hydrocarbons (PAH). Carbon monoxide, nitrogen dioxide (NO2), benzene and black smoke are often used as indicators of traffic-related air pollution. We will discuss some of the above pollutants in detail.
Particulate matter is now recognized as one of the most important traffic air pollutants, because of its significant effects on human health. Ambient PM consists of a heterogeneous mixture of solid and liquid particles suspended in air, continually varying in size and chemical composition in space and time. Particulate matter can be characterized by source, size and chemical composition, and comes from both natural and anthropogenic sources. Natural sources include wind-borne soil, sea spray and emissions of organic compounds from vegetation. Anthropogenic sources include combustion of fuel, vehicle exhaust, mining, agriculture, industry and power generation.
Figure 29.5 shows the particle size distribution of typical roadway aerosol. Particles smaller than 10 μm (PM10) are considered ‘respirable’, because they have a greater likelihood than larger particles to gain access to the lower respiratory tract. PM10 is further categorized as: (1) coarse particles diameter (between 2.5 and 10 μm); (2) fine particles (PM2.5, or diameter less than 2.5 μm); and (3) ultrafine particles (PM0.1, with diameter less than 0.1 μm).
Figure 29.5 Typical engine exhaust particle size distribution, showing weighting by both particle mass and number. From Kittelson D. (1998) Engines and nanoparticles: a review. J. Aerosol Sci. 29: 575-588. Reproduced by permission of Elsevier
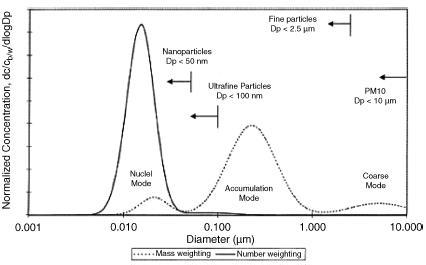
Larger (coarse and fine) particles dominate ambient particle mass concentrations, while smaller particles (ultrafine) dominate ambient particle number concentrations. Particles with diameter less than 1 mm usually have ambient particle concentrations ranging from 100 to 100,000 particles/cm3, while those larger than 1 mm may have concentration less than 10 particles/cm3. In other words, ultrafine particles have a high ambient particle number concentration, but low mass concentration.
Particulate matter from different sources has different chemical compositions. For example, tailpipe exhaust emissions of PM consist of a mixture of EC, organic compounds, sulfur and trace heavy metals. Nonexhaust PM from wearing of tires contains many carbonaceous compounds, while brake wear releases PM rich in heavy metals. In addition, PM can be formed in the atmosphere by conversion from gaseous precursors, such as NOx, SO2, ammonia (NH3) and volatile organic compounds.
29.4.2 Other traffic pollutants
In addition to PM, gases also contribute to traffic-related air pollution. CO is produced from incomplete combustion of carbon-containing fuels, which occurs in the engine operation of motor vehicles. Given the current low ambient concentrations in the USA, CO serves more as an indicator of combustion-related pollution, rather than a direct toxicant. However, in certain circumstances (such as an insufficiently ventilated parking structure or on a busy highway), CO can attain concentrations sufficient to increase the risk for cardiac ischemia in persons with atherosclerotic coronary artery disease.
Sulfur dioxide is primarily considered a point source emission, related to the burning of sulfur-containing coal in power plants and industry. However, the combustion of sulfur-containing fuels in diesel engines also produces SO2. Sulfur dioxide is a highly soluble gas. On contact with water, as in the respiratory tract lining fluid, it forms sulfurous acid, a strong irritant to eyes, mucous membranes and skin. People with asthma may experience acute reductions in lung function following even very brief exposures to SO2. In general, traffic is not considered a major contributor to ambient levels of SO2 in the USA.
The formation of NOx results mainly from combustion of fossil fuels in motor vehicles. Most toxicological and epidemiological studies have focused on NO2 rather than other NOx chemical species, because it is the most abundant, stable and toxic form of NOx in the atmosphere, it is one of the air pollutants regulated by ambient air quality standards, and it plays a major role in the generation of ozone.
Polycyclic aromatic hydrocarbons are a group of organic chemical compounds that contain two or more aromatic benzene rings fused together. Today, vehicle emissions are the primary sources of PAH in most urban areas, although wood burning may be an important source in some areas, such as Scandinavia and Eastern Europe. Some PAHs, such as benzene, are carcinogenic. The particulate fraction of PAH is usually of greater concern, since it contains the majority of the carcinogenic compounds and can be transported over long distances. A major review of mobile-source air toxics, which include PAHs, was recently published [3].
29.5 Health effects of traffic-related air pollution
Many epidemiological studies have shown an association between human exposure to ambient air pollutions and increased mortality and morbidity. However, limited epidemiological studies have focused on the effects of traffic-related air pollution on human health. There are two reasons for this: (1) federal and state air monitoring programs are typically set up to measure pollutants at regional, but not local levels; and (2) regional monitoring stations typically do not measure all types of pollutants, such as ultrafine particles (UFP), that are increased near highways. However, it is important to investigate how near-highway exposure affects the health status of people living near busy roads. Several studies have demonstrated higher rates of respiratory symptoms, elevated risk for development of asthma, lung cancer, increased cardiopulmonary mortality and reduced lung function in people living near major roads. In the following sections, we will review some of the epidemiological studies examining the relationship between traffic-related air pollution and human health, by organ system.
Pediatric pulmonary morbidity
Evidence is fairly strong that near-highway exposures present increased risk for respiratory symptoms and diseases in pediatric populations. Studies that used larger geographic frames have generally found no association between traffic-related pollution and asthma prevalence. However, recent studies that have used narrower definitions of proximity to traffic and focused on major highways have found statistically significant association between the prevalence of asthma or wheezing and residence close to busy roadways [4]. In the following sections, we will discuss some of the recent studies of highway exposure and childhood respiratory morbidity.
The risk for wheezing has been found to be elevated among children living near busy roads. In a case-control study of 6147 primary school children (aged 4-11 years) and a random cross-sectional sample of 3709 secondary school children (aged 11-16 years) in the UK, Venn et al. [5] found the following results: among children living within 150 m of a main road, the risk of wheezing per 30 m increment in road proximity increased by an odds ratio (OR) of 1.08 (95% confidence interval, CI, 1.00-1.16) in primary school children, and 1.16 (95% CI 1.02-1.32) in secondary school children.
In addition to wheezing, morning cough has been found to be a common association with traffic-related pollution among children. In a cross sectional study between 1995 and 1996 of 5421 children (aged 5-11 years) living in a 1 km2 grid in Dresden, Germany, with monitoring of air pollution from streets, Hirsch et al. [6] showed that an increase in the exposure to benzene of 1 μg/m3 air was associated with an increased prevalence of morning cough (adjusted OR, aOR, 1.15; 95% CI 1.04-1.27) and bronchitis (based on physician’s clinical diagnosis) (OR 1.11; 95% CI 1.03-1.19). Similar associations were observed between cough and exposures to NO2 and CO.
Studies have also investigated the association between traffic-related pollution and asthma. For example, English et al. [7] examined the locations of residences of 5996 children (age ≤ 14) who lived in San Diego county with the diagnosis of asthma in 1993, and compared them with a random control series of nonrespiratory diagnoses (n ¼ 2284). The investigators found that, among children with the diagnosis of asthma, there was an increase in the number of medical visits associated with higher traffic flow.
Similarly, Morgenstern et al. [8] studied the association between individual exposure to traffic-related air pollutants and allergic diseases (including asthma) in a prospective birth cohort study on 2860 children at the age of 4 and 3061 at the age of 6 in Munich, Germany in 2005. The study used individual estimated exposure levels derived from geographical information system (GIS) based modeling. The investigators found that the distance to the nearest main road and long-term exposure to particulate matter were positively associated with asthmatic bronchitis (OR 1.56; 95% CI 1.03-2.37), hay fever, eczema and allergic sensitization.
In addition, it has been found that traffic-related air pollution is linked to diminished lung development in children. In a longitudinal study of 1759 children (average age of 10 years) in southern California beginning in 1993, Gauderman et al. [9] found that over the 8-year period of follow-up, deficits in the growth of FEV1 were associated with exposure to NO2 (p = 0.005), acid vapor (p = 0.004), PM2.5 (p = 0.04) and elemental carbon (p = 0.007).
Traffic-related air pollution has also been found to cause short-term reductions in lung function. In a 2-week panel study of 19 children (aged 9-17 years) in southern California in the autumn of 1999 and spring of 2000, Delfino et al. [10] examined the relationship between temporal changes in subjects’ FEV1 and their continuous PM exposure (measured by nephelometer), as well as 24-hour average of gravimetric PM mass measured at home and central sites. The investigators found an inverse association between subjects’ FEV1 and their PM exposure.
In sum, there is epidemiological evidence that traffic-related air pollution is associated with increased risk for wheezing, morning cough, prevalence or exacerbation of asthma, and diminished lung growth in children. Nonetheless, it should be noted that many of the epidemiological studies on pediatric populations used a cross-sectional design, which may not distinguish whether the traffic exposure precedes or follows the respiratory symptoms or diseases, since exposure and morbidity are measured at the same time. Such studies should be interpreted with caution.
Adult pulmonary morbidity
The majority of epidemiological studies on the relationship between traffic-related air pollution and pulmonary diseases have been conducted with children, and the data on adults are more limited and less consistent. While some studies have found an increased prevalence of asthma in adults exposed to traffic-related pollution, other studies did not find such positive associations. However, recent studies by McCreanor et al. [11] provide strong evidence for acute adverse effects of diesel exposure in people with asthma.
A possible explanation for the inconsistency among studies on asthma prevalence is study methodology: cross-sectional studies vs case-control studies vs survey of respiratory symptoms and demographics. None of the methods used in the above studies is considered ideal for examining the causal relationship between traffic exposure and respiratory morbidity.
Over the years, there has been growing interest in the association between asthma and exposure to diesel exhaust, which is one of the major contributors to traffic-related air pollution. Since it is difficult to isolate diesel exhaust from other components of traffic air pollution, many studies have used surrogates of diesel exhaust (such as elemental carbon, black smoke, ultrafine particles or proximity to roadway) to measure exposure to diesel. In general, the epidemiological data on the association of diesel exhaust (or its surrogates) with causation or worsening of asthma has been inconsistent [12]. However, two studies are worth mentioning and are described below.
One published study suggested that diesel exhaust exposure caused asthma in three workers [13]. Three workers developed asthma following excessive exposure to diesel exhaust while riding immediately behind the lead engines of caboose-less trains. In this report, asthma was diagnosed by respiratory symptoms, pulmonary function tests and measurement of bronchial hyper-responsiveness. All three workers went on to develop persistent asthma.
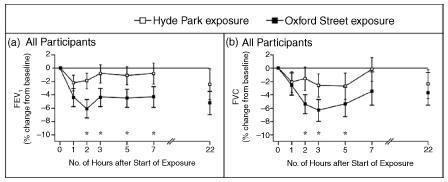
McCreanor et al. [11] probably provided the strongest evidence thus far to support the association of diesel exposure with worsening of asthma. They conducted a randomized, cross-over study in 2003-2005 to investigate the effects of short-term exposure to diesel traffic in adults with either mild or moderate asthma. In the study, each of the 60 participants walked for 2 hours on Oxford Street in the center of London (heavy diesel traffic with higher exposure to PM2.5, UFP, EC, and NO2) and in Hyde Park (away from major roadways, lower pollutant exposure). The investigators found that walking on Oxford Street significantly reduced subjects’ FEV1 (up to 6.1%; p = 0.04) and FVC (up to 5.4%; p = 0.01) in comparison with Hyde Park (Figure 29.6).
Figure 29.6 Mean percentage changes in FEV1 (A) and FVC (B) in asthmatics during and after exposure on Oxford Street and in Hyde Park. Asterisks denote p < 0.05 for the difference in values between Oxford Street and Hyde Park exposures. I bars represent 95% CI. From McCreanor et al. [11]. Reproduced by permission of Massachusetts Medical Society. Copyright 2007 Massachusetts Medical Society. All rights reserved
Stay updated, free articles. Join our Telegram channel

Full access? Get Clinical Tree


