Some other parenchymal conditions that cause restriction are listed in Table 12-2. However, not all of them always produce the classic picture described here. The slope of the flow-volume curve may not be increased and the lung recoil may not be altered, in part because restriction may be combined with obstruction. Examples are endobronchial involvement in sarcoidosis and tuberculosis. This mixed pattern is also frequent in heart failure, cystic fibrosis, and Langerhans’ cell histiocytosis (eosinophilic granuloma or histiocytosis X) and is striking in lymphangioleiomyomatosis.
12F. EXTRAPULMONARY RESTRICTION
In the case of extrapulmonary restriction, the lung parenchyma is assumed to be normal. The most frequent causes of this type of restriction are listed in Table 12-2. The main abnormalities are the decreased lung volumes with generally normal gas exchange. Because the DLCO is somewhat volume-dependent, it may be reduced. Resection in an otherwise normal lung also fits this pattern.
Severe degrees of restriction, as in advanced kyphoscoliosis, can lead to respiratory insufficiency with abnormal gas exchange.
12G. NEUROMUSCULAR DISEASE
The hallmark of early neuromuscular disease is a decrease in respiratory muscle strength reflected in decreases in maximal expiratory and inspiratory pressures. At this stage, all other test results can be normal despite the patient complaining of exertional dyspnea. As the process progresses, the maximal voluntary ventilation is next to decrease, followed by decreases in the FVC and TLC with accompanying impairment of gas exchange. Ultimately, the picture fits that of a restrictive extrapulmonary disorder.
These patterns are most frequent in amyotrophic lateral sclerosis, myasthenia gravis, and polymyositis. They have also been noted in syringomyelia, muscular dystrophy, parkinsonism, various myopathies, and Guillain-Barré syndrome.
12H. CONGESTIVE HEART FAILURE
The effects of left-sided congestive heart failure with pulmonary congestion on the function of an otherwise normal lung are often not appreciated. In some cases, the predominant change is one of pure restriction with a normal FEV1/FVC ratio, flows decreased in proportion to the FVC, and a normal flow-volume curve slope. There is often associated cardiomegaly, which contributes to the restriction. The chest radiograph maybe interpreted as suggesting interstitial fibrosis, but the computed tomographic appearance is distinctly different.
In other cases, there may be a mixed restrictive-obstructive pattern with decreases in flow out of proportion to volume reduction. The FEV1/FVC ratio is reduced, as is the slope of the flow-volume curve. The obstructive component is in part due to peribronchial edema, which narrows the airways and produces “cardiac asthma.” Of interest, the result of the methacholine challenge test may be positive for reasons that are unclear.
In years past, the effectiveness of therapy for pulmonary congestion was sometimes monitored by measuring changes in the vital capacity. Congestive heart failure is highlighted here because it is often overlooked as a possible cause of a restrictive or obstructive pattern.
12I. OBESITY
The changes in pulmonary function tests associated with obesity are indicated in Table 12-1. These changes do not seem to differ substantially between male and female patients. Some test results, such as the TLC, are abnormal only at very high body mass indexes. Others, such as decreases in functional residual capacity and expiratory reserve volume (not included in Table 12-1), occur with milder degrees of obesity. The results for RV and RV/TLC ratio may depend in part on whether the RV was calculated using the FVC or slow vital capacity (see section 3C, page 31). Even in the massively obese patient, the FEV1 /FVC ratio can be normal. The adverse effects of obesity are greater in patients with a truncal fat distribution (“apple” versus “pear”) and may be greater in the elderly and in smokers, variables that are not always reported. In this respect, one study [1] found that male patients who had obstructive lung disease and gained weight after quitting smoking had a loss of 17.4 mL in FVC for every kilogram of weight gained. Their FEV1 also decreased by 11.1 mL per kilogram of weight gained. Similar but smaller changes of 10.6 mL FVC and 5.6 mL FEV1 were found in women.
A very interesting development has been the apparent association between obesity and asthma. Does obesity increase the risk of asthma? The final answer is not in. A recent review [2] concluded that obesity has an important but modest impact on the incidence and prevalence of asthma.
REFERENCES
- Wise RA, Enright PL, Connett JE, et al. Effect of weight gain on pulmonary function after smoking cessation in the Lung Health Study. Am J Respir Crit Care Med 157:866–872, 1998.
- Beuther DA, Weiss ST, Sutherland ER. Obesity and asthma. Am J Respir Crit Care Med 174:112–119, 2006
13

When to Test and What to Order
The recommendations for preoperative testing are listed in Chapter 10. Although there are many other situations in which pulmonary function testing is indicated, for reasons that are unclear these tests are underutilized. This chapter describes instances in which testing is warranted and includes the basic tests to be ordered. Depending on the initial test results, additional studies may be indicated.
13A. THE SMOKER
Even if smokers have minimal respiratory symptoms, they should be tested by age 40. Depending on the results and a patient’s smoking habits, repeat testing every 3 to 5 years is reasonable. The logic for early testing is shown in Figure 13-1. This shows the typical pattern of development of chronic obstructive pulmonary disease (COPD). Spirometry is the first test to have abnormal results. The innocuous cigarette cough may indicate significant airway obstruction. When confronted with an abnormal test result, a patient can often be convinced to make a serious attempt to stop smoking, which is a most important step to improving health. Figure 13-2 shows the average rates of decline in function in smokers with COPD and nonsmokers. The earlier the rapid loss of function can be interrupted in the smoker, the greater will be the life expectancy.
Test: Spirometry before and after bronchodilator
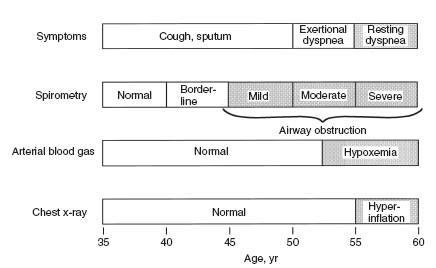
FIG. 13-1. Progression of symptoms in chronic obstructive pulmonary disease (COPD) reflected by spirometry, arterial blood gas studies, and chest radiographs as a function of age in a typical case. Spirometry can detect COPD years before significant dyspnea occurs. (From PL Enright, RE Hyatt [eds]. Office Spirometry: A Practical Guide to the Selection and Use of Spirometers. Philadelphia: Lea & Febiger, 1987. Used with permission of Mayo Foundation for Medical Education and Research.)
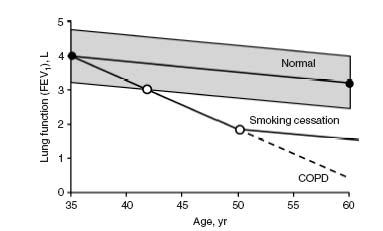
FIG. 13-2. Normal decline in forced expiratory volume in 1 second (FEV1) with age contrasted with the accelerated decline in continuing smoking in chronic obstructive pulmonary disease (COPD). Smoking cessation can halt this rapid decline. (From PL Enright, RE Hyatt [eds]. Office Spirometry: A Practical Guide to the Selection and Use of Spirometers. Philadelphia: Lea & Febiger, 1987. Used with permission of Mayo Foundation for Medical Education and Research.)
13B. CHRONIC OBSTRUCTIVE PULMONARY DISEASE
Even if the clinical diagnosis of COPD is clear-cut, it is important to quantify the degree of impairment of pulmonary function. A forced expiratory volume in 1 second (FEV1) of 50% of predicted portends future disabling disease. An FEV1 of less than 800 mL predicts future carbon dioxide retention (respiratory insufficiency).
Repeating spirometry every 1 to 2 years establishes the rate of decline of values such as the FEV1. The FEV1 declines an average of 60 mL/yr in persons with COPD who continue to smoke, compared with 25 to 30 mL/yr in normal subjects and persons who quit smoking.
Tests:
- Initially, spirometry before and after bronchodilator and determination of the diffusing capacity of carbon monoxide (DLCO). Arterial blood gas studies are recommended when the FEV1 is less than 50% predicted.
- Initially, if available, static lung volumes such as total lung capacity (TLC) and residual volume (RV).
- Follow-up testing with spirometry is usually adequate.
13C. ASTHMA
It is important to be sure that the patient with apparent asthma really has this disease. Remember that “not all that wheezes is asthma.” Major airway lesions can cause stridor or wheezing, which has been mistaken for asthma. The flow-volume loop often identifies such lesions (see section 2K, page 18).
Testing is also important in patients with asthma in remission or with minimal symptoms. This provides a baseline against which to compare results of function tests during an attack and thus quantify the severity of the episode.
The patient should be taught to use a peak flowmeter. He or she should establish a baseline of peak expiratory flows when asthma is in remission by measuring flows each morning and evening before taking any treatment. Then the patient should continue to measure and record peak flows on a daily basis.
PEARL: It is crucial that the patients be taught to use a peak flowmeter correctly. They must take a maximal inhalation, place their lips around the mouthpiece (a nose clip is not needed), and give a short, hard blast. They should avoid making a full exhalation; the exhalation should mimic the quick exhalation used to blow out candles on a birthday cake.
Having the patient with asthma monitor his or her pulmonary status is extremely important. An exacerbation is usually preceded by a gradual decline in peak flow, which the patient may not perceive. By the time the patient becomes symptomatic and dyspneic, flows may have greatly deteriorated. A decrease of about 20% from the symptom-free, baseline peak flow usually means treatments should be reinstated or increased and the physician contacted. It should be impressed on the patient and family that asthma is a serious, potentially fatal disease and that it must be respected and appropriately monitored and treated. Marked airway hyperresponsiveness and highly variable function are harbingers of severe attacks.
Tests:
- Initial evaluation includes spirometry before and after bronchodilator—determination of DLCO is optional. If pulmonary function is normal or nearly so and there is any question about the diagnosis, a methacholine challenge study should be done (see Chapter 5). The eventual role of expired nitric oxide (eNO) is still to be determined (see section 5G, page 60).
- For monitoring on a daily basis, a peak flowmeter is used.
- Periodic (annual) monitoring with spirometry and bronchodilator (more often in severe cases).
13D. ALLERGIC RHINITIS
Allergic rhinitis is often associated with asymptomatic hyperreactive airways. It may evolve into asthma. Thus, establishing a subject’s baseline function and airway reactivity is justified.
Tests: Spirometry before and after bronchodilator. If the bronchodilator response is normal but concerns still exist, a methacholine challenge study (see Chapter 5) is indicated.
13E. CHEST RADIOGRAPH WITH DIFFUSE INTERSTITIAL OR ALVEOLAR PATTERN
Several disorders can present with these patterns (see Table 12-2, page 115). Pulmonary function tests are performed to answer the following questions: Are the lung volumes decreased and, if so, by how much? Is the diffusing capacity reduced? Is there arterial oxygen desaturation at rest or with exercise? Not infrequently, oxygen saturation is normal at rest but decreases during exercise. The tests are also used to follow the course of the disease and the response to therapy.
Tests:
- Spirometry before and after bronchodilator, determination of DLCO, and pulse oximetry at rest and during exercise. The bronchodilator is used because a subject with inherent hyperreactive airways might develop one of these disorders.
- Static lung volumes (such as TLC and RV).
- Lung compliance and recoil pressure at TLC.
PEARL: Rarely, an interstitial or alveolar pattern is associated with an increased DLCO. This can occur with intra-alveolar hemorrhage, such as in idiopathic hemosiderosis (Goodpasture’s syndrome), in which hemoglobin in the alveoli binds to carbon monoxide. The DLCO will decrease as the process improves.
13F. EXERTIONAL DYSPNEA
In almost every case of exertional dyspnea, pulmonary function tests should be performed. This approach applies even if the major abnormality appears to be nonpulmonary. We have seen patients with dyspnea who have received elaborate, and expensive, cardiovascular studies before pulmonary function studies were done, and the lungs proved to be the cause of the dyspnea. Also, exercise-induced bronchospasm, often associated with inhalation of cold air, can be a cause of exertional dyspnea.
Tests: Spirometry before and after dilators and DLCO testing. Determination of oxygen saturation at rest and exercise may be appropriate. For evaluation of exercise-induced bronchospasm, a methacholine challenge test should be done. In difficult cases, cardiopulmonary exercise testing may be helpful (see section 11F, page 109).
13G. CHEST TIGHTNESS
Is the tightness caused by angina or episodic bronchospasm? The distinction is not always easy. Dyspnea is often associated with either disorder. If there is doubt, lung function testing, in addition to cardiac evaluation, is warranted.
Tests: Spirometry before and after bronchodilator. Methacholine challenge testing is done if bronchospasm remains a distinct possibility.
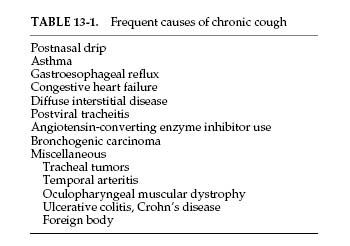
13H. UNEXPLAINED CHRONIC COUGH
Some patients have cough that is not related to chronic bronchitis, bronchiectasis, or a current viral infection. The cough is usually nonproductive. The most frequent causes are listed in Table 13-1. Obviously, many causes are nonpulmonary. Those in which pulmonary function testing can be helpful are asthma, congestive heart failure, diffuse interstitial disease, and tracheal tumors.
Tests: Spirometry before and after bronchodilator, DLCO test, methacholine challenge. A flow-volume loop also should be considered.
PEARL: In patients whose cough follows a viral tracheitis, systemic or inhaled steroids may provide relief, presumably by decreasing smoldering inflammation that is stimulating cough receptors.
13I. CORONARY ARTERY DISEASE
Because most patients with coronary artery disease have been smokers, they have an increased risk of also having COPD. A strong case can be made for testing all such patients to assess their lung function. And, as noted in section 12H (page 116), congestive heart failure itself can impair lung function.
Test: Spirometry before and after bronchodilator.
PEARL: In addition to patients with coronary artery disease, those with hypertension may need to be tested, especially if therapy with β-adrenergic blockers is planned. Nonselective β-adrenergic antagonists are usually contraindicated in COPD, but selective β1 antagonists are generally well tolerated by patients with COPD and most patients with asthma.
13J. RECURRENT BRONCHITIS OR PNEUMONIA
Not infrequently, asthma is mistaken for recurrent attacks of bronchitis or pneumonia. This mistake can be avoided by appropriate pulmonary function testing.
A subset of patients have recurrent bouts of pneumonia presenting as small pulmonary infiltrates. We have seen several such patients in whom the basic problem was occult asthma. Presumably the bronchoconstriction interfered with mucociliary clearance, thus predisposing to pneumonia. Regular use of inhaled steroids and β-agonists led to correction of the problem.
Tests: Spirometry before and after bronchodilator. Methacholine challenge testing is performed if undetected bronchospasm remains a possibility.
There are two reasons for performing pulmonary function tests, including maximal respiratory pressure tests, in patients with neuromuscular disease. First, dyspnea frequently develops in such patients, and it is important to establish the pathogenesis of the complaint. It might be pulmonary or cardiac in origin. Pulmonary function tests help to answer the question. Second, the tests can be useful for following the course of the disease.
Tests: Spirometry before and after bronchodilator, DLCO test, and determination of maximal respiratory pressures.
13L. OCCUPATIONAL AND ENVIRONMENTAL EXPOSURES
Table 13-2 lists substances and occupations that can produce pulmonary abnormalities reflected in abnormal results of pulmonary tests. Some farsighted industries are monitoring workers’ pulmonary function on a regular basis. This testing protects both the worker and the employer.

Tests: Spirometry before and after bronchodilator.
13M. SYSTEMIC DISEASES
Several nonpulmonary conditions are frequently associated with altered pulmonary function. Some of the more common ones are listed below, followed by the commonly abnormal pulmonary function test result(s).
- Rheumatoid arthritis: DLCO reduction is often the first change. Vital capacity may also be reduced, and airflow obstruction occurs in a few cases.
- Scleroderma (systemic sclerosis): Reduced DLCO is the first change, caused by minimal fibrosis often not visible by radiography. Later, lung volumes can decrease.
- Systemic lupus erythematosus: Early decrease in DLCO. Later, volumes may decrease dramatically, producing a “vanishing lung,” which maybe more related to respiratory muscle weakness than to pulmonary fibrosis.
- Wegener’s granulomatosis: Both restrictive and obstructive patterns may be found, as well as major airway lesions.
- Dermatomyositis: Muscle weakness and interstitial disease with low DLCO (most often nonspecific interstitial pneumonia) often occur.
- Cirrhosis of the liver: In some cases, arterial oxygen desaturation is found. This is due to the development of arteriovenous shunts in the lungs or mediastinum. In many cases, the saturation is lower when the subject is standing (rather than lying), so-called orthodeoxia.
- Relapsing polychondritis: Inflammatory degeneration of tracheal and bronchial cartilage can lead to a considerable reduction in expiratory flows, an obstructive pattern.
- Sjögren’s syndrome: As many as half of affected patients have airway obstruction resistant to bronchodilators.
14

Approaches to Interpreting Pulmonary Function Tests
Different experts follow different approaches to interpretation of pulmonary function tests. There is no universally accepted standard for interpretation, but the two most commonly cited standards have been the 1986 American Thoracic Society Disability Standard [1] and the 1991 statement of the American Thoracic Society [2]. In 2005, the American Thoracic Society and the European Respiratory Society updated the pulmonary function interpretation strategies [3].
This chapter describes three approaches. The first uses the flow-volume curve and the normal predicted values. The second uses the test data without the flow-volume curve. The third uses a pulmonary function test “crib sheet” developed in the Mayo Clinic Division of Pulmonary and Critical Care Medicine as an instructional tool for residents and fellows.
14A. FLOW-VOLUME CURVE AVAILABLE
Step I
Examine the flow-volume curve and compare it with the normal predicted curve (see the Appendix for how to construct the normal curve). Is there any ventilatory limitation (that is, any loss of area)? If not, the test result is most likely normal.
1. Is the forced vital capacity (FVC) normal? If so, any significant restriction is essentially ruled out.
2. Is the FVC reduced? If so, either obstruction or restriction could be the cause (see Fig. 2-3, page 10).
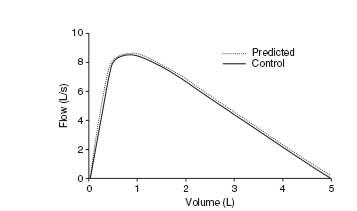
FIG. 14-1. Normal flow-volume curve.
3. Examine the contour of the flow-volume curve.
a. Is it normal-appearing (Fig. 14-1)? If so, and if the FVC is normal, the test result is almost always normal. Proceed to steps V, VI, and VII. If the FVC is reduced and the flow-volume slope and ratio of forced expiratory volume in 1 second to FVC (FEV1 /FVC ratio) are normal, restriction, occult asthma, or a nonspecific abnormality may be present (see section 2F, page 12, and section 3E, page 36). The total lung capacity (TLC) will have to be measured to make the differentiation.
b. Is the curve scooped out with reduced flow-volume slope and low flows (Fig. 14-2)? An obstructive defect is most likely. Remember the occasional mixed restrictive-obstructive disorder.
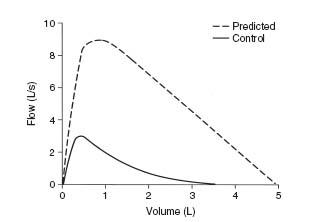
FIG. 14-2. Flow-volume curve in severe chronic obstructive pulmonary disease.
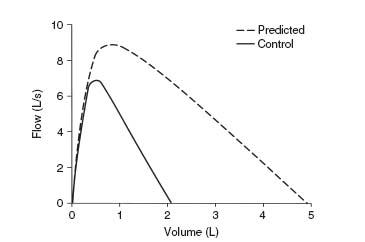
FIG. 14-3. Flow-volume curve in pulmonary fibrosis. Note steep slope and decreased volume.
4. Is the slope of the flow-volume curve increased (Fig. 14-3)? This finding is consistent with a pulmonary parenchymal restrictive process. The FVC, TLC, and diffusing capacity of carbon monoxide (DLCO) must be reduced to be certain. (Grading the degree of restriction is described in section 14C, page 139.)
5. If there is a flow-volume loop, is there any suggestion of a major airway lesion (Fig. 14-4)?
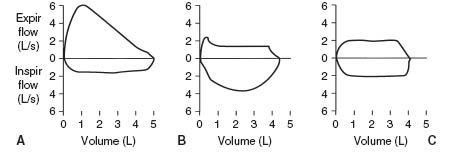
FIG. 14-4. Typical flow-volume curves associated with lesions of the major airway (carina to mouth). A. Typical variable extrathoracic lesion. B. Variable intrathoracic lesion. C. Fixed lesion. Expir, expiratory; Inspir, inspiratory.
Step II
Examine the FEV1 value.
- Is it normal? If so, all but borderline obstruction or restriction is ruled out. There are exceptions, namely, the rare variable extrathoracic lesion in which the FEV1 can be normal but the maximal voluntary ventilation (MVV) is reduced because of inspiratory obstruction (as in Fig. 14-4A). Also, subjects with respiratory muscle weakness (see section 9D, page 97) can initially present with dyspnea and a normal FEV1.
- Is the FEV1 reduced below the lower limit of normal? (The equation used to determine the lower limit of normal is in the Appendix.) If FEV1 is reduced, the decrease is most often due to airway obstruction. It could be caused by a restrictive process, however, and thus, the FEV1/FVC ratio needs to be evaluated. Nevertheless, if the TLC value is available, check it first. An increase in TLC by more than 15 to 20% favors obstructive disease. A normal or increased TLC value excludes a pulmonary restrictive process by definition. A normal TLC can occur in the rare mixed obstructive-restrictive disorder. A reduced TLC is expected with a restrictive process.
Step III
Examine the FEV1/FVC ratio.
- If the absolute ratio is decreased to below the lower limit of normal, an obstructive process is present. (Grading the degree of obstruction is described in section 14C.)
- If the ratio is normal, an obstructive process is usually excluded. An exception is the case of nonspecific ventilatory limitation, in which the FVC and FEV1 are reduced and the FEV1/FVC ratio, flow-volume slope, and TLC are all normal (see section 3E, page 36). Administration of a bronchodilator often exposes occult asthma (Fig. 14-5), but occasionally a methacholine challenge test is needed. Airway resistance, if available, is often increased and can be helpful in identifying the patient with occult asthma.
- The ratio is normal or increased with a pure restrictive disorder. Patients with a reduced FVC, reduced FEV1, normal to increased FEV1/FVC ratio, and normal response to bronchodilator may have a restrictive process. If there is doubt, have the TLC or DLCO measured; they should be abnormally low. If the TLC test is not available, check the chest radiograph for evidence of reduction in TLC, or estimate TLC by the radiographic technique discussed in section 3C (page 31). The alveolar volume (VA) can also be checked, as discussed in the Pearl in section 4B, page 43.
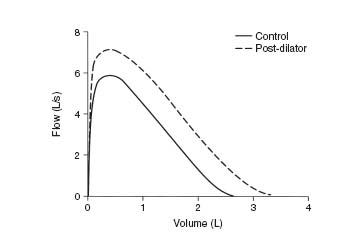
FIG. 14-5. Control curve shows mild reduction in forced vital capacity (FVC) and forced expiratory volume in 1 second (FEV1) and a normal FEV1/FVC ratio. After administration of a bronchodilator, the flow-volume curve (dashed line) shows a parallel shift to the right with an increase in FVC and FEV1 but no change in the FEV1/FVC ratio. The patient has occult asthma.
Step IV
Examine the expiratory flow values.
- The forced expiratory flow rate over the middle 50% of the FVC (FEF25–75) almost always changes in the same direction as the FEV1. This test may be more sensitive for detecting early airway obstruction. The FEF25–75 is occasionally reduced in the face of a normal FVC, FEV1, and MVV. The flow-volume curve has a characteristic appearance. This result tends to occur in elderly persons with minimal symptoms (Fig. 14-6). Also see section 7A (page 75).
- FEF25,50,75. These flows change directionally in concert with the FEV1 and FEF25–75.
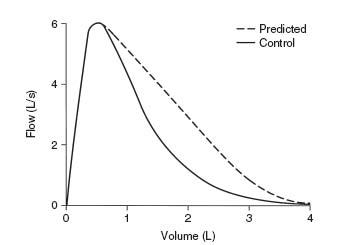
FIG. 14-6. The unusual flow-volume curve in which the forced expiratory volume in 1 second is normal but the forced expiratory flow rate over the middle 50% of the forced vital capacity is reduced. Note that the peak flow is normal but the lower 70% is very scooped out.
Step V
Examine the MVV.
- The MVV will change in most cases in a manner similar to that of the FEV1. With a normal FEV1, a normal MVV should be expected (FEV1 × 40 = predicted MVV). Consider the lower limit to be FEV1 × 30.
- If the FEV1 is reduced by obstructive disease, the MVV will also be reduced. However, the rule that FEV1 × 40 = MVV is not always true in obstructive disease.
- If the FEV1 is reduced by a restrictive process, the MVV usually is reduced, but not always as much as suggested by the FEV1 (some subjects with a very steep flow-volume curve can have normal flows high in the vital capacity; see Fig. 2-4D, page 12).
- If the FEV1 is normal but the MVV is reduced below the lower limit, consider the following possibilities:
- Poor patient performance due to weakness, lack of coordination, fatigue, coughing induced by the maneuver, or unwillingness to give maximal effort (best judged by the technician).
- Does the patient have a neuromuscular disorder? The MVV is usually the first routine test to have an abnormal result. Consider ordering maximal respiratory pressure tests (see Chapter 9).
- Does the subject have a major airway lesion? The MVV is reduced in all three types of lesions shown in Figure 14-4; to evaluate this, the flow-volume loop needs to be evaluated.
- Is the subject massively obese? The MVV tends to decrease before the FEV1 does.
- Poor patient performance due to weakness, lack of coordination, fatigue, coughing induced by the maneuver, or unwillingness to give maximal effort (best judged by the technician).
Step VI
Examine the response to bronchodilator.
- Is the response normal (12% increase in both FEV1 and FVC)?
- Is the response increased (FEV1 or FVC increased by 12% and 200 mL)? If so, this finding is consistent with hyperreactive airways. A case of occult asthma may be exposed by such a response. (Remember the possible effect of effort on the FEV1, section 5D, page 53, and Fig. 5-4, page 55.) However, the patient with asthma may not always have an increased response. The response can vary with the state of the disease.
Step VII
Examine the DLCO.
- Is the DLCO normal? This result is consistent with normal lungs. However, the DLCO may also be normal in chronic bronchitis, asthma, major airway lesions, extrapulmonary restriction, neuromuscular disease, and obesity.
- Is the DLCO reduced? This finding is characteristic of pulmonary parenchymal restrictive disorders. It is also consistent with anatomic emphysema and pulmonary vascular disorders. However, values can also be reduced in chronic bronchitis, asthma, and heart failure.
An isolated reduction in the DLCO (other tests within normal limits) should raise the possibility of pulmonary vascular disorders, such as scleroderma, primary pulmonary hypertension, recurrent emboli, and various vasculitides. Chemotherapeutic agents can also produce this finding.
- Is the DLCO increased? This result occurs in some patients with asthma and in some very obese subjects. Alveolar hemorrhage may also increase the DLCO, as can polycythemia vera, left-to-right intracardiac shunt, or any process that produces pulmonary vascular engorgement.
Step VIII
Examine other test results that you may have available. They should confirm the interpretation at which you have already arrived and fit the patterns in Table 12-1, pages 112–113.
14B. FLOW-VOLUME CURVE NOT AVAILABLE
A spirogram (volume versus time curve) may be available; (see Fig. 2-5, page 15.)
Step I
Examine the FVC.
- Is it normal? If so, any significant restriction is ruled out.
- Is it reduced? If so, this finding could be due to either obstruction or restriction (see Fig. 2-3, page 10). If restriction is present, it can be graded (see section 14C, page 139).
Step II
Examine the FEV1.
- Is it normal? If so, any significant obstruction or restriction is ruled out. There are exceptions, namely, the rare variable extrathoracic lesion in which the FEV1 can be normal but the MVV is reduced because of the inspiratory obstruction. Also, subjects with respiratory muscle weakness can initially present with dyspnea and a normal FEV1.
- Is it reduced below the lower limit of normal? (The equation used to determine the lower limit of normal is in the Appendix.) If so, this finding is most often due to airway obstruction. However, it could be caused by a restrictive process, and thus the FEV1/FVC ratio needs to be evaluated. First, though, if the TLC is available, it should be checked. A TLC that is increased more than 15 to 20% favors obstruction. By definition, a normal or increased TLC rules out pure parenchymal restriction. The TLC is occasionally normal in a mixed obstructive-restrictive disorder. A reduced TLC is expected in a pure restrictive process.
Step III
Examine the FEV1/FVC.
- If the absolute ratio is decreased to below the lower limit of normal, an obstructive process is present. (Grading the degree of obstruction is described in section 14C, page 139.)
- If the ratio is normal, this finding excludes the usual obstructive process. An exception is nonspecific ventilatory limitation, in which the FVC and FEV1 are reduced and the FEV1/FVC ratio and TLC are normal (see section 3E, page 36). Administration of a bronchodilator usually exposes occult asthma, but occasionally a methacholine challenge test is needed.
- Otherwise, the ratio is normal or increased in a pure restrictive process. A reduced FVC, reduced FEV1, normal to increased FEV1/FVC ratio, and normal response to bronchodilator may indicate a restrictive defect. If there is any doubt, the TLC or DLCO should be measured; they should be low. If the TLC is not available, the chest radiograph can be checked for evidence of reduction in the TLC, or the TLC can be estimated by the radiographic technique described in section 3C, page 31. The VA can also be checked, as discussed in the Pearl in section 4B, page 43.
Step IV
Examine the expiratory flow values.
- The FEF25–75 almost invariably changes in the same direction as the FEV1. This test may be more sensitive than the FEV1 for detecting early airway disease.
- Rarely, the FEF25–75 is reduced in the face of a normal FVC, FEV1, and MVV. This situation tends to occur in elderly persons who have few symptoms (see section 7A, page 75).
Step V
Examine the MVV.
- The MVV will, in most cases, change in a manner similar to that of the FEV1. With a normal FEV1, a normal MVV should be expected (that is, FEV1 × 40 = predicted MVV). Consider the lower limit to be FEV1 × 30.
- If the FEV1 is reduced by obstructive disease, the MVV will also be reduced. However, the rule that FEV1 × 40 = MVV is not always true in obstructive disease.
- If the FEV1 is reduced by a restrictive process, the MVV usually is reduced. However, the MVV is not always reduced as much as suggested by the reduction in FEV1 because some subjects with a restrictive process have normal flows high in the vital capacity.
- If the FEV1 is normal but the MVV is reduced, consider the following possibilities:
- The patient’s performance was poor because of weakness, lack of coordination, fatigue, coughing induced by the maneuver, or unwillingness to give a maximal effort (best judged by the technician).
- Does the patient have a neuromuscular disorder? The MVV test is usually the first routine test to have an abnormal result. Determination of maximal respiratory pressures should be considered (see Chapter 9).
- Does the patient have a major airway lesion? The MVV is reduced in all three types of lesions (see Fig. 2-7, page 19).
- Is the subject massively obese? The MVV tends to decrease before the FEV1 does.
- The patient’s performance was poor because of weakness, lack of coordination, fatigue, coughing induced by the maneuver, or unwillingness to give a maximal effort (best judged by the technician).
Step VI
Examine the response to bronchodilator.
- Is the response normal (12% increase in both FEV1 and FVC)?
- Is the response increased (FEV1 or FVC increased by 12% and 200 mL)? If so, this finding is consistent with hyperreactive airways. A case of occult asthma may be exposed by such a response. (The possible effect of effort on the FEV1 needs to be considered; see section 5D, page 53.) However, the patient with asthma may not always have an increased response. It can vary with the state of the disease.
Examine the DLCO.
- Is the DLCO normal? This finding is consistent with normal lungs. However, the DLCO may also be normal in chronic bronchitis, asthma, major airway lesions, extrapulmonary restriction, neuromuscular disease, and obesity.
- Is the DLCO reduced? This finding is characteristic of pulmonary restrictive disorders. It is also consistent with anatomic emphysema and pulmonary vascular disease. However, values can also be reduced in chronic bronchitis, asthma, chronic obstructive pulmonary disease, and heart failure.
An isolated reduction in the DLCO (other test results are within normal limits) should raise the possibility of pulmonary vascular disorders such as scleroderma, primary pulmonary hypertension, recurrent emboli, and various vasculitides.
- Is the DLCO increased? This finding occurs in some patients with asthma and in some very obese subjects. Alveolar hemorrhage may also increase the DLCO, as can polycythemia vera, left-to-right intracardiac shunt, or any process that produces pulmonary vascular engorgement.
Step VIII
Examine other test results that may be available. They should confirm the interpretation already arrived at and fit the patterns given in Table 12-1, pages 112–113.
14C. PULMONARY FUNCTION TEST CRIB SHEET
This summary was developed for use by internal medicine residents and pulmonary fellows at Mayo Clinic.
Spirometry Interpretation
Look at the flow-volume curve, the FVC, and the FEV1/FVC ratio:
- Does the curve suggest obstruction (scooped out), restriction (shaped like a witch’s hat), or a special case (see below)?
- Is the FEV1/FVC ratio reduced (below the lower limit of normal), indicating obstruction?
If the FEV1/FVC ratio is below the lower limit of normal (LLN) → obstruction algorithm
FEV1 ≥ LLN Borderline
59-40% Moderate
39-30% Severe
30% Very severe
REMEMBER: Obstruction, 60/40/30
If the FEV1/FVC ratio is normal and the TLC is below the lower limit of normal → restriction algorithm
FVC
59-50% Moderate
49-35% Severe
35% Very severe
REMEMBER: Restriction, 60/50/35
(Caution: In some cases the FEV1/FVC ratio is normal but obstruction is present. See “Nonspecific Pattern,” below. A bronchodilator response, increased airway resistance, or a positive methacholine challenge test can be helpful in some of these cases.)
Bronchodilator response is positive if either the FEV1 or FVC increases ≥12% and ≥200 mL.
A large bronchodilator response is predictive of:
More rapid decrease in lung function
More severe exacerbations
Increased risk for rapid decline and death
Flow-Volume Curve
- Gives clues about the presence of obstruction or restriction (see Fig. 2-5, 2-7B and C).
- Is the best indicator of test quality (see Fig. 2-6):
The curve should be examined for maneuver errors, including the following (letters correspond to the parts of Fig. 2-6): B) slow start, C&D) poor blast, E) early termination, F&G) cough or interruption in the first second.
- Gives clues about unusual conditions, such as the following:
- Plateau on curve may indicate a central airway obstructive process (see Fig. 2-7F, page 19)
- Normal variant curve (tracheal plateau) common in young adults, especially women (see Fig. 2-6H, page 16)
- Inspiratory obstruction with variable extrathoracic obstruction (see Fig. 2-7D, page 19) (for example, goiter, tracheal tumor, subglottic stenosis, rheumatoid arthritis with cricoarytenoid fusion)
- Expiratory obstruction with variable intrathoracic (tracheal) obstruction (see Fig. 2-7E, page 19)
- A convex flow-volume curve (see Fig. 2-6D, page 16) may be found in the following:
- Plateau on curve may indicate a central airway obstructive process (see Fig. 2-7F, page 19)
Children
Neuromuscular weakness (see below)
Poor performance
Methacholine Challenge
This is positive if there is a 20% decrease in FEV1 after 25 mg/mL (concentration threshold varies among laboratories). Elements needed for asthma diagnosis: (1) evidence of airway hyper-responsiveness, (2) obstruction varying over time, (3) evidence of airway inflammation.
Lung Volumes
Gas-dilution techniques (He dilution or N2 washout) underestimate lung volumes in obstructive disorders compared with plethysmography:
Obstructive disorders have a TLC that is high (hyperinflation) or normal
An increased residual volume (RV) (air trapping) and an increased RV/TLC ratio
Restrictive disorders have a reduced TLC
RV may be high (muscular restriction, chest wall limitation, superimposed obstruction)
Neuromuscular Restriction
This looks like pulmonary restriction in spirometry, but:
Lung volumes usually show decreased TLC but increased RV
FVC is disproportionately reduced relative to TLC (quantify severity based on FVC, not TLC)
RV/TLC is increased (obstruction is not the only cause of high RV/TLC)
Maximal respiratory pressures are reduced
Flow-volume curve looks like poor performance or a child’s curve (see Fig. 2-6D, page 16)
Early in the course of disorders causing muscular weakness (for example, amyotrophic lateral sclerosis), maximal respiratory pressures may be reduced, but lung volume, FVC, FEV1, and MVV are still normal (see Table 12-1, page 112–113 and section 9D, page 97).
Nonspecific Pattern
A nonspecific pattern is sometimes termed a “spirometric restriction.” These patients have a low FEV1 and FVC, normal FEV1/FVC ratio, and normal TLC. If possible, airway resistance should be measured. If it is increased, we consider it an obstructive disorder and grade severity based on FEV1. Otherwise, we call it a nonspecific pattern (see section 2F, pages 12–14 and page 38). The most common associated clinical conditions are asthma and obesity. Airway hyperreactivity can be documented in more than half the cases.
DLCO
This is reduced in patients with a gas exchange abnormality (for example, emphysema, idiopathic pulmonary fibrosis, other parenchymal or vascular processes).
A low DLCO is characteristic of emphysema (not as sensitive or specific as high-resolution computed tomography), whereas in asthma and some cases of obstructive chronic bronchitis DLCO is normal.
DLCO may be reduced in pulmonary hypertension, but it is insensitive for detecting cases.
DLCO is often used to monitor for an adverse pulmonary effect of chemotherapy.
DLCO should be adjusted for low hemoglobin for anemic patients.
DLCO maybe increased in (1) asthma, (2) obesity, (3) left-to-right shunt, (4) polycythemia, (5) hyperdynamic states, postexercise, (6) pulmonary hemorrhage, and (7) supine position.
Maximal Respiratory Pressures (“Bugles”)
These are used to assess respiratory muscle strength. If low, they indicate muscle weakness or poor performance. Inspiratory pressure is mostly a function of diaphragmatic strength. Tetraplegics show reduced expiratory pressures with inspiratory pressures (diaphragm) relatively preserved. Diaphragmatic paralysis is the opposite.
Obesity
Obesity has a small but sometimes considerable effect on pulmonary function. The increased chest wall impedance causes a restrictive pattern in some obese patients. On average, a person with a body mass index of 35 will have a 5 to 10% reduction in FVC. TLC is usually not reduced to the same degree as FVC. Obese people may wheeze when they breathe near residual volume, sometimes called pseudo-asthma. DLCO is normal or increased. Additional effects of obesity on pulmonary function are discussed in section 12I (page 117) and Table 12-1 (page 112–113).
14D. NEW STANDARD FOR PULMONARY FUNCTION TESTING AND INTERPRETATION
Stay updated, free articles. Join our Telegram channel

Full access? Get Clinical Tree


