Fig. 12.1
Saturation recovery (90-Tsat-ACQ)
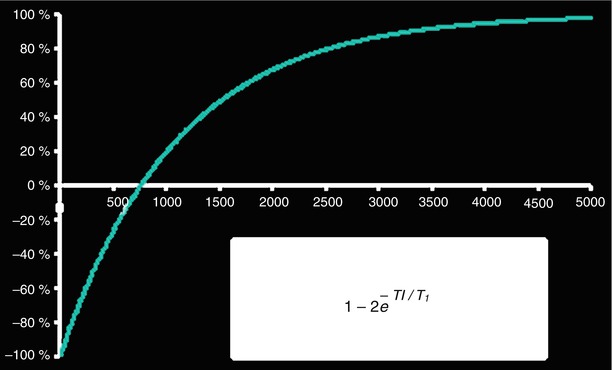
Fig. 12.2
Inversion recovery (180-TI-ACQ)
The most commonly used T1-weighted imaging sequence is the one used for evaluating myocardial viability with late gadolinium enhancement (LGE), which is T1 weighted so as to depict normal myocardium dark and infarcted myocardium bright (Fig. 12.3). The contrast between normal and infarcted myocardium is based on the premise that 20 min after intravenous Gd-DTPA administration the contrast agent distributes not only in the extracellular but also in the intracellular space in acutely infarcted myocardium. In viable myocardium Gd-DTPA cannot cross the cellular membrane and, therefore, distributes only in the extracellular space [3]. Fibrosis replaces viable myocytes in chronic infarct, thus increasing the extracellular space. Therefore, both acute and chronic infarctions have increased extracellular space compared to viable myocardium. The pulse sequence for viability imaging was presented by Simonetti et al. [4] and was extensively validated by Kim and Judd [5]. The pulse sequence diagram can be seen in Fig. 12.4. This is an ECG triggered pulse sequence where signal acquisition is performed during diastasis in a segmented manner with gradient echoes over several cardiac cycles. This type of acquisition provides diagnostic quality gradient echo images that have been T1-prepared by the inversion pulse. Approximately 20 k-lines are acquired following every inversion pulse within a given RR interval. A heartbeat is usually skipped to allow for T1 recovery before another inversion pulse is applied. Given that the T1 of normal myocardium in the presence of Gd-DTPA 20 min after injection is about 400–500 ms, the inversion time TI can be adjusted by the user to null normal myocardial signal (Fig. 12.5, magenta line) without much dependence on heart rate. This is because for heart rates slower than 80 bpm the 2xRR interval between inversion pulses is about 1.5 s, which corresponds to almost full T1 recovery. For typical LGE images of 160 lines (without applying any additional acceleration techniques) this results in a 16-heartbeat breath-hold.
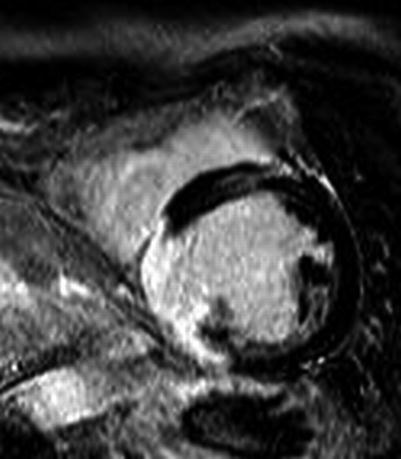
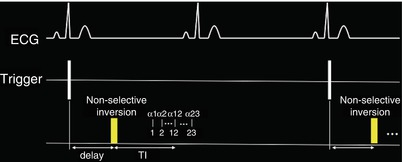
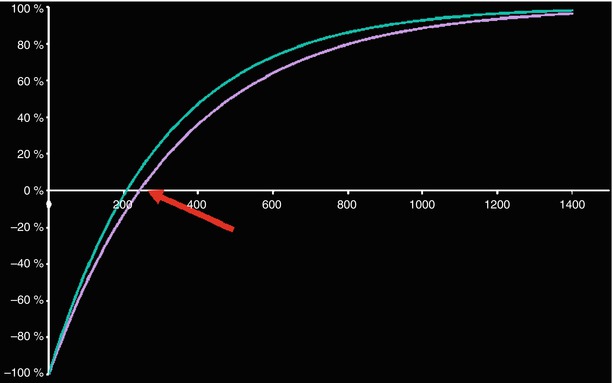

Fig. 12.3
Example of late Gd viability image. Normal myocardium is black while infarcted myocardium is bright

Fig. 12.4
ECG triggered segmented GRE inversion recovery

Fig. 12.5
LGE nulling of normal myocardium (magenta). The red arrow points to the time point of myocardial signal nulling. The infarct appears with positive signal, bright (green)
A modification to the pulse sequence described above has been used in the absence of contrast agents for acquiring T1-weighted images that depict myocardial edema associated with acute myocardial infarction [6]. While this type of pulse sequence was initially used with contrast agents to estimate the appropriate inversion time TI for the LGE viability acquisition, Goldfarb and colleagues used it without gadolinium to evaluate intramyocardial edema. In this case, a CINE acquisition is performed immediately following a non-selective inversion pulse, which is applied upon detection of the R-wave. Aside from the inversion pulse, the acquisition is similar to the CINE used for myocardial function evaluation i.e. it is a segmented acquisition over several heartbeats with a Balanced Steady-State Free Precession (bSSFP) readout (also known as TrueFISP, FIESTA, b-FFE). Within the cardiac cycle, the later cardiac phases are more T1-weighted as a result of the increasing time from the inversion pulse.
Visualizing edema in the heart with T1 tissue-contrast based methods such as the one described above has several drawbacks. First, this type of acquisition demands that two different types of tissue with different intensities are present at any time for contrast (i.e. signal difference) to emerge. This may not always be true for diffuse systemic diseases. Furthermore, the phased array coils used for receiving the MRI signal are not equidistant to all areas of interest within the heart. As a result, the signal is received with different intensities even when all tissue characteristics are the same. Such a surface coil intensity profile may create artificial contrast in otherwise normal tissue based solely on distance from the receiving coil. In other cases, such as with dark-blood methods seen in Chap. 11, the artificial contrast may originate from sequence specific shortcomings. Therefore, rather than looking at signal intensities, it may be beneficial to quantify the intrinsic T1 values within image pixels of the tissue. Such quantification, if performed correctly, has the advantage of providing numbers that depend less on the surface coil intensity profile. Such T1 measurements can also provide an easy way to exchange data between different imaging centers and allow for defining thresholds between diseased and healthy myocardium. In order to quantify the T1 values, an inversion recovery experiment needs to be performed multiple times so that several points along the Inversion Recovery curve can be acquired (Fig. 12.6). This is done by acquiring Inversion Recovery images with different inversion times TI and fitting with an exponential the resulting images on a pixel by pixel basis in order to yield color maps where the T1 value of each pixel can be visualized (Fig. 12.6). While accurate and precise, using such multiple experiments to estimate the T1 values takes a lot of time and is subject to artifacts due to patient motion.
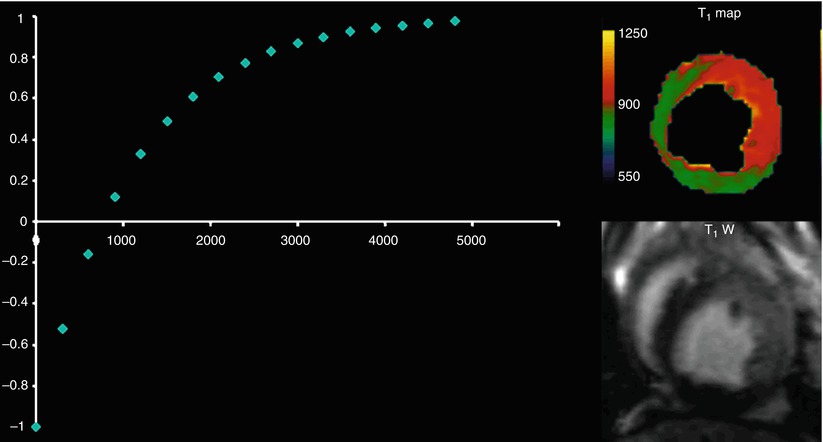

Fig. 12.6
To produce a T1 map, the inversion time TI is varied in a number of inversion recovery experiments and multiple images at different TIs are collected. Each point on the T1 recovery curve is derived from an experiment. The inversion recovery equation (Fig. 12.2) is fit on a pixel-by-pixel basis to yield the T1 value in each pixel (REF: Aletras et al, Program #2102, 11th SCMR Scientific Sessions, Los Angeles, CA, 2008)
In practice, a modified Look-Locker technique is most commonly used, which provides some accuracy and reasonable precision within a single breath-hold. This method is known as MOLLI [5]. The MOLLI pulse sequence diagram is depicted in Fig. 12.7. A non slice-selective inversion RF pulse inverts all the magnetization upon detecting the R-wave. Different time points of the inversion recovery curve (i.e. inversion times TI) are sampled over multiple cardiac cycles with single-shot bSSFP images, which last on the order of 200 ms each. Following a pause, so that the magnetization can recover (commonly a pause of three heartbeats is used for native T1), the inversion is performed anew and single-shot bSSFP images are acquired at different inversion times TI so as to sample different time points on the curve. This is accomplished by adding a fixed increment to the TI. After a second pause (of three heartbeats), a third inversion pulse is applied and five images are acquired in a similar manner to that described above. Since this is the last inversion pulse, five images are acquired instead of three. Figure 12.7 shows the three, three and five inversion recovery images obtained in this manner. One can appreciate the change in contrast with varying inversion time TI. Figure 12.8 shows how MOLLI images are post-processed. The images are listed according to their inversion time. Since these are magnitude images, negative signal intensity values have lost their negative sign and appear positive i.e. the absolute value (i.e. rectified value) of the signal is seen. The sign is recovered based on the shape of the rectified inversion recovery curve. Since each of the single-shot bSSFP images that sample the inversion recovery curve essentially modifies the inversion curve, a correction factor is applied when fitting the data with the exponential equation. This correction factor attempts to compensate for the successive imaging of the recovery curve so as to produce better estimates of the true T1 values within each pixel. Fitting is done on a pixel-by-pixel basis to produce the T1 map. In the resulting T1 map the value of each pixel represents the T1 value of the tissue within the pixel. Motion correction prior to fitting can improve the T1 estimates since it is common to observe diaphragmatic motion throughout the MOLLI pulse sequence. Modifications to the MOLLI pulse sequence have been proposed during the last few years in order to further improve the T1 estimates [7]. Also, newer methods to overcome MOLLI accuracy issues have been presented. For example, SASHA is based on multiple saturation recovery experiments rather than successive inversions [8]. Its advantage is higher accuracy since the signal recovers from zero and therefore the estimates are less vulnerable to heart rate variations. Prior to collecting patient data, each T1 mapping technique should be thoroughly tested on-site with phantoms of known T1 values so as to avoid surprises later on. These are complicated data acquisition methods where errors that can occur either during image acquisition or post-processing can be avoided with careful planning and testing.
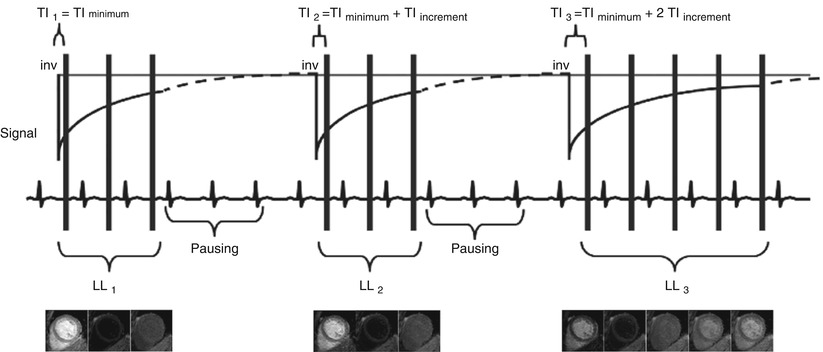


Fig. 12.7
The MOLLI approach: inversion recovery images are obtained with ECG-triggered single-shot bSSFP at different inversion times TI [5]

Fig. 12.8
MOLLI magnitude images are first listed according to their TI value. Sign recovery is performed and the Look-Locker correction is applied. Fitting produces the T1 map where each pixel depicts the T1 value
Extracellular volume (ECV) imaging uses the MOLLI pulse sequence. ECV imaging provides estimates of the extracellular volume on a pixel-by-pixel basis and can provide a truly fresh look into diffuse myocardial diseases. ECV imaging is based on the fact that the MRI contrast agent Gd-DTPA does not cross the cellular membrane and that after injection remains primarily within the extracellular space. As such, Gd-DTPA becomes a probe for extracellular space. In general, the higher the concentration of Gd, the lower the T1 observed in the myocardium. If one defines R1 as the inverse of T1 (i.e. R1 = 1/T1) then the change observed in the native (i.e. pre-contrast) R1 after the injection of Gd is proportional to the concentration of the contrast agent [Gd] [9], which distributes in the extracellular space. If one measures the change in R1 both in myocardium and blood then
![$$ \frac{DR{1}_{myocardium}}{DR{1}_{blood}}=\frac{{\left[\mathrm{G}\mathrm{d}\right]}_{\mathrm{myocardium}}}{{\left[\mathrm{G}\mathrm{d}\right]}_{\mathrm{blood}}}=\frac{{\mathrm{ECV}}_{\mathrm{myocardium}}}{{\mathrm{ECV}}_{\mathrm{blood}}} $$](/wp-content/uploads/2016/07/A315651_1_En_12_Chapter_Equa.gif) Furthermore, the hematocrit is the percent volume of red blood cells in blood. Since we have defined ECVblood as the percentage of extracellular volume in blood then ECVblood = 1 − HCT. Therefore, the hematocrit provides a measurable quantity, obtained via a blood sample. The hematocrit can be used for converting the observed changes in R1 values into an ECV measurement for the myocardium as follows:
Furthermore, the hematocrit is the percent volume of red blood cells in blood. Since we have defined ECVblood as the percentage of extracellular volume in blood then ECVblood = 1 − HCT. Therefore, the hematocrit provides a measurable quantity, obtained via a blood sample. The hematocrit can be used for converting the observed changes in R1 values into an ECV measurement for the myocardium as follows:
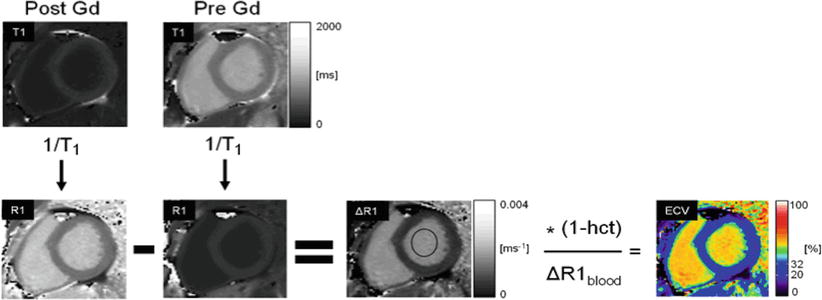
 A block diagram of the steps taken to produce color ECV maps by magnetic resonance is shown in Fig. 12.9 [10].


![$$ \frac{DR{1}_{myocardium}}{DR{1}_{blood}}=\frac{{\left[\mathrm{G}\mathrm{d}\right]}_{\mathrm{myocardium}}}{{\left[\mathrm{G}\mathrm{d}\right]}_{\mathrm{blood}}}=\frac{{\mathrm{ECV}}_{\mathrm{myocardium}}}{{\mathrm{ECV}}_{\mathrm{blood}}} $$](/wp-content/uploads/2016/07/A315651_1_En_12_Chapter_Equa.gif)


Fig. 12.9
Extracellular volume (ECV) is estimated by subtracting an R1 map obtained post Gd-DTPA administration from the native R1 map obtained prior to contrast administration. The R1 of the blood pool and the hematocrit are used to convert R1 values in the myocardium into ECV estimates in the myocardium, as described in the text [10]
< div class='tao-gold-member'>
Only gold members can continue reading. Log In or Register to continue
Stay updated, free articles. Join our Telegram channel

Full access? Get Clinical Tree


