Block of variables
n
Average
SD
Minimum
Maximum
25th Quartile
Median
75th Quartile
Calculated significance (P)
Total leukocytes pre
18
7,369.44
2,629.74
2,090.00
12,450.00
5,980.00
7,180.00
9,190.00
Total leukocyte intra
18
11,507.22
5,950.92
2,930.00
21,100.00
6,940.00
9,255.00
18,002.50
Total leukocytes 24 h
18
13,738.33
3,763.50
7,990.00
23,980.00
10,655.00
13,680.00
15,275.00
<0.001
Total leukocytes 48 h
18
12,966.67
3,933.52
8,060.00
23,320.00
10,290.00
12,410.00
13,825.00
Total neutrophils pre
18
7,927.22
13,646.36
690,00
62,000.00
3,920.00
4,670.00
6,520.00
Total neutrophils intra
18
9,342.78
5,258.52
1,140.00
19,620.00
5,240.00
8,225.00
13,897.50
Total neutrophils 24 h
18
11,646.67
3,926.20
6,310.00
23,260.00
8,920.00
11,480.00
12,807.50
<0.001
Total neutrophils 48 h
18
10,607.11
4,655.99
858.00
20,990.00
8,145.00
9,515.00
12,522.50
Total platelet pre
18
244,444.44
76,814.69
130,000.00
385,000.00
177,750.00
247,000.00
307,750.00
Total platelet intra
18
166,277.78
62,520.40
85,000.00
311,000.00
117,000.00
160,000.00
201,500.00
<0.001
Total Platelet 24
18
160,994.44
59,754.86
73,000.00
305,000.00
122,250.00
142,500.00
209,750.00
Total platelet 48 h
18
160,994.44
63,178.99
83,000.00
306,000.00
129,250.00
147,500.00
223,500.00

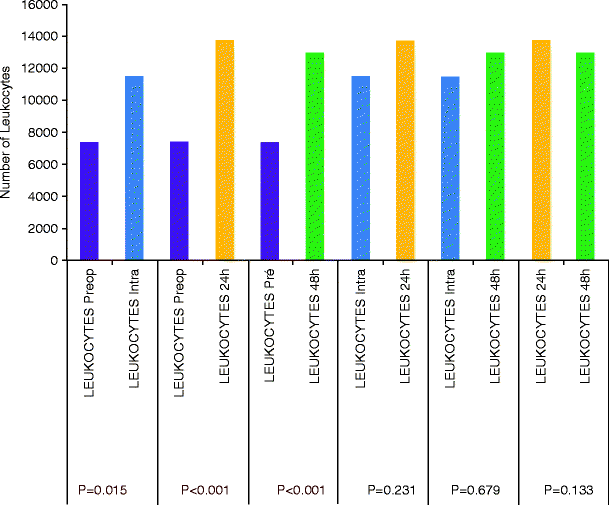
Fig. 31.1
Comparison between time points regarding number of total leukocytes

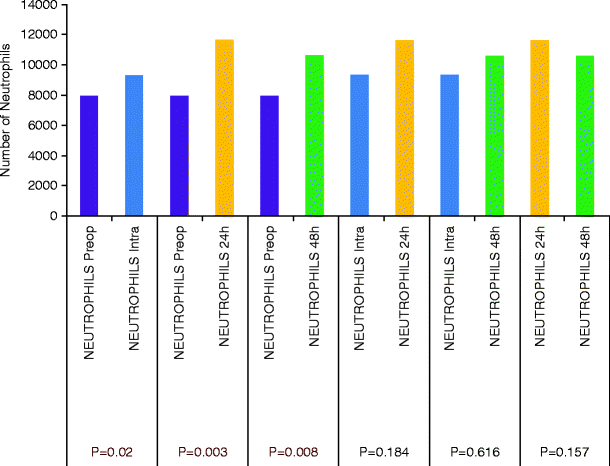
Fig. 31.2
Comparison between time points regarding number of neutrophils

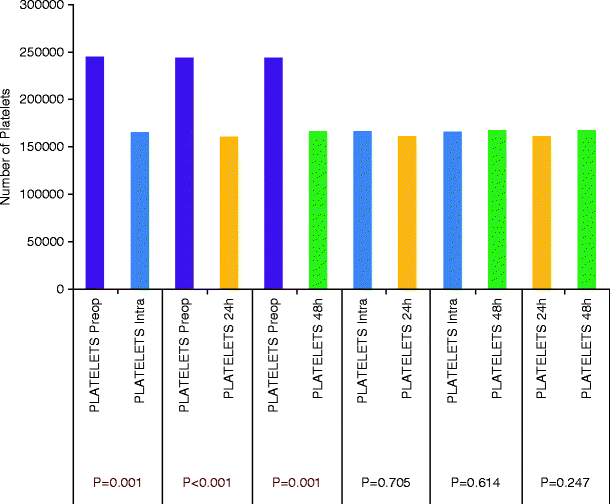
Fig. 31.3
Comparison between time points regarding number of platelets
Many authors have assumed that decreased thyroid hormones levels occurring during cardiopulmonary bypass should be preoperatively balanced by T4 or T3 supplementation. The rationale for this undertaking is prevention of negative effects from depressed cardiac output, perfusion pressure, stroke volume, and contractility intra- and postoperatively [8, 9].
Nonetheless, as pointed out previously, this matter is so intriguing that some authors, such as Velissaris et al. [10], have advocated that a reduction in thyroid hormone levels might consist of an organic adaptive process of reduced catabolism rather than a true hypothyroid state. The basis for this theory was the association between low free T3 levels and high global oxygen consumption (Fig. 31.10) [10].


Table 31.2
Comparison between the time points of simultaneous observation for total protein and albumin
Block of variables | n | Average | SD | Minimum | Maximum | 25th Quartile | Median | 75th Quartile | Calculated significance (P) |
|---|---|---|---|---|---|---|---|---|---|
Total protein pre | 18 | 6.78 | 0.88 | 5.00 | 7.90 | 6.03 | 7.00 | 7.50 | |
Total protein intra | 18 | 4.70 | 0.90 | 2.80 | 6.20 | 4.30 | 4.85 | 5.33 | |
Total protein 24 | 18 | 4.85 | 0.58 | 3.20 | 5.70 | 4.58 | 5.00 | 5.13 | <0.001 |
Total protein 48 h | 18 | 5.11 | 0.68 | 3.20 | 6.40 | 4.88 | 5.10 | 5.40 | |
Total albumins pre | 18 | 4.05 | 0.56 | 2.80 | 4.90 | 3.73 | 4.10 | 4.40 | |
Total albumins intra | 18 | 2.72 | 0.53 | 1.70 | 3.60 | 2.33 | 2.75 | 3.20 | |
Total albumins 24 h | 18 | 2.86 | 0.39 | 2.00 | 3.50 | 2.68 | 2.90 | 3.03 | <0.001 |
Total albumins 48 h | 18 | 2.94 | 0.37 | 1.80 | 3.50 | 2.80 | 3.00 | 3.13 |

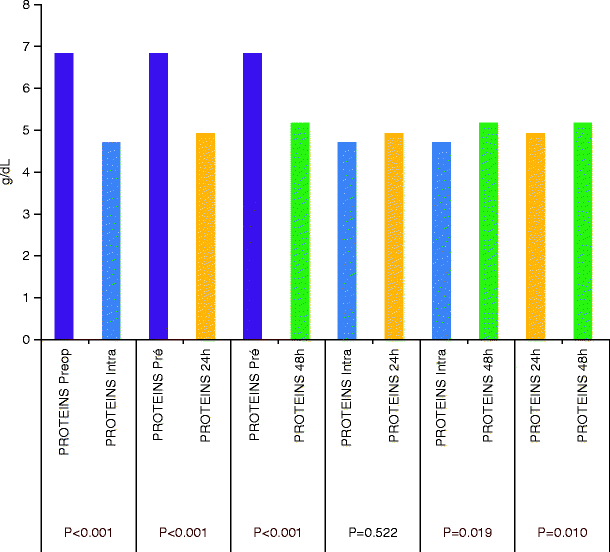
Fig. 31.4
Comparison between time points regarding levels of total proteins
< div class='tao-gold-member'>
Only gold members can continue reading. Log In or Register to continue
Stay updated, free articles. Join our Telegram channel

Full access? Get Clinical Tree


