Three-Dimensional Transesophageal Echocardiography


Three-Dimensional Transesophageal Echocardiography


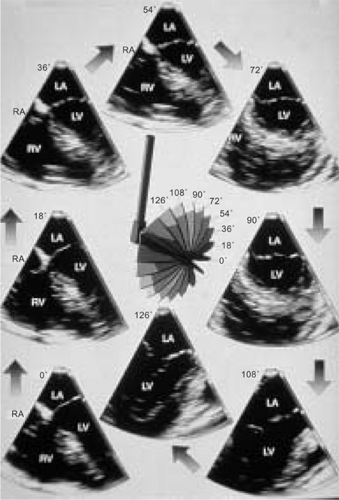
Sequential multiplane two-dimensional transesophageal echocardiographic (2D TEE) images provide a detailed assessment of cardiac lesions and are ideal for three-dimensional transesophageal echocardiographic (3D TEE) reconstruction. The first study using a multiplane 2D TEE probe to perform 3D reconstruction was published in 1992, from our laboratory. Basically, a selected area of interest was placed in the center of the imaging sector and images acquired by rotating the transducer from 0° to 180° in small increments of 1° to 3°, taking care to keep the probe fixed in one position and the patient lying still. The acquired images were then transferred to an offline computer (TomTec Company, Munich, Germany) for subsequent 3D reconstruction. A more recent innovation enables 3D reconstruction on the same ultrasound system that is used to acquire sequential 2D images. Also, the time taken to reconstruct a 3D image has been reduced to about 1 minute. To minimize artifacts in the 3D TEE reconstructed images, it is important to acquire images only in a particular phase of respiration, and at comparable RR intervals. This is often done by setting up a gating window utilizing an online histogram based on the patient’s heart rate.

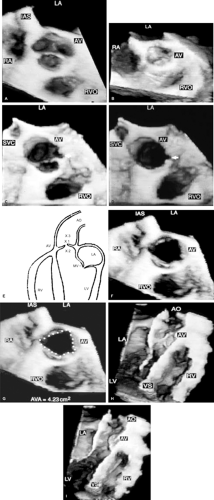
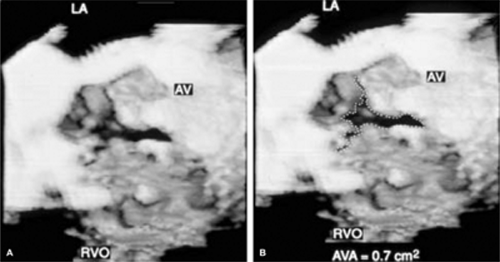
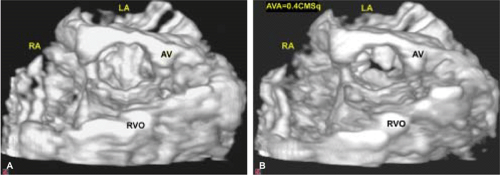
An important clinical application of 3D TEE reconstruction is the assessment of left ventricular volumes and ejection fraction without making an assumption regarding the geometric shape of the left ventricle (LV). This improves accuracy and reduces intra- and inter-observer variability, an important limitation of 2D echocardiography. An early application of 3D TEE was accurate assessment of aortic valve morphology and orifice area in patients with aortic stenosis undergoing 2D TEE. The 3D volumetric data set permits short axis sections across the aortic valve at any desired angle, resulting in the identification of the smallest aortic valve orifice area for planimetry, usually located at the tip of the aortic valve. With 2D TEE, the probe is moved up and down the esophagus to identify the smallest orifice. 3D TEE has the advantage of being able to examine any planes that would increase the likelihood that the imaging plane is exactly parallel to the aortic orifice, maximizing the accuracy of stenotic orifice area measurement.

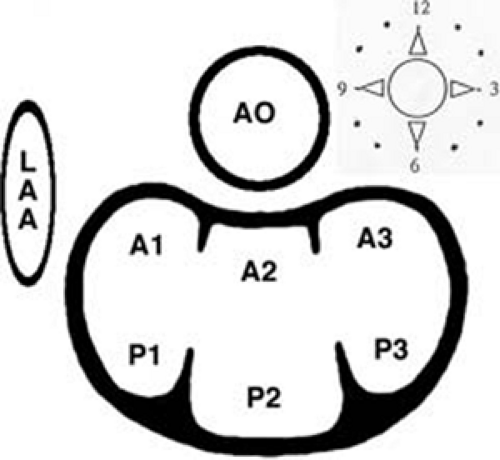
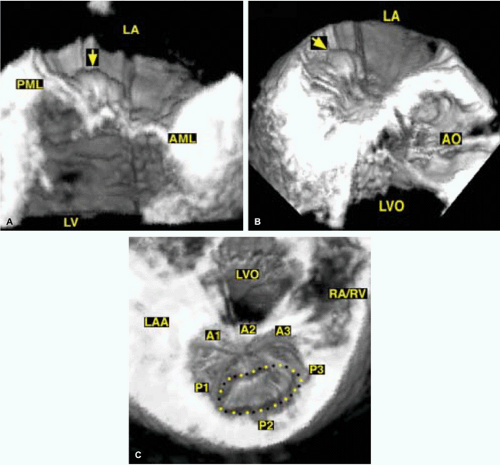
3D TEE is superior to 2D TEE in the detection of individual scallop/segment prolapse of the mitral valve. Accurate identification of scallop or segment prolapse and its extent is crucial when considering patients for mitral valve repair. With 3D TEE, short-axis cuts can be taken at any level and the atrial surfaces of both leaflets viewed en face. Therefore, individual scallop or segment prolapse and its extent can be easily assessed. This information is important for the surgeon who may find it difficult to estimate the true extent of any scallop or segment prolapse in a heart devoid of blood. As discussed in Chapter 2, multiplane 2D TEE has important limitations in the assessment of individual scallop or scallop prolapse.

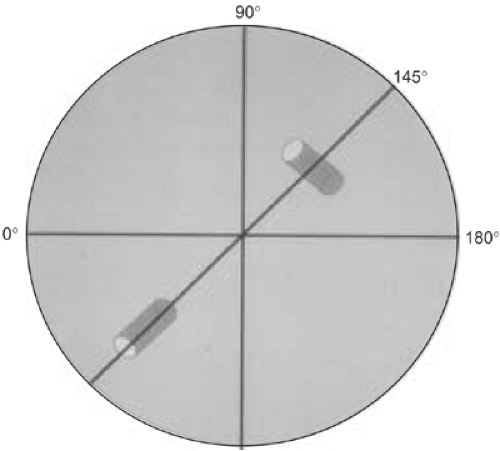
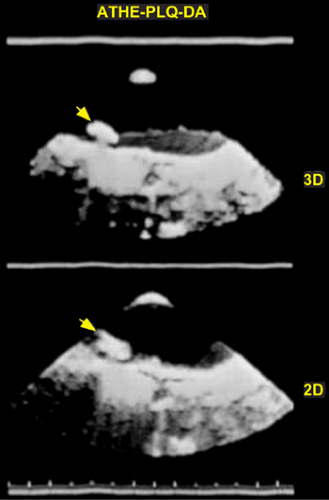
3D TEE is also superior to 2D TEE in assessing the dimensions of intracardiac masses such as infective vegetations, thrombi, atherosclerotic plaques, tumors, and intracardiac defects such as atrial septal defects. In several instances, the maximum size of these lesions has been underestimated by multiplane 2D TEE, as compared to 3D TEE and surgery or pathologic measurements. Using multiplane 2D TEE, the maximal dimension of a lesion can be obtained only if its long axis lies exactly parallel to the ultrasonic beam as it rotates from 0° to 180°; otherwise the maximum linear dimension will be underestimated. On the other hand, with 3D TEE, any imaging plane can be interrogated in the search for the maximum lesion dimension. 3D TEE also permits accurate assessment of volumes of intracardiac masses. Unlike multiplane 2D TEE, 3D TEE enables en face viewing of intracardiac defects and openings in congenital membranes such as cor triatriatum sinister, permitting accurate assessment of their shape and size. These aspects are of practical clinical importance. For instance, the size of infective vegetations correlates with embolic potential and patient prognosis and information on the exact size of an atrial septal defect is important during catheter closure of the defect.


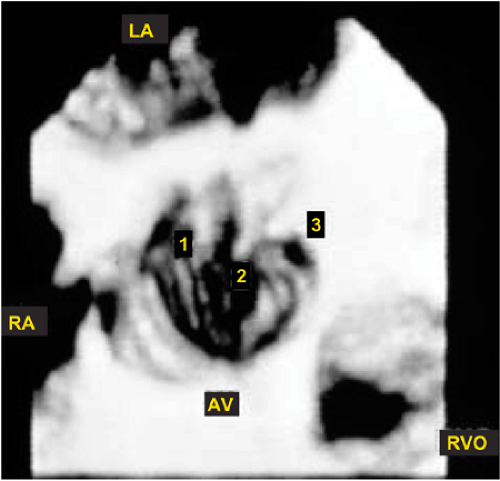
Another example of the utility of 3D TEE in providing anatomic definition has been the assessment of Lambl’s excrescences on the aortic valve. In a few patients studied by us, more Lambl’s excrescences were found using 3D TEE than using 2D TEE. We have also found 3D TEE to be useful in providing a more secure diagnosis of an aortic valve papillary fibroelastoma. Multiple small projections from the tumor and bright echoes in the middle of the stalk, consistent with fronds and a collagenous central core, both pathologically characteristic of a fibroelastoma, were better seen using 3D TEE than using multiplane 2D TEE.

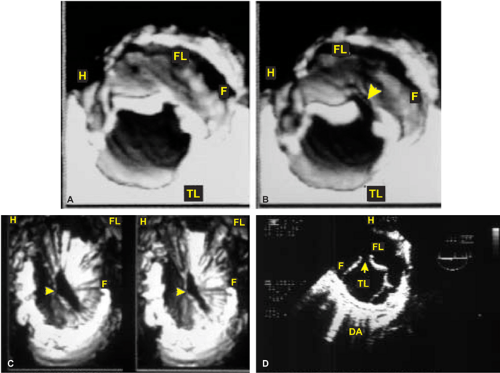
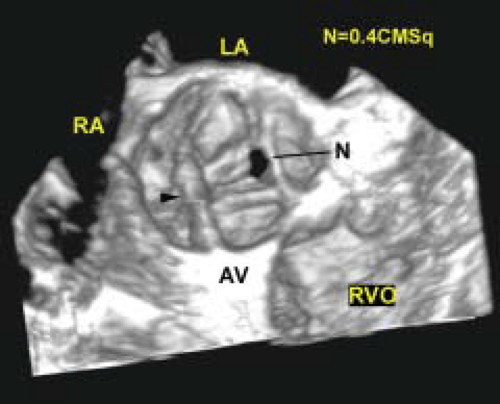
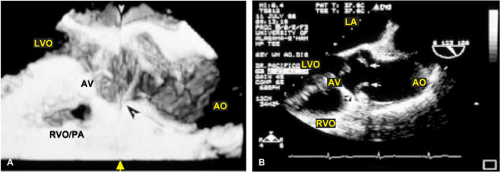
3D TEE has supplemented multiplane 2D TEE in the assessment of aortic dissection, specifically in patients in whom it is difficult to distinguish a dissection flap from an imaging artifact. In these instances, misdiagnosis has occurred. With 3D TEE, the dissection flap is seen in 3D as a sheet of tissue and not a linear structure, improving the specificity of diagnosis as compared to 2D TEE. Because 3D TEE provides en face views of prosthetic valves, abnormalities such as suture dehiscence and abscesses can be well visualized and their exact location in relation to the prosthesis can be accurately identified. Because the orientation of TEE images does not correspond to the surgeon’s view in the operating room, we have found it useful to describe images in relation to a surgical clock corresponding to the surgeon’s field of view as he stands on the right side of the patient. When the surgeon looks at the mitral prosthesis, the left atrial appendage is positioned at 9 o’clock or 10 o’clock, with the aorta at 12 o’clock. These landmarks can be used by the echocardiographer to describe the exact location of abnormalities such as suture dehiscence. For the aortic prosthesis, the clock is arranged with the atrial septum and left coronary artery at 7 o’clock and 11 o’clock positions, respectively. Important landmarks during the surgeon’s exposure of the tricuspid valve and right atrium are the inferior and superior vena cavae at the 4 o’clock and 8 o’clock to 9 o’clock, respectively.

3D TEE has also been useful in evaluating patients with left ventricular pseudoaneurysms. In one such patient with associated severe mitral regurgitation, 3D TEE clearly showed localized distortion of the mitral annulus produced by the pseudoaneurysm. Because there was no other obvious etiology to explain the presence of severe mitral regurgitation, it was decided not to repair or replace the mitral valve. Decompression of the pseudoaneurysm following repair normalized the mitral annulus, resulting in almost total abolition of mitral regurgitation. Therefore, in this patient, 3D TEE identified a localized distortion of the mitral annulus responsible for the presence of severe mitral regurgitation.

When examining proximal and/or mid coronary arteries by multiplane 2D TEE, only small segments are usually visualized in any given view as the ultrasonic 2D plane moves in and out of the plane of the coronary arteries. This problem is alleviated by 3D TEE since all visualized segments are contained within the 3D volumetric data set, which can be cropped suitably to bring longer segments of the coronary arteries into view. Also, sections can be taken exactly parallel to the short axis of a given coronary artery to ascertain the presence or absence of significant stenosis. With multiplane 2D TEE, an eccentrically located plaque or an oblique plane can create an impression of severe stenosis when none may be present. Therefore, 3D TEE is a useful adjunct to multiplane 2D TEE in the evaluation of coronary arteries for stenosis.

In conclusion, in many patients, 3D TEE provides important information beyond that provided by 2D TEE.
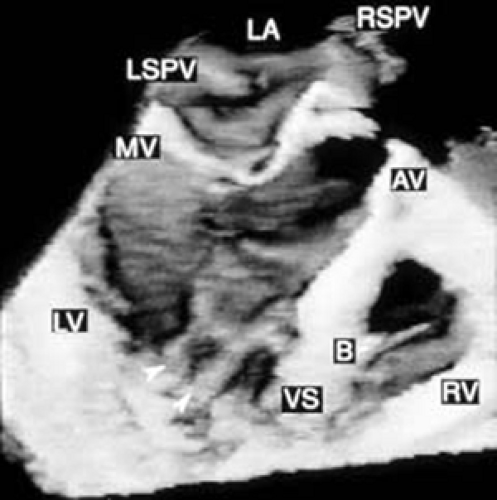


FIGURE 12.1. Multiplanar transesophageal two-dimensional images of the left ventricle. LA, left atrium; LV, left ventricle; RA, right atrium; RV, right ventricle. (Reproduced with permission from
Nanda NC, Pinheiro L, Sanyal R, et al. Multiplane transesophageal echocardiographic imaging and three-dimensional reconstruction: a preliminary study. Echocardiography 1992;9:667–676.


)


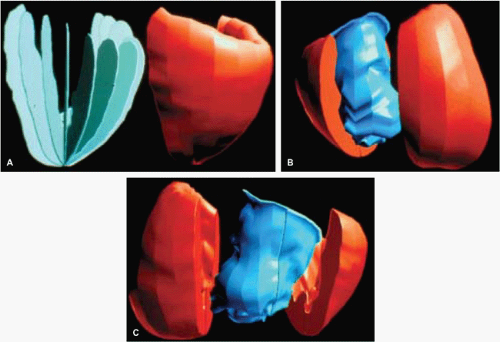
FIGURE 12.2. Three-dimensional reconstruction of the left ventricle using sequential planes obtained from multiplane transesophageal examination in an adult patient. For three-dimensional reconstruction, all frames were obtained in mid-diastole using the mitral valve motion as the reference. A shows the “rib cage” on the left. B and C show the “volume cast” of the left ventricular cavity. (Reproduced with permission from
Nanda NC, Pinheiro L, Sanyal R, et al. Multiplane transesophageal echocardiographic imaging and three-dimensional reconstruction: a preliminary study. Echocardiography 1992;9:667–676.


)


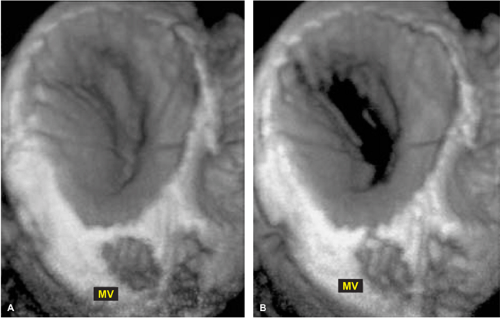
FIGURE 12.3. Transesophageal three-dimensional reconstruction of normal mitral valve. A,B. Mitral valve (MV) opening is visualized from the atrial aspect. Left: closed MV; Right: opened MV. (Reproduced with permission from
Nanda NC and Sorrell VL, eds. Atlas of three-dimensional echocardiography. Malden, MA: Blackwell Futura, 2002:30.
)


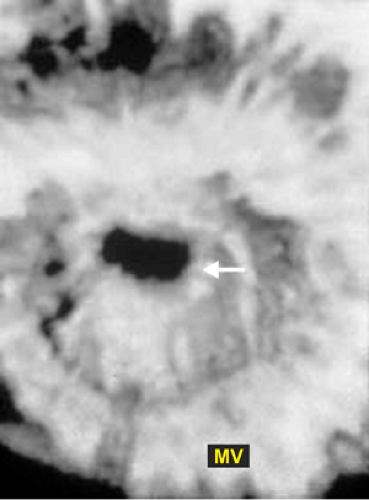
FIGURE 12.4. Transesophageal three-dimensional reconstruction of mitral valve in mitral stenosis. The stenotic orifice (arrow) is well seen. MV, Mitral valve (Reproduced with permission from
Nanda NC and Sorrell VL, eds. Atlas of three-dimensional echocardiography. Malden, MA: Blackwell Futura, 2002:54.
)


FIGURE 12.5. Transesophageal three-dimensional reconstruction of normal aortic valve. A. When the aortic valve (AV) is viewed from the aortic side in short axis, the aortic sinuses appear as saucer-shaped depressions in the closed position in diastole. B. When viewed from the left ventricle (LV) the bulge produced by the aortic sinuses in diastole is evident. C,D. When the AV is viewed from a position higher in the supravalvar aorta, the AV is viewed together with a segment of the proximal ascending aorta (AA) in both diastole (C) and systole (D). The arrow points to the orifice of the left main coronary artery. E. Schematic showing the three positions used by us to view the AV. 1, aortic root close to the AV; 2, LV close to the AV; 3, supravalvar aorta. F,G. Show the AV in the open position in systole. The aortic orifice area obtained by planimetry (G) measured 4.23 cm2, which is within the normal range. H,I. The AV and both LV and right ventricle (RV) are viewed in long axis in diastole (H) and systole (I). AO, aorta; IAS, interatrial septum; LA, left atrium; MV, mitral valve; RA, right atrium; RVO, right ventricular outflow tract; SVC, superior vena cava; VS, ventricular septum. (Reproduced with permission from
Nanda NC, Roychoudhury D, Chung SM, et al. Quantitative assessment of normal and stenotic aortic valve using transesophageal three-dimensional echocardiography. Echocardiography 1994;11:617–625.


)


FIGURE 12.6. Three-dimensional reconstruction of the ventricle and right ventricle in the same patient shown in Figure 12.5. Arrowheads point to papillary muscles in the left ventricle. B, moderator band in the right ventricle; AV, aortic valve; LA, left atrium; LSPV, left superior pulmonary vein; LV, left ventricle; MV, mitral valve; RSPV, right superior pulmonary vein; RV, right ventricle; VS, ventricular septum. (Reproduced with permission from
Nanda NC, Roychoudhury D, Chung SM, et al. Quantitative assessment of normal and stenotic aortic valve using transesophageal three-dimensional echocardiography. Echocardiography 1994;11:617–625.


)


FIGURE 12.7. Transesophageal three-dimensional reconstruction of stenotic aortic valve. A,B. The aortic valve (AV) shows multiple echo dense areas indicative of severe thickening and calcification. Although the AV is considerably distorted, three leaflets are easily identified in systole. The aortic orifice is very small and measured 0.7 cm2 by planimetry (B). LA, left atrium; RVO, right ventricular outflow tract. (Reproduced with permission from
Nanda NC, Roychoudhury D, Chung SM, et al. Quantitative assessment of normal and stenotic aortic valve using transesophageal three-dimensional echocardiography. Echocardiography 1994;11:617–625.


)


FIGURE 12.8. Severely calcified tricuspid aortic valve stenosis. A. Diastolic frame. Aortic valve (AV) is seen in the closed position. B. Systolic frame. AV is seen in the open position. AV orifice area measured 0.4 cm2 by planimetry. Note severe and extensive AV calcification. AVA, AV area; LA, left atrium; RA, right atrium; RVO, right ventricular outflow tract. (Reproduced with permission from
Dod HS, Nanda NC, Agrawal GG, et al. Three-dimensional transesophageal echocardiographic assessment of aortic valve pathology. Am J Geriatr Cardiol 2003;12:209–213.


)


FIGURE 12.9. A,B. Fibrotic aortic stenosis in an adult with dwarfism. Three-dimensional reconstruction. The tricuspid aortic valve (AV) is shown in the closed position in diastole (A) and in the open position in systole (B). Note the central stenotic orifice. LA, left atrium; PA, pulmonary artery; RA, right atrium; RVO, right ventricular outflow tract. (Reproduced with permission from
Huang WY, Nanda NC, Miller A, et al. Fibrotic aortic stenosis in a patient with dwarfism quadricuspid aortic valve. Echocardiography 2000;17:701–704.


)


FIGURE 12.10. Schematic diagram of the segmental classification used to describe the prolapse of mitral valve, as viewed by the surgeon. A1, A2, and A3, anterolateral, middle, and posteromedial segments of anterior mitral valve (MV) leaflet; AO, aorta; LAA, left atrial appendage; P1, P2, and P3, anterolateral, middle, and posteromedial scallops of posterior mitral valve (PMV) leaflet. (Reproduced with permission from
Ahmed S, Nanda NC, Miller AP, et al. Usefulness of transesophageal three-dimensional echocardiography in the identification of individual segment/scallop prolapse of the mitral valve. Echocardiography 2003a;20:203–209.


)


FIGURE 12.11. Usefulness of transesophageal three-dimensional echocardiography in the identification of individual segment/scallop prolapse of the mitral valve. A,B. Long (A) and oblique (B) axis views demonstrating prominent posterior mitral valve leaflet (PML) prolapse (arrows). C. Systolic short axis view of MV demonstrating P2 prolapse (dotted line) in another patient. A1, A2, A3, anterolateral, middle, and posteromedial segments of anterior mitral valve leaflet (AML); AO, aorta; LA, left atrium; LAA, left atrial appendage; LV, left ventricle; LVO, left ventricular outflow tract; P1, P2, and P3, anterolateral, middle, and posteromedial scallops of PML leaflet; RA/RV, right atrium/right ventricle. (Reproduced with permission from
Ahmed S, Nanda NC, Miller AP, et al. Usefulness of transesophageal three-dimensional echocardiography in the identification of individual segment/scallop prolapse of the mitral valve. Echocardiography 2003a;20:203–209.


)


FIGURE 12.12. A. Three-dimensionally reconstructed short-axis and long-axis views of the mitral valve (MV) in one of our patients showing multiple vegetations (arrows). B. A large vegetation (arrowheads) is seen on the posterior mitral leaflet (PML). AML, anterior mitral leaflet; AO, aorta; LV, left ventricle. (Reproduced with permission from
Nanda NC, Abd-El Rahman SM, Khatri G, et al. Incremental value of three-dimensional echocardiography over transesophageal multiplane two-dimensional echocardiography in qualitative and quantitative assessment of cardiac masses and defects. Echocardiography 1995;12:619–628.


)


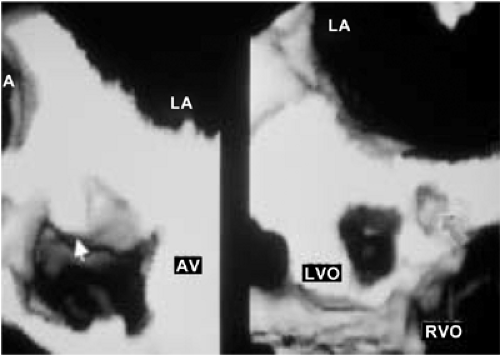
FIGURE 12.13. A large vegetation (left, arrow) is noted on the aortic valve (AV) together with an abscess cavity (right, arrow) involving the mitral-aortic intervalvular fibrosa. LA, left atrium; LVO, left ventricular outflow tract; RVO, right ventricular outflow tract. (Reproduced with permission from
Nanda NC, Abd-El Rahman SM, Khatri G, et al. Incremental value of three-dimensional echocardiography over transesophageal multiplane two-dimensional echocardiography in qualitative and quantitative assessment of cardiac masses and defects. Echocardiography 1995;12:619–628.


)


FIGURE 12.14. A. Three-dimensionally reconstructed images of the aortic valve viewed in long axis showing multiple abscesses (arrows) involving the aortic root region, ventricular septum (VS), mitral-aortic intervalvular fibrosa, and body of the anterior mitral leaflet (AML). B. Short-axis view in the same patient showing a large perforation (1) in the noncoronary cusp (NCC), extensive destruction of the left coronary cusp (LCC), and a large central area of noncoaptation (2) of aortic valve (AV) leaflets in diastole (left). The systolic frame is shown on the right. LA, left atrium; LV, left ventricle; RCC, right coronary cusp; RV, right ventricle. (Reproduced with permission from
Nanda NC, Abd-El Rahman SM, Khatri G, et al. Incremental value of three-dimensional echocardiography over transesophageal multiplane two-dimensional echocardiography in qualitative and quantitative assessment of cardiac masses and defects. Echocardiography 1995;12:619–628.


)


FIGURE 12.15. Schematic diagram demonstrating that the maximum dimension of an object (in this case, a cylinder) can be obtained only if the ultrasound beam cuts through its longest dimension (true long axis) when using a multiplane probe. However, when the two-dimensional planes (dotted lines) are stacked together to obtain a three-dimensional image, the object (cylinder), including its long axis, can be viewed completely, even though it is not oriented parallel to the ultrasonic beam as it is rotated from 0° to 180°. As demonstrated here, it is not possible to image the true long axis of an intracardiac mass lesion or defect (such as an atrial septal defect) using multiplane two-dimensional transesophageal echocardiograpy unless it lies exactly parallel to the ultrasound beam as it is rotated from 0° to 180°. Therefore, the maximum size of a mass or defect may be underestimated by multiple two-dimensional transesophageal echocardiography. On the other hand, with three-dimensional transesophageal reconstruction, multiple sequential two-dimensional images are stacked to reconstruct the entire object in three dimensions, permitting accurate assessment of all its dimensions. (Reproduced with permission from
Nanda NC, Abd-El Rahman SM, Khatri G, et al. Incremental value of three-dimensional echocardiography over transesophageal multiplane two-dimensional echocardiography in qualitative and quantitative assessment of cardiac masses and defects. Echocardiography 1995;12:619–628.


)


FIGURE 12.16. Lambl’s excrescences on the aortic valve. Transesophageal three-dimensional echocardiographic reconstruction. Aortic valve (AV) viewed in short axis from the aortic side. Three excrescences are noted: one on the noncoronary cusp (1) and two on the left cusp (2 and 3). Two-dimensional imaging showed only two. LA, left atrium; RA, right atrium; RVO, right ventricular outflow tract. (Reproduced with permission from
Samal AK, Nanda NC, Thakur AC, et al. Three-dimensional echocardiographic assessment of Lambl’s excrescences on the aortic valve. Echocardiography 1999;16:437–441.


)


FIGURE 12.17. Atheromatous plaque (arrow) in the aortic arch seen in three dimensions (top). The two-dimensional image is shown at the bottom for comparison. (Reproduced with permission from
Nanda NC, Abd-El Rahman SM, Khatri G, et al. Incremental value of three-dimensional echocardiography over transesophageal multiplane two-dimensional echocardiography in qualitative and quantitative assessment of cardiac masses and defects. Echocardiography 1995;12:619–628.


)


FIGURE 12.18. Transesophageal three-dimensional echocardiographic reconstruction in aortic dissection. A,B. The descending thoracic aorta was examined using multiple cut sections and various viewing angles. Both the true lumen (TL) and the false lumen (FL) are well visualized, and the dissection flap (F) presents as a sheet-like structure along the aortic length. C. The communication (arrowheads) between the TL and FL is viewed en face in (C) using a transverse section. As would be expected, the communication is larger in systole (left, C) than in diastole (right, C). D represents a two-dimensional image shown for comparison. Note that the F in the descending aorta (DA) appears only as a linear structure, which has been difficult to differentiate from an artifact in some patients. H, hematoma. (Reproduced with permission from
Nanda NC, Khatri GK, Samal A, et al. Three-dimensional echocardiographic assessment of aortic dissection. Echocardiography 1998;15:745–754.


)


FIGURE 12.19. Aortic regurgitation associated with aortic dissection. Diastolic frame. N points to the area of aortic valve (AV) leaflet noncoaptation, which measures 0.4 cm2 by planimetry. This resulted in severe aortic regurgitation (AR). The arrowhead denotes the dissection flap, which was found not to interfere with AV cusp motion by three-dimensional transesophageal echocardiography. LA, left atrium; RA, right atrium; RVO, right ventricular outflow tract. (Reproduced with permission from
Dod HS, Nanda NC, Agrawal GG, et al. Three-dimensional transesophageal echocardiographic assessment of aortic valve pathology. Am J Geriatr Cardiol 2003;12:209–213.


)


FIGURE 12.20. Three-dimensional transesophageal echocardiographic demonstration of aortic dissection flap protruding into the right coronary artery ostium in an elderly patient. A. The black arrowhead points to the dissection flap protruding into the ostium of the right coronary artery. The white arrowheads denote a midline artifact. B. Two-dimensional transesophageal echocardiogram for comparison. The arrows point to the dissection flap, which appears to extend into the orifice of the right coronary artery (arrowhead). AO, aorta; AV, aortic valve; LA, left atrium; LVO, left ventricular outflow tract; RVO/PA right ventricular outflow tract/pulmonary artery. (Reproduced with permission from
Ansingkar KG, Aaluri SR, Nanda NC. Three-dimensional transesophageal echocardiographic demonstration of aortic dissection flap extending into right coronary artery ostium. Am J Geriatr Cardiol 2000;9:344–345.


)


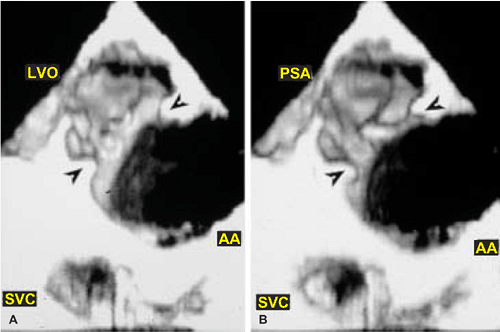
FIGURE 12.21. Transesophageal three-dimensional reconstruction in a patient with aortic arch (AA) injury from blunt trauma. A,B.

Only gold members can continue reading. Log In or Register to continue

Stay updated, free articles. Join our Telegram channel

Jun 15, 2016 | Posted by in CARDIOLOGY | Comments Off on Three-Dimensional Transesophageal Echocardiography

Full access? Get Clinical Tree

Get Clinical Tree app for offline access