Thoracic Aorta Disease: Flow Evaluation by MR


Thoracic Aorta Disease: Flow Evaluation by MR


Michael D. Hope

Petter Dyverfeldt


BACKGROUND

Blood flow assessment with magnetic resonance imaging (MRI) is rapidly evolving. Advances in scanner hardware, pulse sequence design, and postprocessing of data have allowed the dynamic visualization of flowing blood through large and complex cardiovascular territories (Fig. 33.1) and the quantification of many hemodynamic parameters that influence vascular homeostasis. The aorta has been the focus of many of these developments. It is the largest artery in the body and subject to extreme hemodynamic forces as it receives and directs the systolic impulse of the left ventricle with each heartbeat.


INTRODUCTION TO AORTIC IMAGING

Aortic aneurysmal disease is the 18th most common cause of death, accounting for at least 13,843 deaths annually in the United States (1). An apparent increase in patients with aneurysms, in recent years, may largely reflect increased detection with the more frequent use of cross-sectional imaging. Abdominal aortic aneurysms (AAAs) are more common than their thoracic counterparts. They are found in up to 5% of men over 65 years old (2). In addition to male sex and age, other key risk factors are smoking, hypertension, and atherosclerosis. Unlike AAAs, thoracic aneurysms are heterogeneous in etiology, patient demographics, and regional progression of diseases (3). Like AAAs, however, basic vessel dimensions are the primary imaging measurement used clinically to risk-stratify patients.

Progression of aortic disease is partially understood. General guidelines exist for managing patients in various clinical contexts. The commonality is surveillance imaging with elective aortic surgery at a threshold aortic diameter or interval growth rate (3,4). Intervention, in other words, is warranted when the risk of not intervening supersedes procedural risk. For example, elective surgery should be considered for ascending aortic diameters greater than 5.5 cm, or at smaller dimensions if a growth rate over 0.5 cm/y is found. However, for both the thoracic and abdominal aortae, a significant percentage of morbidity and mortality is seen with aortic diameters smaller than intervention thresholds (5,6,7,8 and 9). The complexity of aortic disease is not fully revealed by basic anatomic considerations alone.

Current aortic surveillance imaging emphasizes anatomy at the expense of other important and unique considerations for the progression of aortic disease. Two such considerations are (1) the structural status of the aortic wall and (2) the effect of hemodynamics. While not the focus of this chapter, many advances have been made with molecular imaging that allow direct imaging of inflammation within the aortic wall, as well as specific extracellular matrix proteins and pathologic processes (10,11). At the same time, recent developments with MRI allow assessment of dynamic blood flow and a range of associated hemodynamic parameters that may contribute to understanding and predicting disease progression. Hemodynamics has long been implicated in the progression of aortic disease. For example, low wall-shear stress has been linked to atherosclerosis, aortic stenosis to aneurysmal disease of the ascending aorta (i.e., poststenotic dilatation), and focal aortic wall stress to common sites of aortic dissection (5,12,13); but until recent advances in MRI blood flow imaging, routine evaluation of these hemodynamic parameters was not possible. The focus of
this chapter is advanced MRI evaluation of hemodynamics and its potential clinical impact.


Figure 33.1. Systolic blood flow in the great vessels of a normal volunteer as visualized by 4D flow. The 3D streamlines used are aligned with the local velocity vector field at a given moment in time and provide a 3D perspective of instantaneous flow. Red indicates aorta, blue indicates pulmonary artery, and maroon indicates pulmonary veins. The data for this image were collected in a single acquisition of approximately 15 minutes.


CURRENT CLINICAL FLOW IMAGING APPLICATIONS

MRI blood flow imaging is currently used in select clinical setting. Two-dimensional (2D) phase-contrast (PC) MRI is the most common flow-sensitive cardiac sequence used (discussed in Chapter 5). A 2D plane is prescribed in the appropriate orientation for evaluation of a given vessel or heart valve, and time-resolved PC data are acquired in a single direction. The technique allows for quantification of cardiac output, valve regurgitation, severity of vascular and valvular stenosis, pulmonary to systemic flow ratio (i.e., QP/QS ratio, which reflects shunting of blood), differential lung perfusion, and coronary flow reserve. We will focus on aortic valve disease and aortic coarctation.


Aortic Valve Disease

PC MRI allows precise calculation of aortic regurgitation and reasonable estimation of the degree of valve stenosis (14,15,16 and 17). Echocardiography is the initial imaging modality of choice for assessment of cardiac valves. It is both cheaper and faster than MRI, but MRI provides quantification of valve regurgitation whereas echocardiography does not. Instead, echocardiography qualitatively estimates regurgitation based on apparent size of flow jets, which can be affected by imaging parameters and orientation. The usefulness of MRI for valve disease is deemed Class 1, which means that it “provides clinically relevant information and is frequently useful, may be used as first-line imaging technique, and is usually supported by substantial literature” (18). MRI has the additional advantage over echocardiography of superior assessment of related left ventricular status, with accurate and reproducible calculation of ventricular size, function, and mass.

For assessment of aortic regurgitation, an imaging plane perpendicular to the aorta is prescribed, typically 2 to 3 cm above the aortic valve at the vertical, tubular portion of the ascending aorta. The aortic lumen is segmented at each time point for calculation of flow volumes. The regurgitant fraction is the ratio of retrograde to antegrade flow. If there is concomitant aortic stenosis, a higher velocity encoding range (VENC) is needed to avoid aliasing. In some cases, a dual velocity window may be used to obtain optimum flow sensitivity with a high systolic and relatively lower diastolic VENC.

The degree of aortic valve stenosis is estimated by using the modified Bernoulli equation ΔP = 4ν2, where ΔP is the peak pressure gradient in millimeters of mercury and ν is the peak blood flow velocity in meters per second. This technique is also used routinely for Doppler ultrasound. Good accuracy compared to Doppler echocardiography for aortic stenosis has been demonstrated (19). Unlike flow quantification, images may be prescribed in a parallel or perpendicular orientation to the aorta to capture the peak systolic velocities within the vena contracta downstream of the stenotic valve. A theoretical advantage of the volumetric MRI flow sequences described in the next section is a better three-dimensional (3D) localization of the vena contracta. A disadvantage of MRI, however, for pressure gradient estimations compared to echocardiography is its lower temporal resolution.


Aortic Coarctation

MRI has become the imaging modality of choice for evaluation of aortic coarctation (20,21 and 22). Coarctation refers to a narrowing of the distal aortic arch in the region of the ligamentum arteriosum that restricts forward flow. MRI is useful for assessment of both anatomy and hemodynamics. Aortic dimensions are measured with high-resolution, 3D magnetic resonance angiography (MRA) sequences. Blood flow imaging can be used in at least 3 ways for assessment of relevant hemodynamics: (1) Pressure gradient estimation can be performed using velocity data and the modified Bernoulli equation as discussed above; (2) quantification of collateral flow; and (3) evaluation of flow-versus-time profiles in the descending aorta.

Collateral flow occurs with the altered pressure dynamics seen in aortic coarctation. Blood bypasses the region of narrowing through lower pressure intercostal vessels to reach the descending thoracic aorta and beyond. The presence of collateral flow indicates a hemodynamically significant lesion that may require intervention. MRI evaluation is performed with perpendicular planes to the aorta just distal to the coarctation and at the diaphragm. Normal blood flow will drop by approximately 7% over this interval (23). With a hemodynamically significant coarctation, however, flow will increase rather than decrease over the interval through collateral pathways. The percentage increase in flow gives a quantitative measure of the degree of collateralization (23,24 and 25).
When performing this analysis, images must be carefully reviewed for velocity aliasing. The presence of aliasing can simulate a coarctation. Blood flow at the proximal plane will be underestimated and consequently, flow at the distal plane may be incorrectly interpreted as increased.

Flow profile analysis in the descending aorta is another straightforward imaging means of identifying the adverse hemodynamic consequences of an aortic coarctation (21). Normal arterial flow exhibits a rapid systolic upstroke followed by a swift return to baseline (typically within 300 milliseconds). With the obstruction of flow and collateralization seen in aortic coarctation, both the upstroke and return to baseline are delayed. Significant flow persistence into diastole is found. Evaluating these abnormal features of the aortic flow profile is a simple, fast, and reliable means of identifying a hemodynamically significant coarctation. The analysis can be performed at the diaphragm where flow turbulence, aliasing, and stent-related artifacts seen more proximally are not present (26).


EMERGING FLOW APPLICATIONS

Multidimensional MRI blood flow imaging has been increasingly studied (Fig. 33.2) and proposed as a tool for the evaluation of many cardiovascular disease processes including atherosclerosis, aneurysm and, dissection. The technique has become more widely available and easier to use. Timesaving measures like parallel imaging have been employed to reduce scan time to 15 minutes or less, making the technique clinically feasible. Advantages over other modalities and simpler 2D MRI sequences have been enumerated. The technique substantially improves upon echocardiography by capturing volumetric velocity data rather than single-point, single-direction velocity data. Compared to 2D imaging, benefits include complete temporal and spatial coverage of a cardiovascular territory, continuous breathing, no requirement for prospective placement of 2D planes, and many visualization and quantification options for velocity data that are not otherwise available.

The next hurdle in the evolution of MRI aortic blood flow imaging is the demonstration of clear clinical utility. In this chapter, we will discuss how current research is approaching this hurdle, and showcase the clinical potential of MRI hemodynamic imaging. Key features of the technique are the focus of the next section, and then attention will shift to the various hemodynamic parameters that can be assessed with these datasets. Evaluation of these hemodynamic parameters may represent the true clinical value of the technique. The ultimate goal is identification of risk with MRI well before life-threatening aortic complications occur.


Figure 33.2. Four-dimensional flow-related publications have been growing exponentially over the last few years. In 2011, there were over tenfold the number of publications compared to 2005.


MULTIDIMENSIONAL FLOW IMAGING

Dynamic blood flow imaging with MRI most commonly employs a PC pulse sequence. Please refer to Chapter 5 for a more thorough description of the sequence and its use. The terminology used to describe volumetric MRI blood flow imaging can be cumbersome. In this chapter, we will focus on 3D, time-resolved (cine), three-directional PC-MRI. For simplicity, we will call it four-dimensional (4D) 
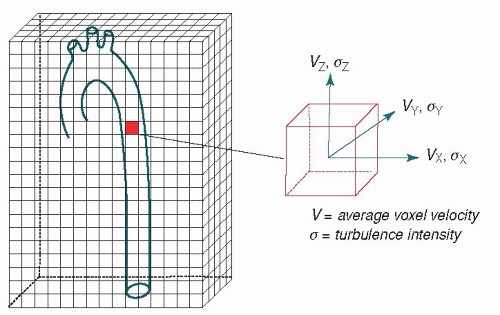
flow, where “4D” refers to 3D plus time, and “flow” to the comprehensive flow field information (mean velocity field and intensity of fluctuating velocity field) obtained by three-directional PC-MRI (
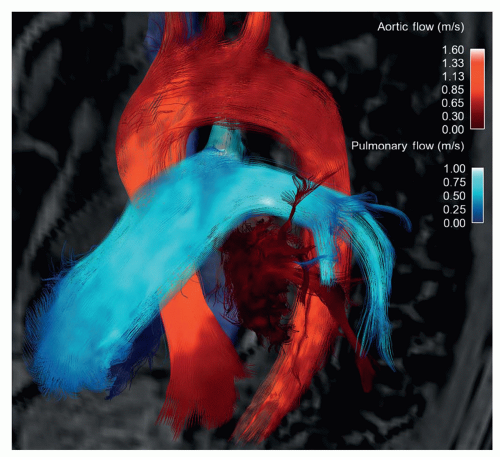
Fig. 33.3). Four-dimensional flow affords an appealing, intuitive visualization of blood flow and unique characterization of vessel hemodynamics not possible with less comprehensive, 2D sequences, or with any other imaging modality.

In conventional 2D cine PC-MRI, the through-plane velocity component of blood flow is measured by applying motion-sensitizing bipolar gradients in this direction. Three-directional VENC can be achieved by applying motion-sensitizing gradients along multiple axes (27,28,29,30 and 31). As in through-plane PC-MRI, the VENC determines the maximum measurable velocity. However, different VENCs can be used for the different axes, and, at the cost of increased scan time, datasets with multiple VENCs can be acquired. Work in the early 1990s with both nontime-resolved 3D PCMRI (32) and time-resolved PC-MRI velocity field imaging based on 2D planes stacked to achieve 3D datasets showed the utility of this type of imaging for uncovering complex,
secondary aortic blood flow characteristics such as helices and vortices (33). Subsequently, true 3D cine PC-MRI or 4D flow acquisitions were developed (31,34,35) and applied to address previously unknown aspects of cardiovascular hemodynamics (36,37 and 38).


Figure 33.3. Three-dimensional cine phase-contrast MRI or 4D flow permits measurements of volumetric three-directional velocity fields that are time-resolved over the cardiac cycle. In addition to three-directional velocities, the technique also permits estimation of the standard deviation of velocity within each image volume element (voxel).


SCAN TIME AND ACCELERATION

Four-dimensional flow has been limited in the past by long scan times. A large number of k-space lines are needed for three-directional VENC with sufficient spatiotemporal resolution and coverage. Full datasets can take well over 30 minutes to acquire, which is too long for routine clinical medicine. We will discuss the various approaches that are used to reduce scan time so as to make 4D flow clinically feasible. Currently, typical aortic 4D flow protocols require about 10 to 20 minutes of scan time (Table 33.1).

One commonly used time-saving approach is k-space segmentation, which enables a trade-off between scan time and temporal resolution via the acquisition of multiple k-space lines per cardiac cycle (39). In addition, substantial advancements have been made to speed up the 4D flow acquisition through k-space undersampling. While undersampling normally causes image artifacts, acquisition, and reconstruction strategies to alleviate, these artifacts exist. Both rectilinear Cartesian and non-Cartesian approaches to k-space sampling can be used.

The Cartesian trajectory is more conventional and widely employed. It is relatively robust to imperfections such as offresonance and eddy currents, but causes fold-over artifacts that can severely degrade the appearance and usefulness of the image when data are not fully sampled. Nevertheless, with the use of multichannel coils, scan acceleration can be effectively employed by undersampling k-space in combination with designated reconstruction algorithms. Parallel imaging methods such as SENSE (SENSitivity Encoding) (40) and GRAPPA (GeneRalized Autocalibrating Partially Parallel Acquisitions) (41) reduce scan time by skipping phase-encoding lines during the acquisition, and then restore the missing data in the image or k-space domain. Parallel imaging reduction factors of 2 are routinely used for 4D flow. Higher reduction factors are being explored with new, high channel count receiver coil arrays.


TABLE 33.1 Example of Parameter Settings for a Cartesian 4D Flow Aorta Protocol


Parameter


Value


Explanation


Velocity encoding range (VENC) (cm/s)


150-300


VENC defines the maximum measurable velocity. Velocities that exceed the VENC are aliased. For some applications, the VENC can intentionally be set below the maximum velocity.


Repetition time (TR) (ms)


4.2-5


The time it takes to acquire one line of k-space. It is often set to the shortest possible value to increase temporal resolution. Its value depends on the VENC. Lower VENCs lead to longer TRs.


Echo time (TE) (ms)


2.5-3


The time from the beginning of the TR until the center of the echo. It is often set to the shortest possible value to minimize various artifacts.


Receiver bandwidth (Hz/pixel)


400-600


The range of frequencies accepted by the receiver to sample the MR signal. Shorter bandwidth not only increases the signal-to-noise ratio (SNR) but also increases chemical shift.


Orientation


Sagittal-oblique


The orientation of the imaging volume.


3D field-of-view (FOV) (mm3)


320×320×70


Volumetric coverage in the readout-, phase-, and slice-encoding directions. FOV is adjusted to encompass the aorta.


3D matrix size, Nx×Ny×Nz


128×128×30


The number of frequency-, phase-, and slice-encoding steps, respectively.


K-space segmentation (Nk)


2-3


The number of k-space lines acquired per cardiac cycle. Higher segmentation factors decrease scan time at the cost of temporal resolution.


Temporal resolution (ms)


35-45


The temporal resolution equals 4•TR/Nk, where 4 is the number of encodings needed for three-directional velocity data (phase reference + three-directional velocity encoding).


Spatial resolution (mm3)


2.5×2.5×2.5


The size of the image volume elements (voxels).


Respiratory efficiency, Reff (%)


60-80


The respiratory gating efficiency is highly dependent on the subject’s breathing pattern.


Parallel imaging net acceleration factor, Rnet


1.8-2


The parallel imaging undersampling rate.


Total scan time for a heart rate (HR) of 75 bpm


11-24


(Ny×Nz)/(Nk×Rnet×Reff × HR) (min)


In recent years, several new methods for acceleration of dynamic MRI have been introduced (42,43,44 and 45). Some allow high acceleration factors for applications other than PC, but PC-MRI velocity mapping, unlike many other MRI methods, relies on accurate reconstruction of the phase of the MR signal. This can be a liability when using high acceleration factors and advanced image reconstruction methods. Temporal smoothing introduced at higher k-t acceleration factors, for example, can lead to inaccuracy in flow measurements and particle trace visualizations (46,47,48 and 
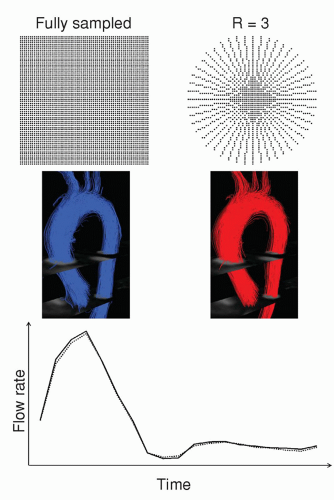
49). Notably, imaging acceleration based on the theory of compressed sensing has rapidly gained popularity in the past few years (44). Compressed sensing goes a step beyond conventional acceleration methods by exploiting the fact that images have inherent sparsity. Its application in 4D flow is underway and preliminary data show promising results (Fig. 33.4).


Figure 33.4. Example of the application of compressed sensing in 4D flow. Streamline visualization of 4D flow data obtained from fully sampled k-space data (left) and threefold undersampled k-space data reconstructed using compressed sensing (right). Bottom: Flow waveforms in the descending aorta measured in the fully sampled data (solid line) and threefold undersampled data (dotted line). Note that the image quality is well maintained in the threefold undersampled data reconstructed with compressed sensing, in spite of three times shorter scan time. (Courtesy of Jing Liu, UCSF.)

Non-Cartesian k-space trajectories are an alternative approach that limits the severity of undersampling artifacts. For example, a radial acquisition can be employed where k-space is traversed along radial lines through its center, rather than with rectilinear lines (50). Undersampling in radial acquisitions results in streak artifacts, but this artifact is typically more forgiving, at least visually, than fold-over artifacts. When streaks are acceptable, the radial pattern is faster than a Cartesian approach without sacrificing spatial resolution. In-plane and 3D radial k-space sampling have been successfully applied to reduce the scan time of 4D flow (51,52). Another approach is spiral k-space trajectories using oscillating gradient waveforms. This results in reduced scan time by using longer readouts and sampling at a higher bandwidth. Spiral 4D flow can generate data with similar quality and accuracy as that obtained with rectilinear Cartesian sampling, but in 50% to 70% less time (53). In the near future, further scan time reductions can be expected from combinations of acceleration techniques and non-Cartesian k-space trajectories, as well as from higher acceleration factors made feasible by high channel count receiver coil arrays.

Another time-consuming aspect of aortic 4D flow is respiratory motion compensation. This is most commonly performed using navigator gating. Other approaches include bellows and self-gating. In navigator-gated scans, one-dimensional (1D) images of the lung-liver interface are acquired once per cardiac cycle. In this way, diaphragm motion can be monitored during scanning and used to gate data acquisition with respect to the respiratory cycle. Conventionally, data are acquired during end-expiration. Depending on the subject’s breathing pattern, navigator gating can significantly add to an already long scan time. Several options for increasing the gating efficiency are available. Most sequences use an acceptance window that is dynamically updated based on the subject’s breathing pattern. This can be combined with techniques that take into account the fact that motion occurring during the acquisition of the outer parts of k-space will degrade image quality less than the same motion during acquisition of central k-space. One such method is respiratoryordered phase encoding, which reorders the acquisition of k-space based on the respiratory position (54). This method has been suggested to reduce motion artifacts in 4D flow and thereby allow the use of a larger gating window (55). Another option is to use different gating windows for different parts of k-space, that is, narrower window for central k-space (k-space inspired navigator gating [KING], Philips Healthcare, Best, the Netherlands). An alternative to navigators is self-gating, which broadly refers to a sequence that acquires data for motion compensation without the use of navigators. A self-gated 4D flow sequence that repeatedly acquires 1D projections of the entire imaging volume to detect motion has been implemented (56). To maximize sensitivity for respiratory motion, only the coil element closest to the diaphragm is used and the readout direction is oriented in the feet-to-head direction, similar to conventional respiratory navigators.


VISUALIZATION

Multidimensional flow visualization is an integral part of 4D flow (Fig. 33.5). Informative visualizations of the dynamic velocity fields are often generated using vector plots or particle trace techniques such as streamlines and pathlines (32,36,57

Only gold members can continue reading. Log In or Register to continue

Stay updated, free articles. Join our Telegram channel

May 24, 2016 | Posted by in CARDIOLOGY | Comments Off on Thoracic Aorta Disease: Flow Evaluation by MR

Full access? Get Clinical Tree

Get Clinical Tree app for offline access